

Monitor email deliverability dashboard
Use this page to investigate delivery issues, bounce patterns, spam rate spikes, and authentication problems using the email deliverability dashboard. Each section maps to a dashboard section and walks you through what to check and what to do next.
Deliverability overview
Identify provider-specific delivery issues
Check the Deliverability by top email domains report to see which mailbox provider is affected. If the issue spans all providers, check the Deliverability by sending IP and integration report to see if it's tied to a specific IP address or integration.
NoteSending IP data is only available for Mailgun integrations.
Compare campaign deliverability performance
Use the Deliverability by email campaigns report to compare delivery rate, open rate, click-through rate, and bounce rates across campaigns. This helps you find underperforming campaigns and learn from your best ones.
Detect delivery slowdowns
If emails are taking longer than usual to arrive, use the Emails by time to delivery by top domains report to find which provider is causing the delay. You can then reduce sending volume to that provider or spread your sends over 1–3 hours.
Failed sends and bounces use cases
Diagnose bounce patterns
Check the Soft bounced reasons and Hard bounced reasons reports to see whether you're dealing with temporary issues or invalid addresses. Hard-bounced and repeatedly soft-bouncing addresses are automatically removed from your contact list. If you spot recurring misspelled domains—for example, "gmial.com" instead of "gmail.com"—add them to your Custom suppression list to prevent future sends.
Fix template and targeting errors
Check the Failed send reasons report to find issues such as consent violations, frequency cap breaches, or template errors.
Audience health
Maintain audience engagement health
Use the Customers by emails since last engagement report to find contacts who received 100 or more emails without engaging. Exclude them from regular campaigns and move them to a re-engagement campaign instead. This protects your sender reputation.
Understand list invalidation
Check the Customers invalidated reasons report to see why contacts are being removed—for example, hard bounces or compliance issues—and improve how you collect or maintain your list.
External deliverability
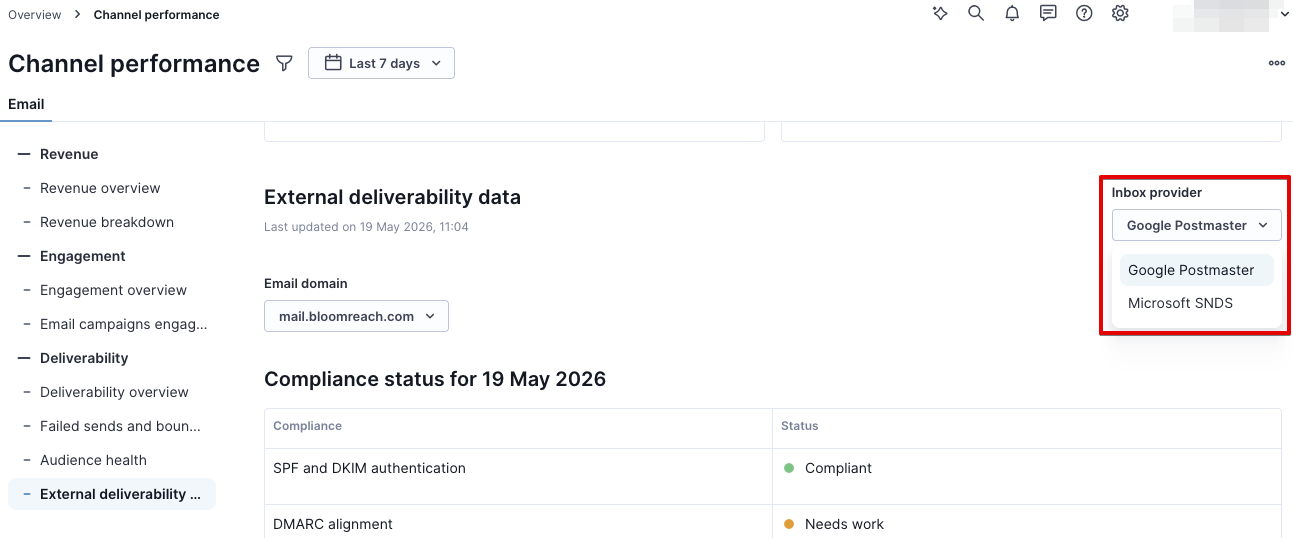
The external deliverability data section surfaces reputation, spam rate, and authentication signals from Google Postmaster Tools and Microsoft SNDS. Use the Inbox provider dropdown to switch between the 2 sources.
NoteExternal deliverability data requires a connected Google Postmaster Tools or Microsoft SNDS integration. See Set up external deliverability data integrations.
The external deliverability data section surfaces reputation, spam rate, and authentication signals from Google Postmaster Tools and Microsoft SNDS. Use the Inbox provider dropdown to switch between the 2 sources.
All dates in this section are in UTC. When you select a date, the dashboard returns data for that full UTC calendar day—00:00 to 23:59 UTC—regardless of your local time zone. This is accurate for daily aggregates like spam rate and complaint rate, but worth keeping in mind when investigating a specific incident.
Monitor sender reputation and authentication
Select Google Postmaster Tools in the Inbox provider dropdown to check the Compliance status panel. It shows the current status of each Gmail sender requirement—authentication, alignment, encryption, spam rate, and unsubscribe compliance—as Compliant, Needs work, or Not evaluated. Start with SPF and DKIM authentication and DMARC alignment if either shows Needs work. This panel always shows Google's latest snapshot and isn't affected by the date filter—there is no historical view for compliance.
Select Microsoft SNDSto check the Filter spam results chart. It shows how Microsoft categorizes mail from each sending IP:
- Green—less than 10% judged as spam
- Yellow—10–90%
- Red—more than 90%
The Blocked IPs panel shows any IPs Microsoft has flagged as blocked, bot-like, or junked. To address a block, use Microsoft's Postmaster portal—the dashboard surfaces the status but can't lift blocks directly.
Detect and investigate a spam rate spike
In Google Postmaster Tools section, check the Spam rate chart. Two reference lines show where you stand: 0.1% (recommended ceiling) and 0.3% (where damage to delivery (or deliverability) begins). The summary cards show the average rate, days over 0.3%, and the last date the rate exceeded 0.3%.
If the cards show N/A after connecting the integration, the date range may only be partially covered. The dashboard defaults to a 1-day range on first open—widen it once data fills in.
To cross-check the spike across providers, check the Complaint rate in the Microsoft SNDS section. Complaint rates tend to correlate across providers and can help confirm whether the issue is broader than Gmail.
Triage an authentication drop
In the Google Postmaster Tools section, check the Authentication success rates chart. It shows daily pass rates for DKIM, SPF, and DMARC so you can see when the drop started. Then check Compliance status to confirm what currently needs fixing.
Check email encryption
In the Google Postmaster Tools section, check the Encrypted traffic chart. It shows daily rates for inbound and outbound encrypted connections. Emails sent through Bloomreach are encrypted by default. A drop in either line typically means a platform issue on the Bloomreach side, or another source sending emails via the same domain outside of Bloomreach campaigns. Contact Bloomreach Support if you see an unexplained drop.
Investigate a complaint spike for Microsoft mailboxes
In Microsoft SNDS section, check the Complaint rate chart to see which IP and which days are affected. The Data breakdown by day and IP table gives you the full detail.
If the complaint rate shows above 100% on a particular day, that's expected—Microsoft records complaints on the day they were reported, not the day the email was delivered. A flood of late complaints can push the rate above 100% on a low-send day.
Spot list-hygiene problems with spam trap data
In Microsoft SNDS section, check the Trap hits chart. It shows how many emails were sent to spam trap addresses per IP per day. Consistent hits usually mean your list includes old or invalid addresses. Use the Data breakdown by day and IP table to see which IPs are affected.
Feedback loop spam rate
The Feedback loop spam rate panel shows the percentage of emails that Gmail users marked as spam, broken down by campaign. To attribute complaints to individual campaigns, Gmail uses a Feedback-ID—a tag in the header of each outgoing email. Without it, Gmail can't identify which campaign a complaint came from.
Most users see no data or only a generic "email" identifier in this panel. Data appears once campaign identifiers are available in your emails.
When data is available, the panel shows:
- A line for the average spam rate across all campaigns with a Feedback-ID.
- Bars for the number of distinct campaigns reported that day.
A breakdown table below shows one row per campaign per day. Always check this table before drawing conclusions from the daily average—a small number of low-volume campaigns can pull the average up even when your main campaigns are healthy.
If the panel shows no data, check the Complaint rate in the Microsoft SNDS section instead. Complaint rates tend to correlate across providers, so a spike visible in Microsoft data is usually a reliable signal of broader delivery issues.
Updated 9 days ago