Time-based Session_start Analytics
This guide will help you understand
- What is time-based session_start analytics
- Why you should use it and what insights you can gain
- How to create this analysis step-by-step using Bloomreach Engagement
- Creating the segmentation
- Creating a report with a daily overview
- Troubleshooting
What is time-based session_start analytics
These analytics are in essence an advancement on the industry standard “new versus returning” way of viewing your session_starts. This advanced way of viewing your sessions will effectively break down the "returning" into more detailed segments. Understanding how to perform this will allow you to (1) understand retention patterns among your customers, (2) build audiences based on this for UX, Retargeting or Email and (3) monitor the overall health of your e-commerce enterprise.
Time-based session_start analytics drill down the event session_start by the numerical answer to - “how long ago, in days, has the previous session_start occurred”. Session_start is an event that is tracked by Bloomreach Engagement to the customer when a device connects to a website with Engagement's tracking. In this analysis, we break down the time of “how long ago” into “# of days since the last sesion_start”.
Why you should use this analysis
The primary value of doing this analysis is that is a more in-depth version of new v returning session_starts. Additionally, it allows you to better understand your retention and acquisition of customer behavior. Lastly, these insights can be directly tied-in to action - an Email, UX intervention or pushing enriched information into a retargeting audience.
How your analysis will look like
We will show you how to create a basic segmentation and also a traffic report with a view per day.
The basic segmentation:
| Insights |
|---|
| As seen above, there were 5.5M session_start for our company, broken down into these 7 categories of session_starts. Roughly 55% of all session_starts in the past 3 months have been 1st session_starts. Around 24% of session_starts occur within 24 hours of the last one. As a general trend, we typically observe more mature businesses with a higher proportion of returnees, particularly between 1-7 days; while for more up-start business we observe a higher proportion of 1st.session_starts often as a result of paid traffic. |
How to create the analysis using Bloomreach Engagement
| Requirements | |
|---|---|
| Bloomreach Engagement skills | Basic - we will show you step-by-step how to create this analysis using an Expression and Event segmentation. We assume you can navigate and do basic operations in Bloomreach Engagement. |
| Data and tracking | Tracking of the session_start event(Recommended at least 2 months of the data) |
Creating the segmentation
We will need to create an Expression to calculate the time between session_starts, which we will then be used the Event segmentation itself.
1. Create the expression
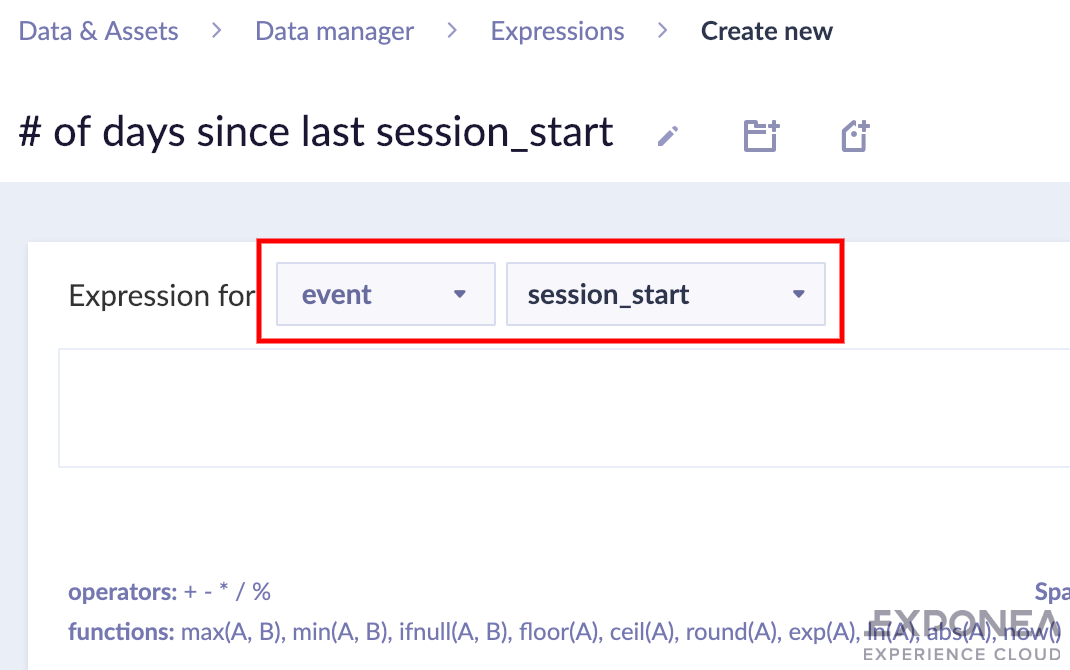
a. In the Data manager, create an expression for the event session_start.
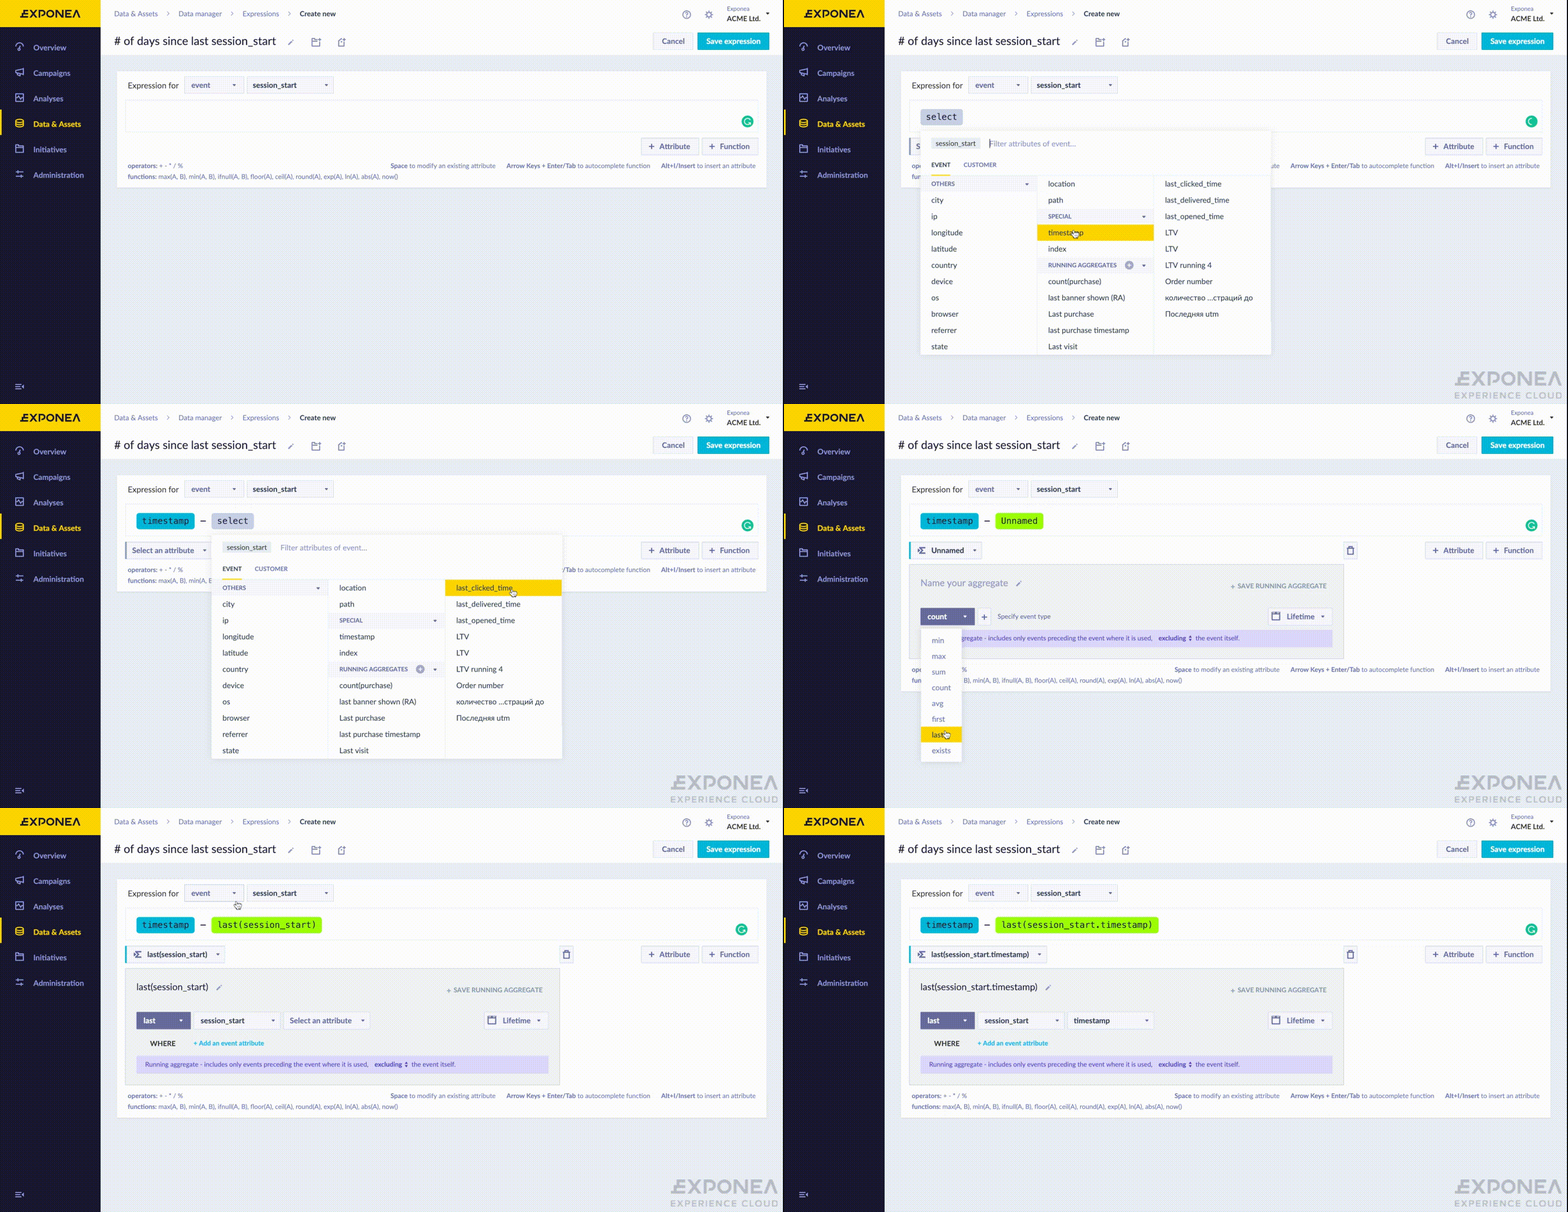
b. Add the timestamp attribute as per the GIF below. This means that Bloomreach Engagement will return the `timestamp` of every `session_start` event we are currently looking at.
c. Add an arithmetic operator using your keyboard and add a running aggregate last session_start timestamp. Here Bloomreach Engagement will look at the timestamp of the previous `session_start` event so we can subtract those two and get the time difference. If the dynamic variable does not exist, the Expression will return no value. This will signify 1st.session_starts.
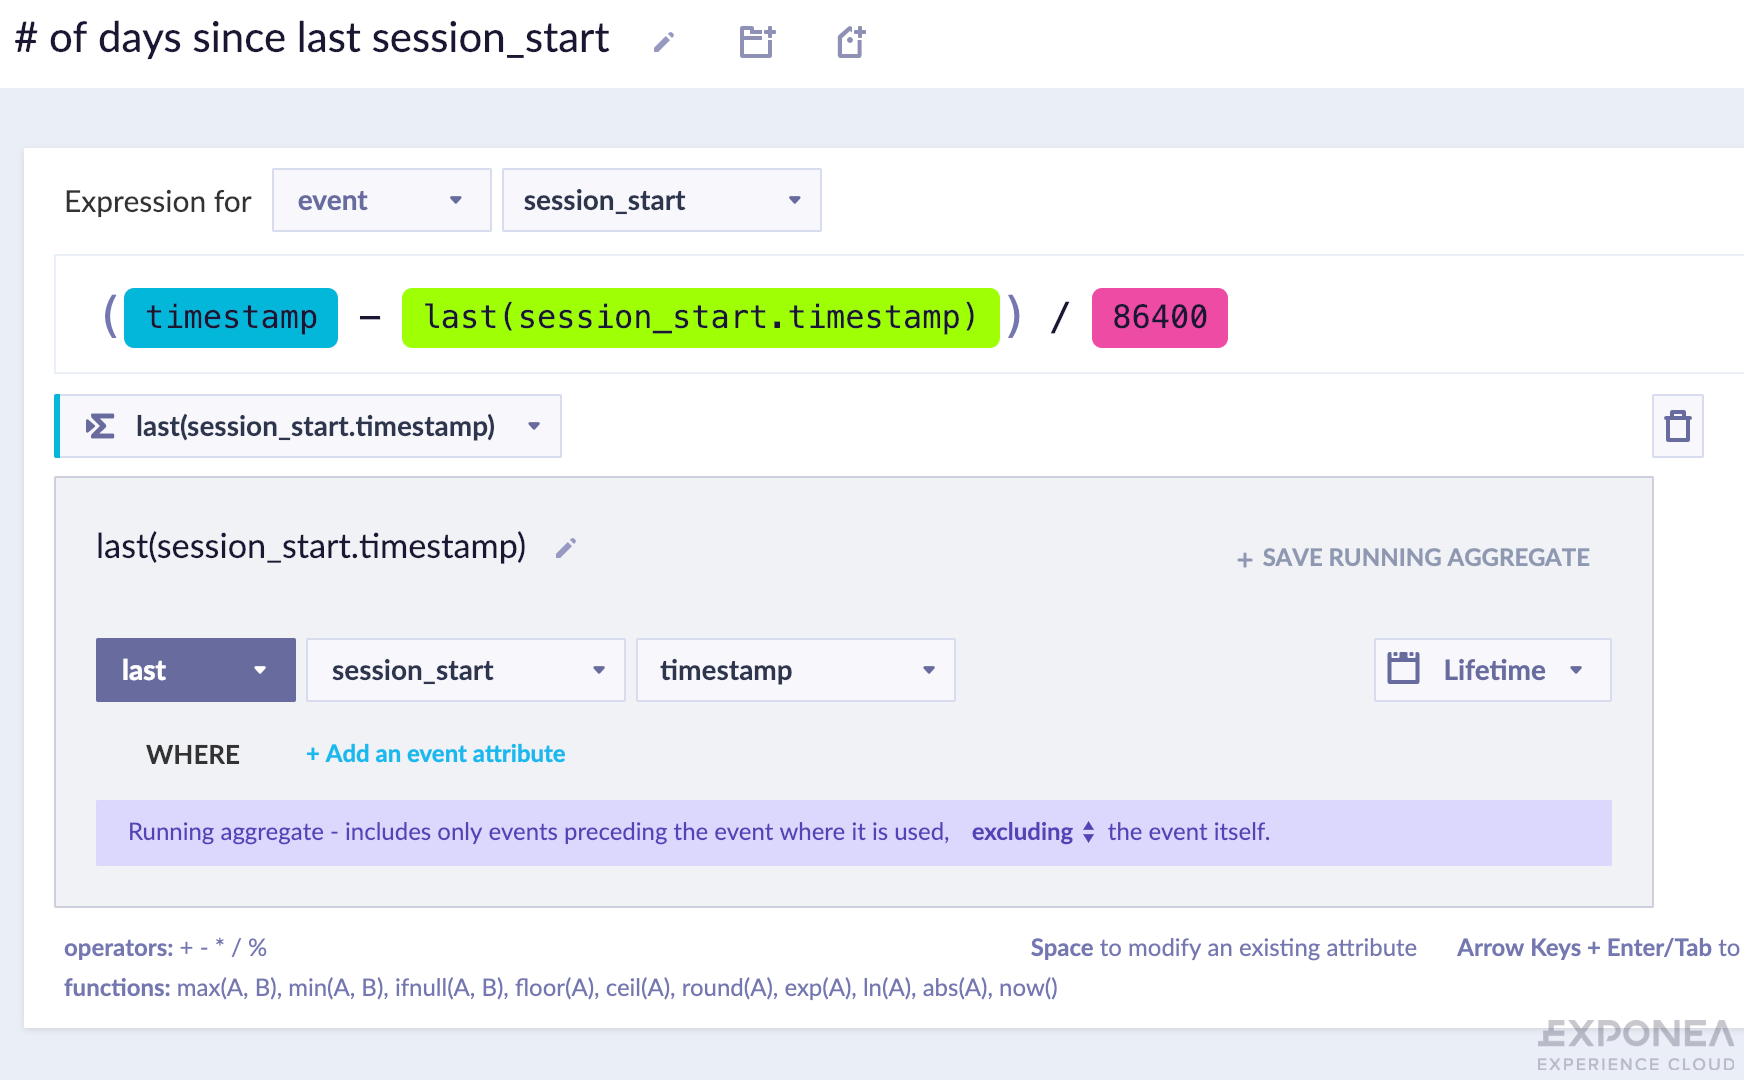
d. Using your keyboard, divide the whole formula by 86 400 and add brackets as per the screenshot below. As timestamps count each second, if we want to report our data by days, we need to divide the result by the number of seconds of one day, which is 86 400.
Good job!
Your expression is now complete. Click save.
2. Create the event segmentation session_starts by(# of days since last session_start)
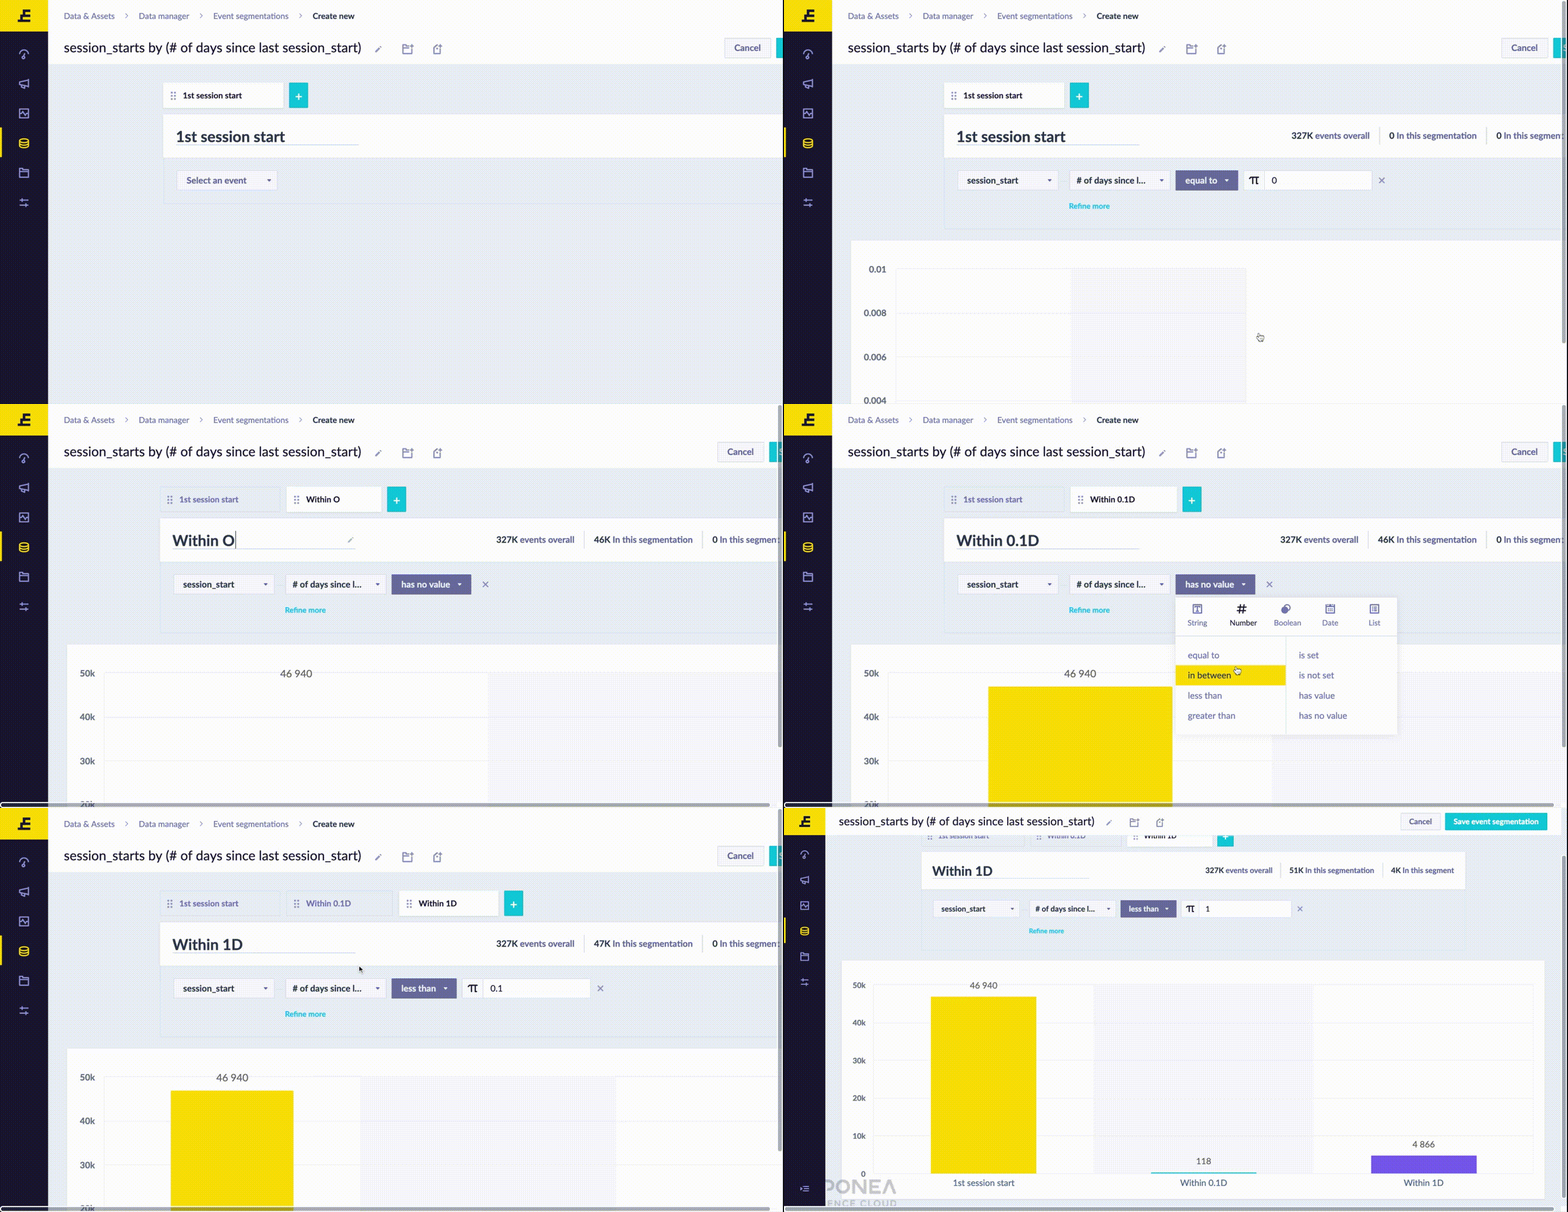
Create a new event segmentation in the data manager. You will need to create 7 segments, each for the group you want to look at, as shown in this screenshot. The GIF below shows how to create the first 3 of those segments.
Tip
You can speed up your work by copying each segment and then editing its properties (instead of creating a new segment each time) as shown in the GIF above.
Good job!
You have now created the event segmentation and can use it in your dashboards. Don't forget to click save.
Creating a report with a daily overview
Now you can create a report based on the segmentation which will show you what groups of customers are coming to your website, unique per day (based on the last session_start). This can then be saved in Dashboards.
| Insights |
|---|
| This Traffic Report allows you to see the number of all session_starts with each returnee value. As you can see in the table above traffic for the 12th to 19th November, the spike in traffic on the 16th of November is primarily attributed to a spike in 1st session_starts. This makes it clear that there was something working extra on the acquisition side of things. However, we also see increases in the retention segments, as 30+ day returns have doubled in the period on the 16th of Nov. |
The whole setup of the report is highlighted in the screenshot and the table below:
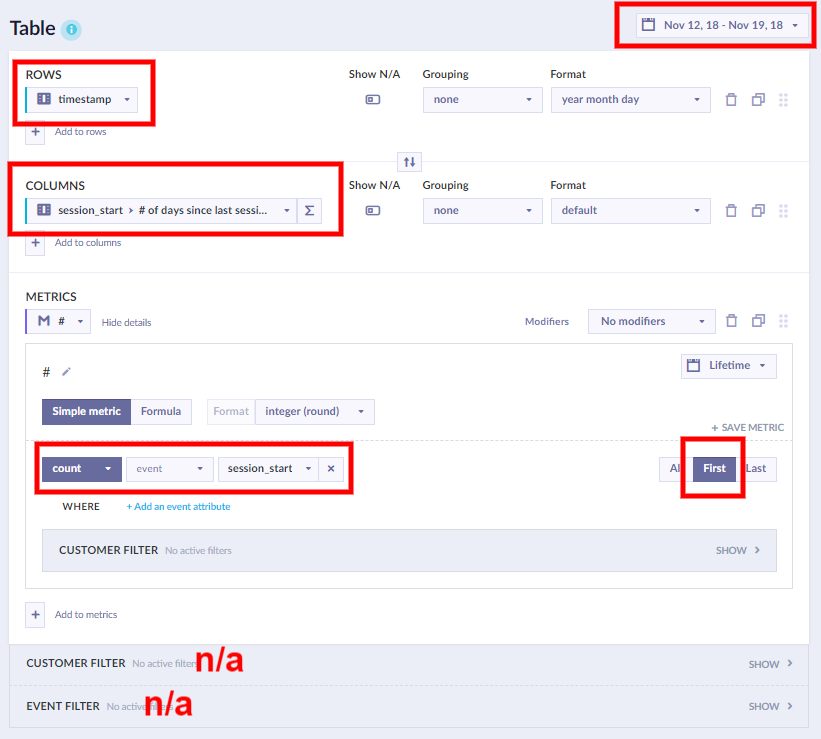
| Report settings | |
|---|---|
| Date Filter | Set for which period do you want to report (1 week recommended) |
| Rows | Select timestampGrouping: None * Format: Year month day |
| Columns | Select the event segmentation you created in the previous steps. It will appear in the list of events, under Event segmentations |
| Metrics | Count event session_startSelect "First" |
Troubleshooting FAQ
See our troubleshooting guide to find answers to the following question and more:
- I don't see the expression/segmentation/aggregate I created in the list of events/attributes
Updated about 2 years ago
