Metrics
Metrics are numbers from your data that are used in dashboards or within reports. Commonly used metrics are the total revenue, the number of unique visitors or buyers in a given period, the conversion rate (the number of buyers per visitor), RPV (revenue per visitor). A metric can either be calculated as an aggregate of one event type or as a formula including more event types.
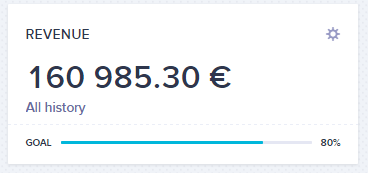
Metric presented in a dashboard
Watch this short introductory video about this feature:
How to create metrics
You can create a new metric in 3 ways:
- Go to
Data & Assets>Metrics>Create new. Once you save it, you can use it in a dashboard or a report. - In the dashboard edit view when adding a metric, you can click
Create newand specify your metric. - In a report. This metric doesn't have to be saved for use outside of the report unless you click Save as shown in the screenshot below.
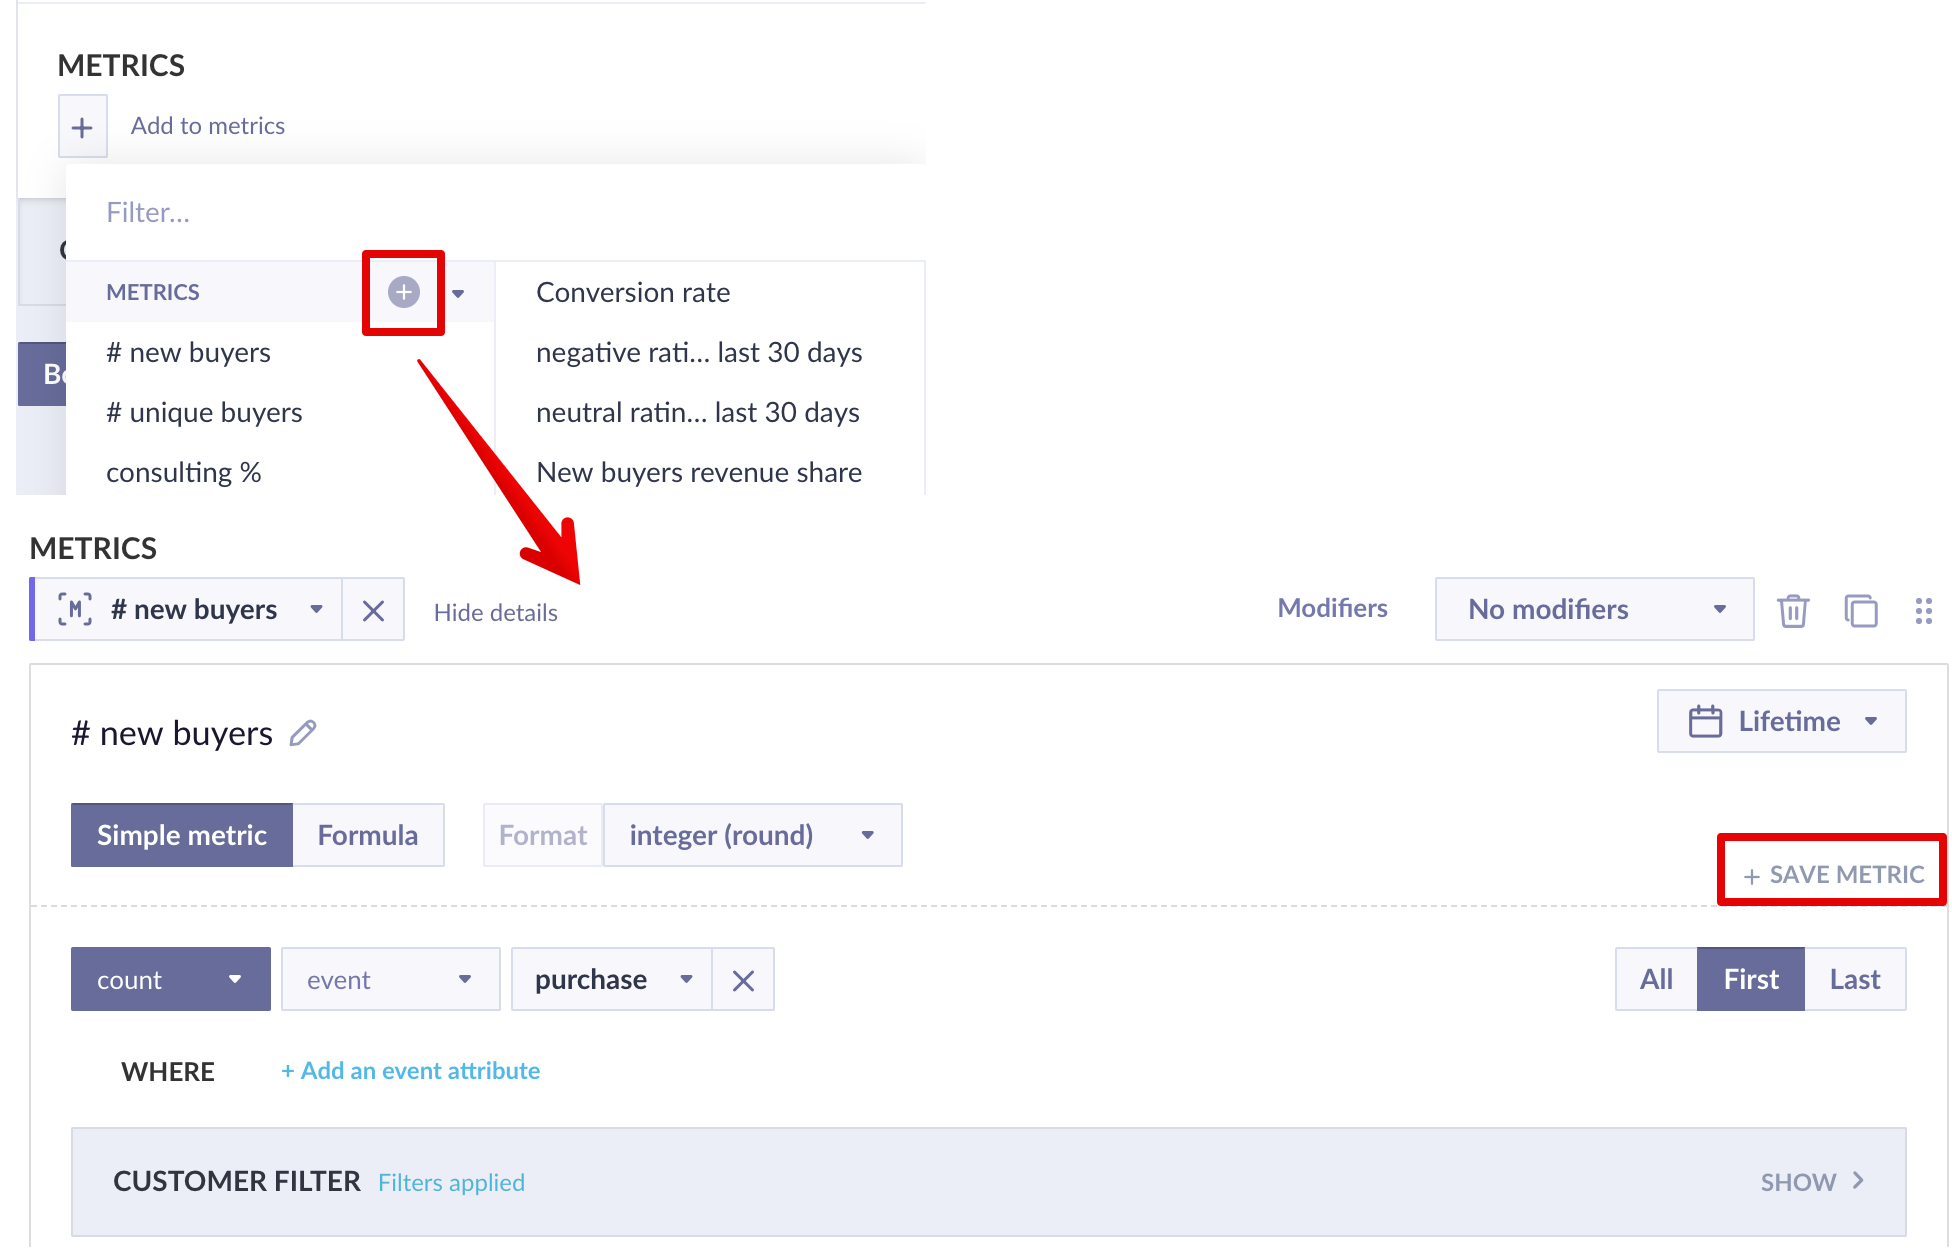
Metric editor explained
We will now explain every part of the metric editor as numbered in the screenshot below.
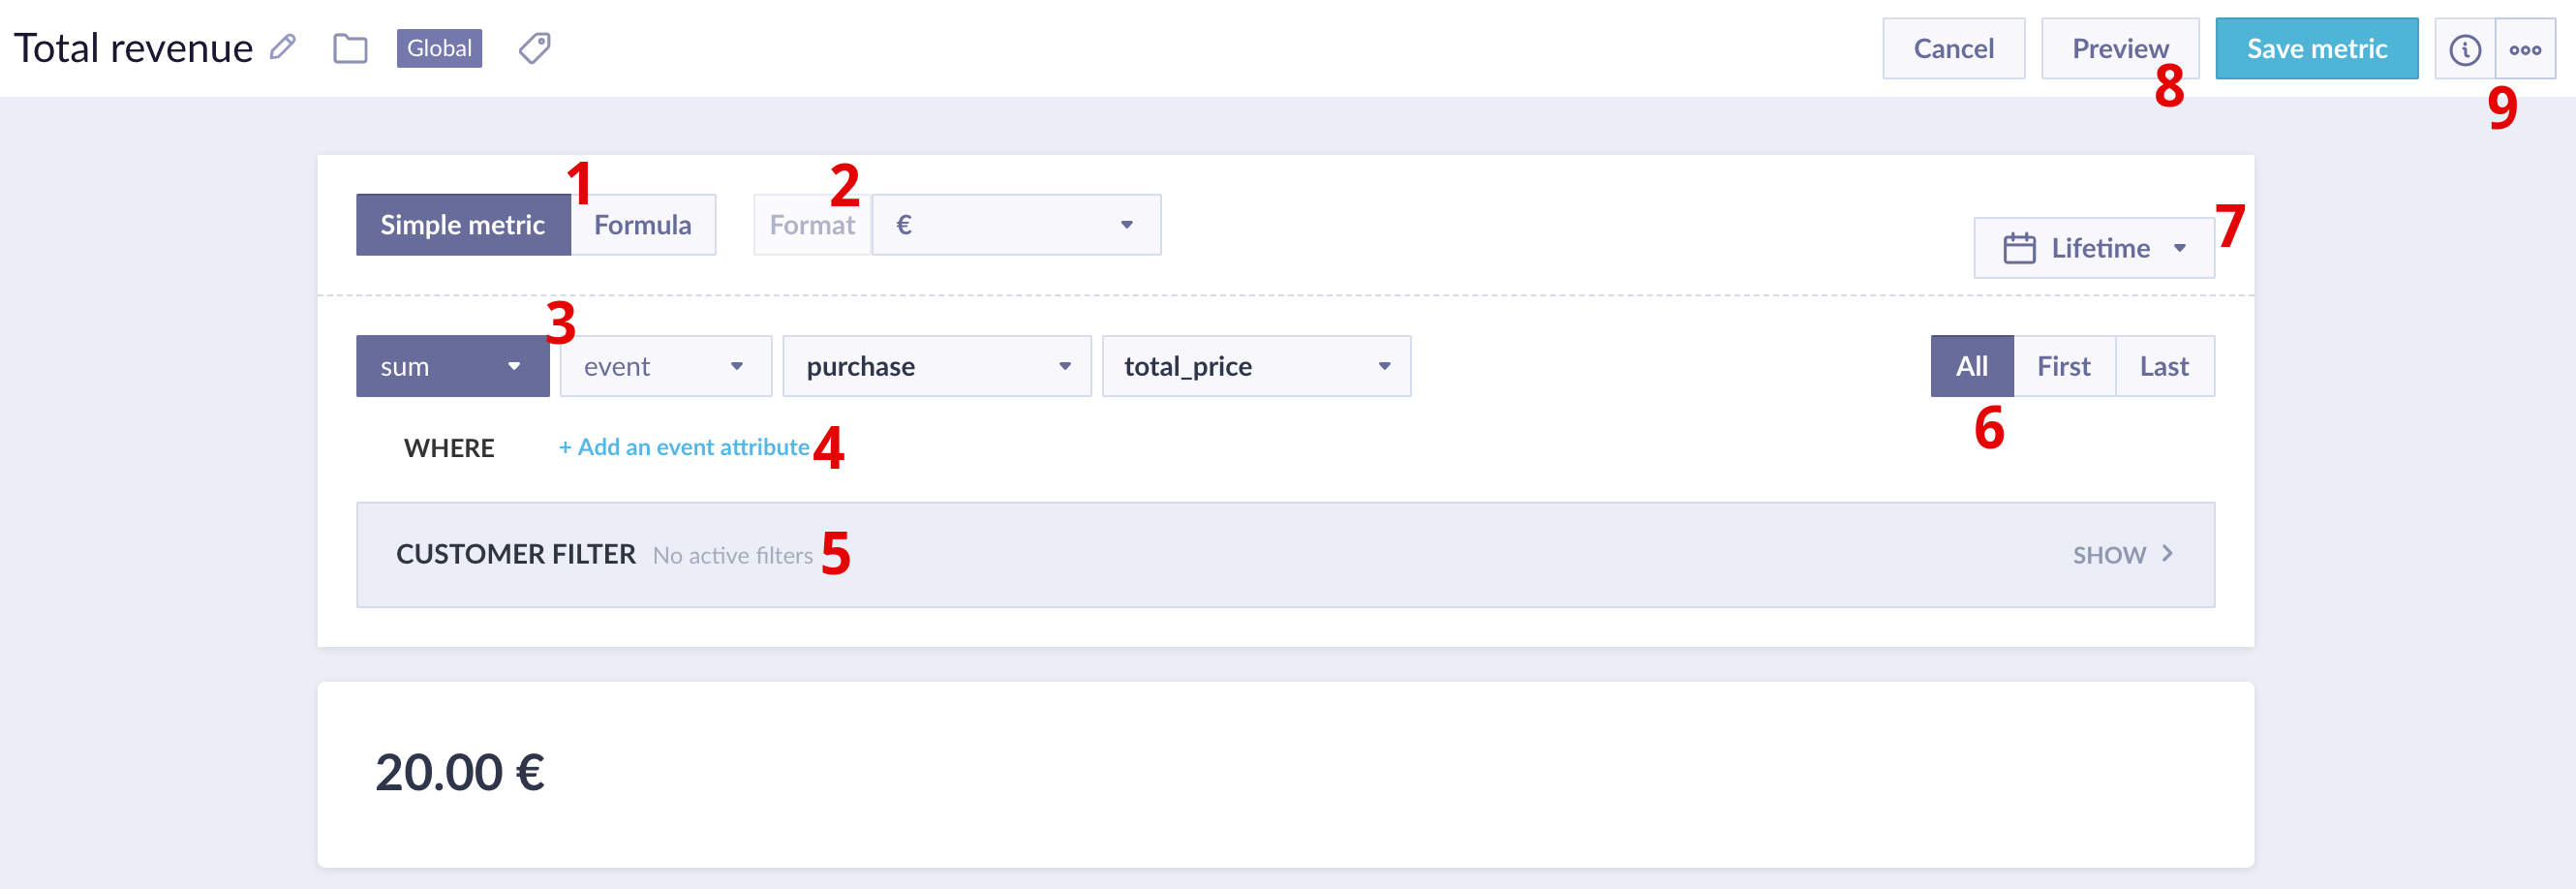
1. Simple metric or formula
A simple metric is only based on a single event type, whereas a formula allows you to calculate a number using multiple simple metrics together. You can change a mathematical operator by clicking on it. This will also allow you to put the two metrics around it into brackets. You can also add a simple number as indicated in the screenshot below.
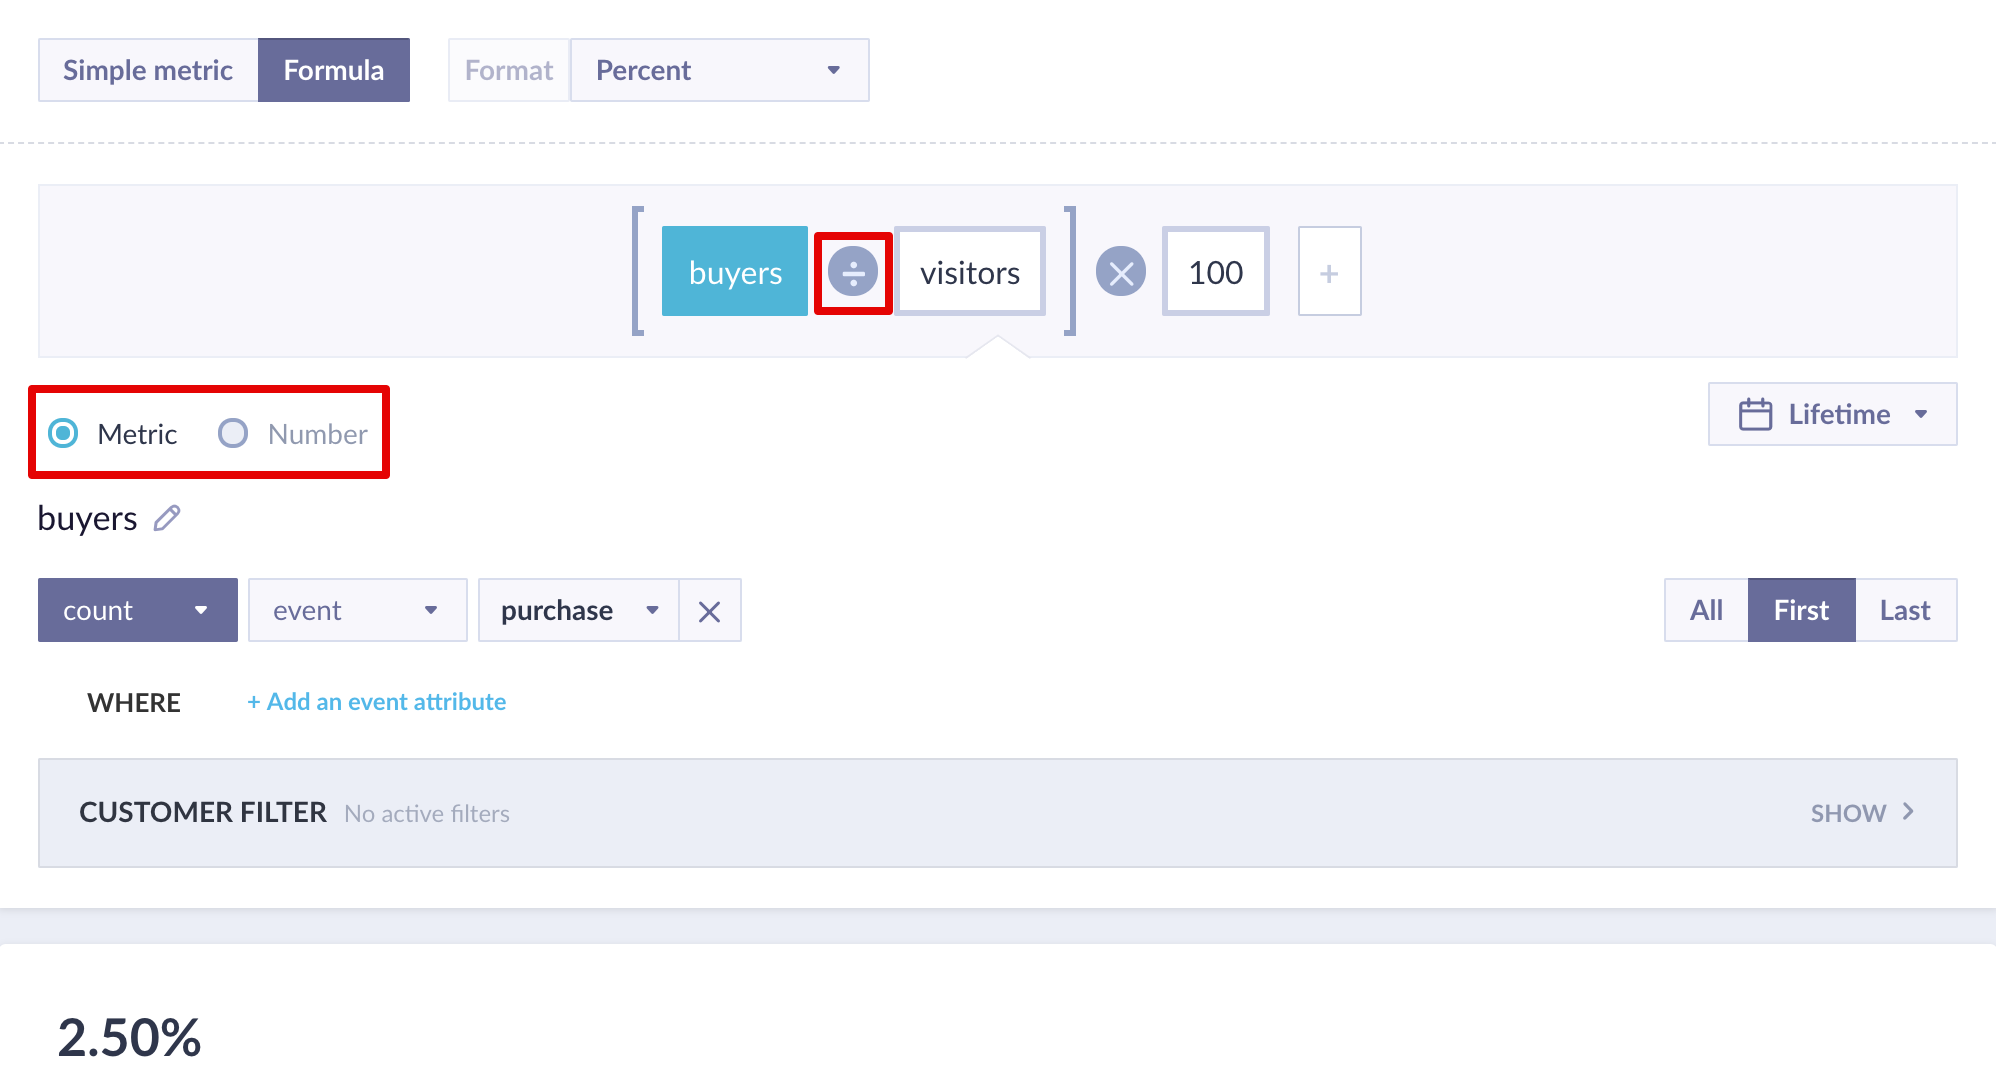
Conversion rate metric
2. Format
This drop-down menu allows you to select the output format of your metric. The following options are available:
| Date format | Returns a date based on the timestamp of the selected event. For example, if you select max > purchase > timestamp and select one of the date formats, it will return the date of the last purchase that happened on your site. |
| Date part | Similar as above, but this returns a specific part of the date. For example, "Year" will return the actual year when the event was tracked, "Month" will return a number between 1-12, "Day of year" can be 1-365, "weekday" returns 1-7. |
| Date difference | Similar as above but in this case, you will get a number depicting how long ago the event happened. You can select a format from seconds to years. |
| Numeric | Floating point - returns the full number Integer - nearest whole number Percent - rounds to 2 decimal places and adds "%" behind the number Financial - rounds to 2 decimal places and adds a selected financial symbol behind the number * Round - Rounds the number to selected decimal places |
3. Data aggregation rule
This drop-down menu allows you to select how the data from the selected attribute will be processed. You can find the definition of each operator in the Aggregates and running aggregates article.
4. Event filter
If you're working with event attributes, you can refine your metrics by other attributes of the same event. For example, one of the screenshots above calculates the total revenue as sum > purchase > total_price. We can refine this further by adding another condition: where total_price > less than 1000. This will exclude every event purchase where the attribute total_price was greater than 999 and will not include it in the final metric number. Bear in mind that you can only refine the metric by attributes of the same event, in this case purchase.
Read more about using filters in the Filtering data article.
5. Customer filter
Customer filters don't filter the event directly, but rather filter the customers to be considered in your output.
Read more about using filters in Bloomreach Engagement as well as the difference between customer and event filters in the Filtering data article.
Customer-based vs event-based metrics
Know your difference between customer-based and event-based metrics by reading this article.
6. All, first, and last
This toggle switch appears when you're working with an event attribute.
| All | Processes all events that match the condition |
| First | Processes the first occurrence of an event per customer within specified constraints, such as a date filter. |
| Last | Processes the last occurrence of an event per customer within specified constraints, such as a date filter. |
Counting buyers
To count the unique buyers, set
count > event > purchaseand set the toggle toFirst. This looks at all purchases but counts only the first event for every customer, which means you will get the number of unique buyers. You can also useLastin the same way.
7. Date filter
You can also filter by a specific time range. Read more about how date filters work in the Filtering data article.
8. Preview
Click preview to see the output of your current setup.
9. More actions
By clicking on the ℹ️ button, you will see information about who created and edited the metric and when. You can also add a description of the metric. If you check the "Show in view mode" button, your description will be displayed when someone views the metric in Data & Assets. This might be useful if you want to add any explanations for other users.
Click on the three dots if you want to save as copy, add to dashboard, clone to another project or delete the metric.
Time filters do not apply to the Metrics that use aggregates inside of them.
Customer and event metrics
It is important to understand when to use the appropriate metric type in reports to get correct and reliable results. Each metric adds constraints to the dataset of the report. There are two types of metrics in Engagement that can be used in reports:
-
Customer metrics selects whole customer profiles. Therefore, the output of such metrics is the number of customers that match it, not the number of events. Customer metrics are typically used when there is a need to reflect how many customers with a particular property exist in the project or how many customers have made a specific sequence of actions recorded as events.
-
Event metrics work on the level of individual events. Therefore, the output of such metrics is the number of events. Event metrics are usually used when there is a need to reflect the effectiveness of communication campaigns or calculate how often a certain type of event occurs over a certain period of time in the project, for example, how often and on what days of the week a product is purchased.
Consider the below report as an example. The objective is to check how many customers have received each campaign by drilling down metrics results by campaign name.
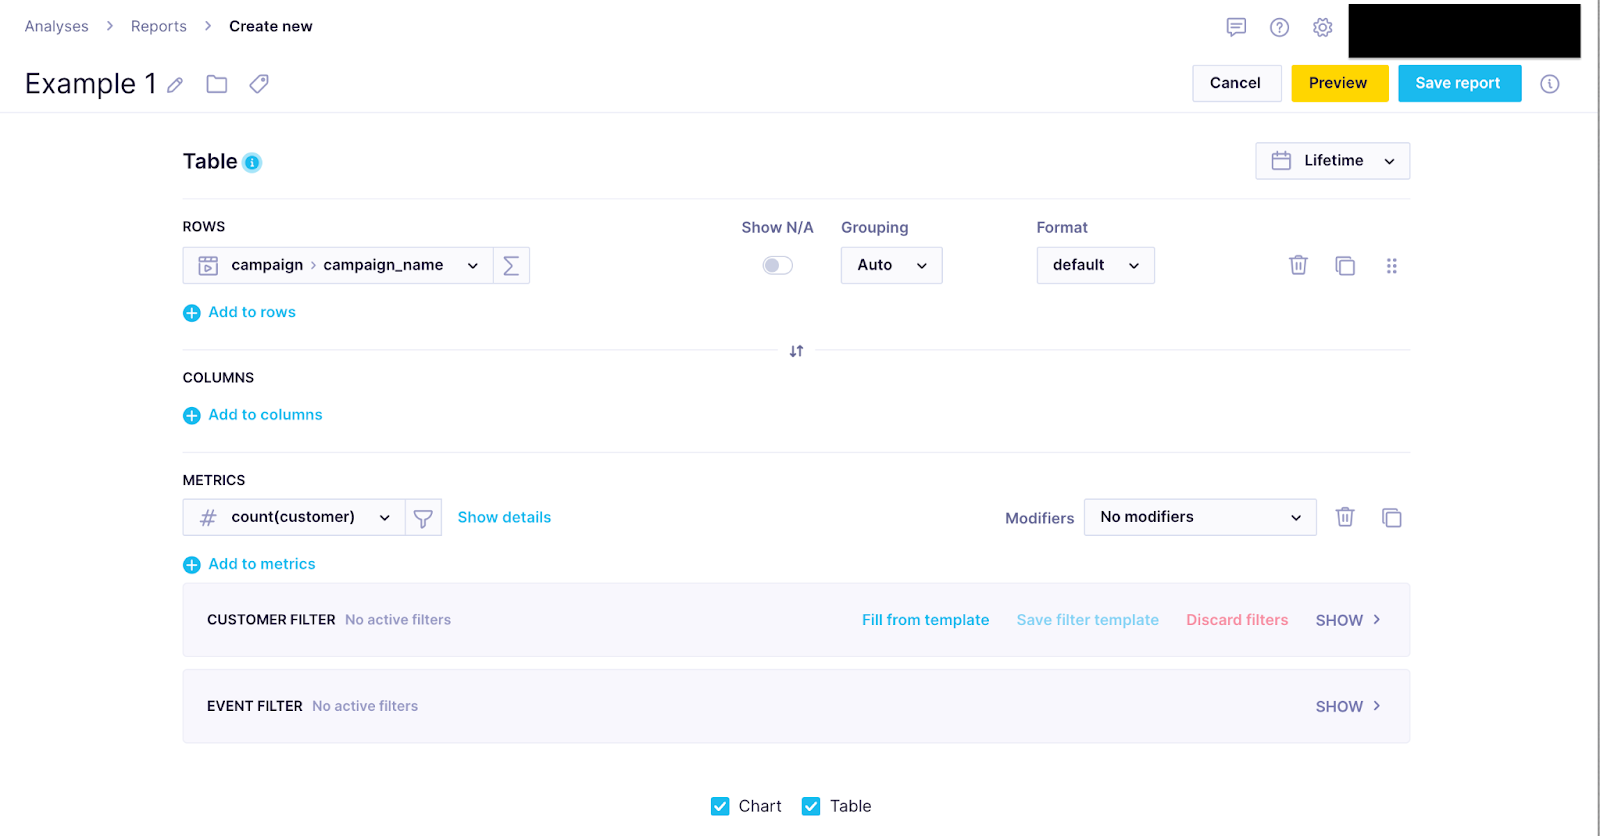
Report for checking number of customers receiving the campaign
The report uses customer metrics, and a campaign attribute campaign_name is used in rows. The resulting table gives the number of customers who have received each email campaign.
However, the same result can be achieved using an event-based metric where only the first event per customer is counted.
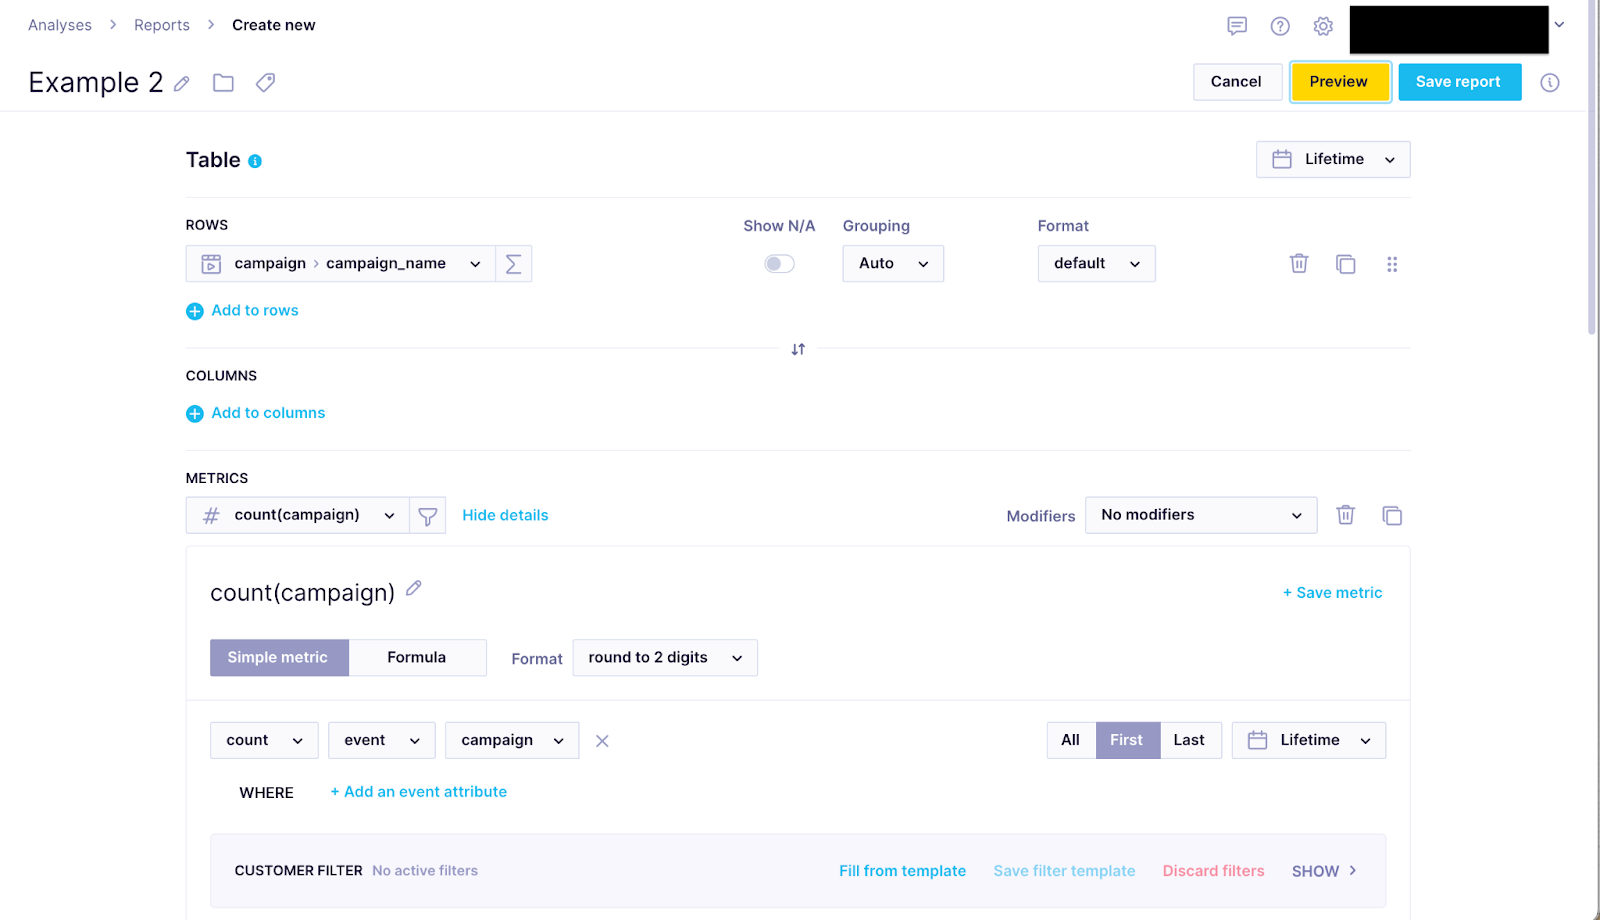
Same report using Event metrics
It is important to note that while both metrics can behave quite alike, the choice of a metric type depends on the report context and the desired outcome (customers or events).
Another difference between customer and event metrics is that customer metrics do not react to date filters. Date filters only affect event data (event metrics or event attributes) present in the report. Therefore, the report below shows the number of customers who had at least one merge event in their profiles regardless of when that event happened.
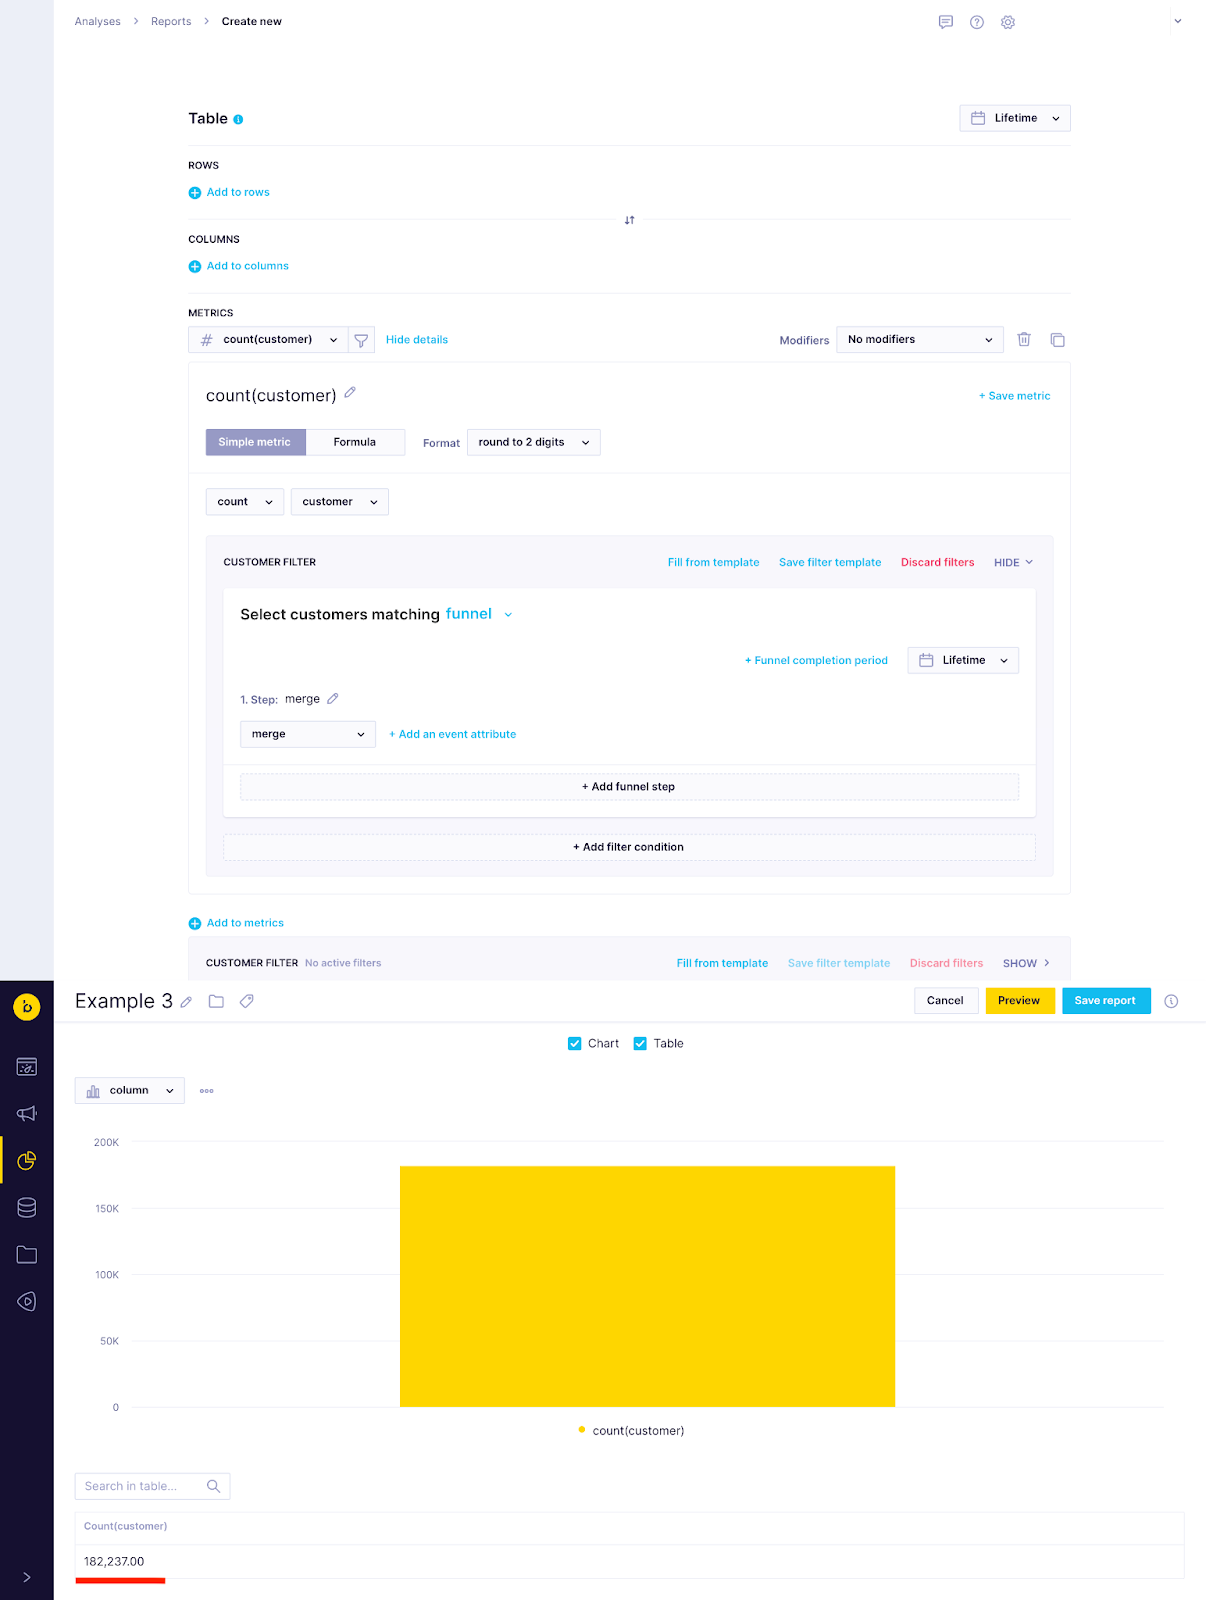
Using Date Filters in Customer metrics
Even if the date filter is changed to Today, the value of the metric remains the same.
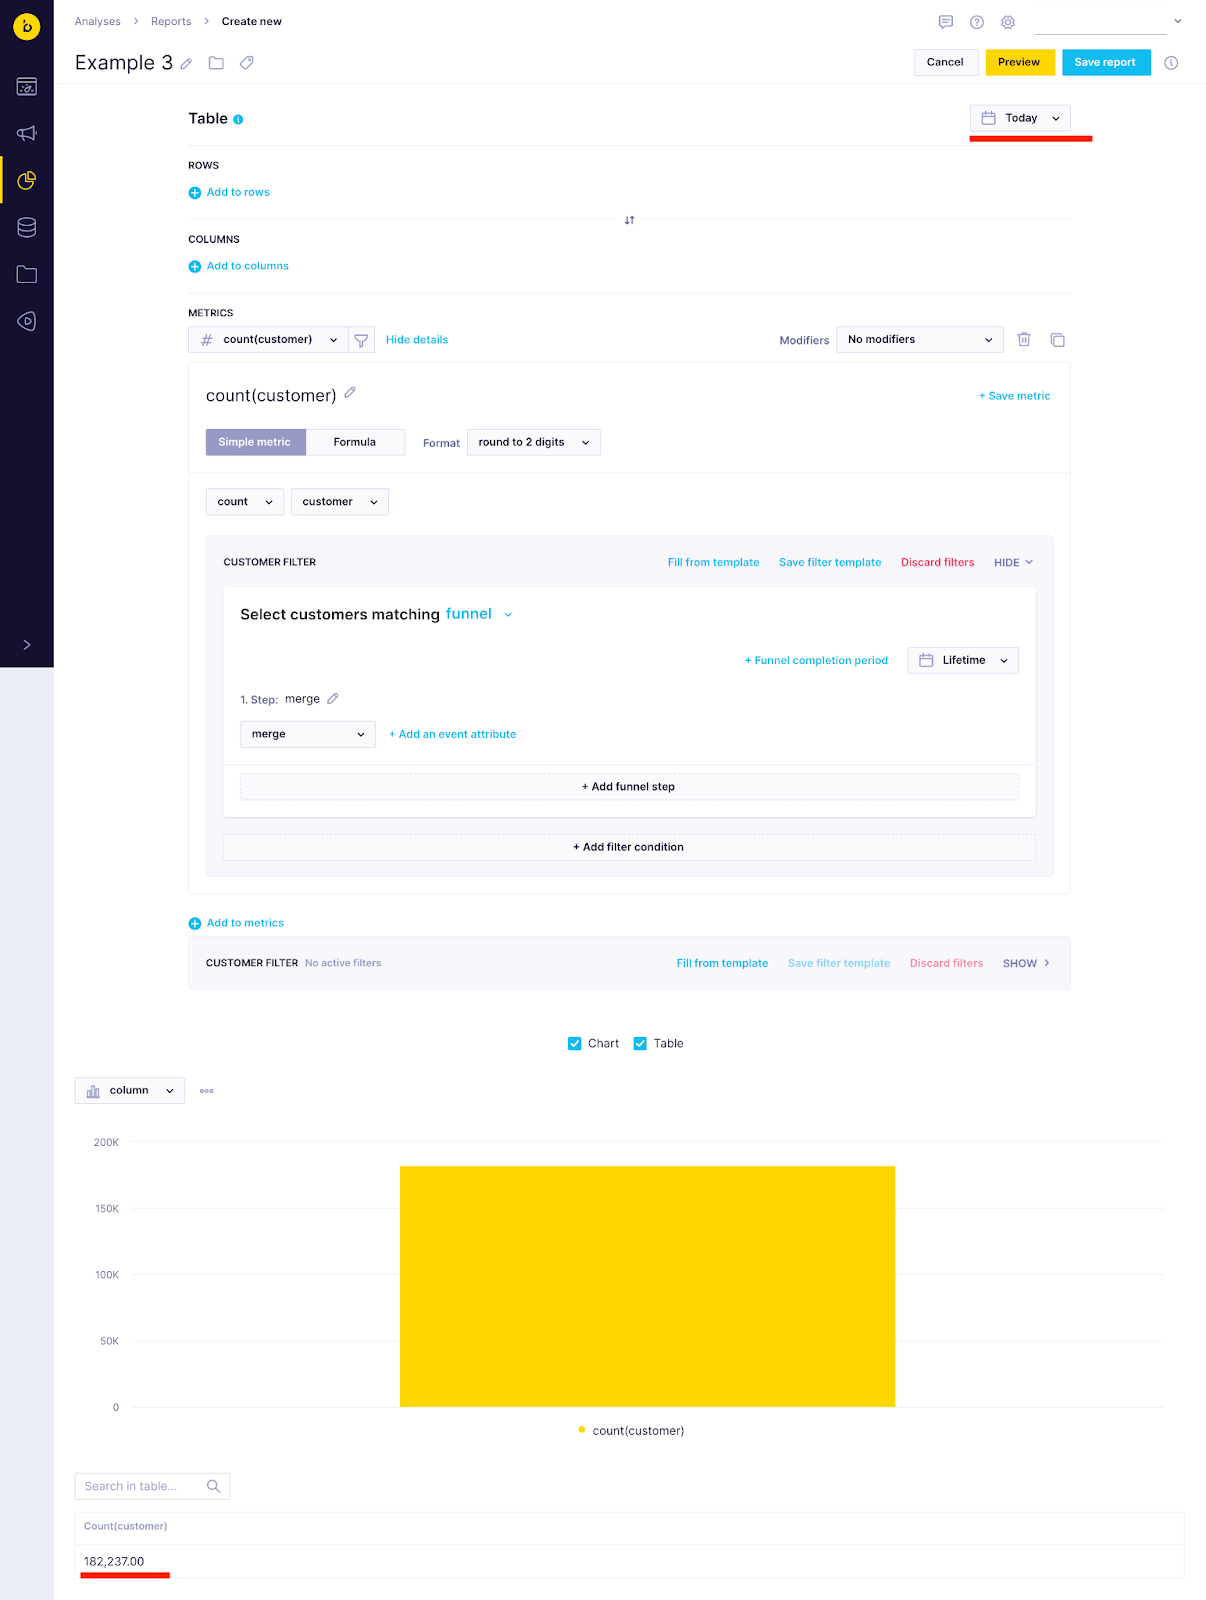
No change in the report adjusting the date filter
For the same reason, it is not possible to check when a customer profile was created with a report like this:
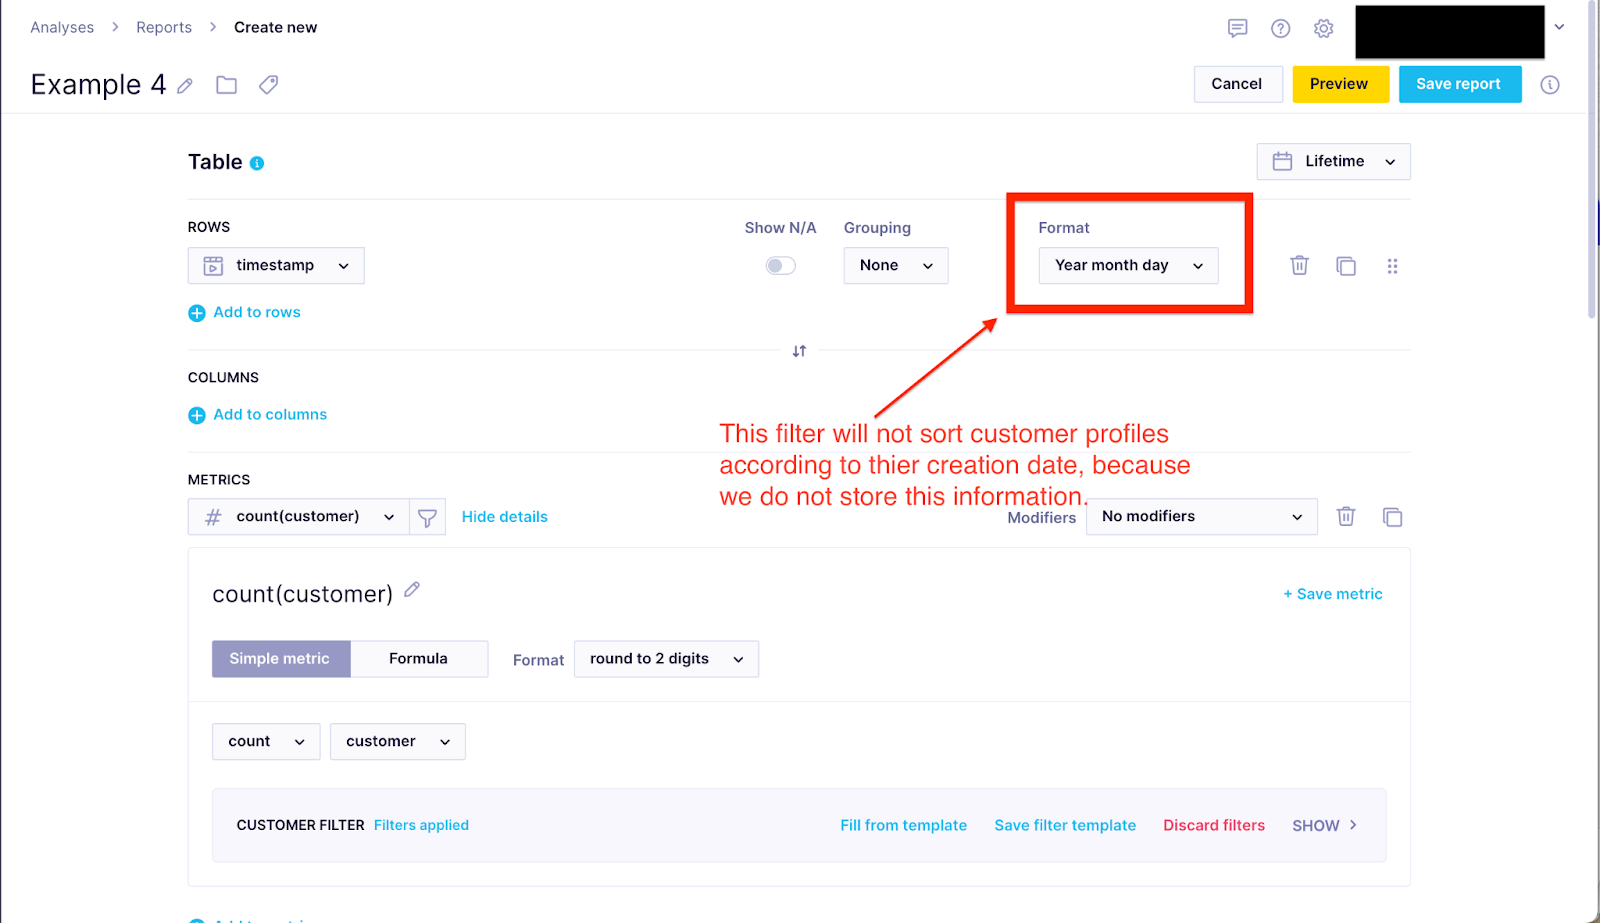
Another instance where sorting by profile creation date using customer metrics is not possible
Using a customer filter with an event metric limits events that could be used by the event metric to events from customer profiles selected by a customer filter. This way, if a customer filter is set to select customers who had a campaign event yesterday, only their events are used. The important detail is that all selected customer events are used, regardless of the timeframe set in the customer filter itself.
Consider the following reports, for example, of metrics that count how many times were viewed products with a price greater than 100 to illustrate the usage of an event metric with a customer filter.

Correct way to achieve count of events where products has a price greater than 100
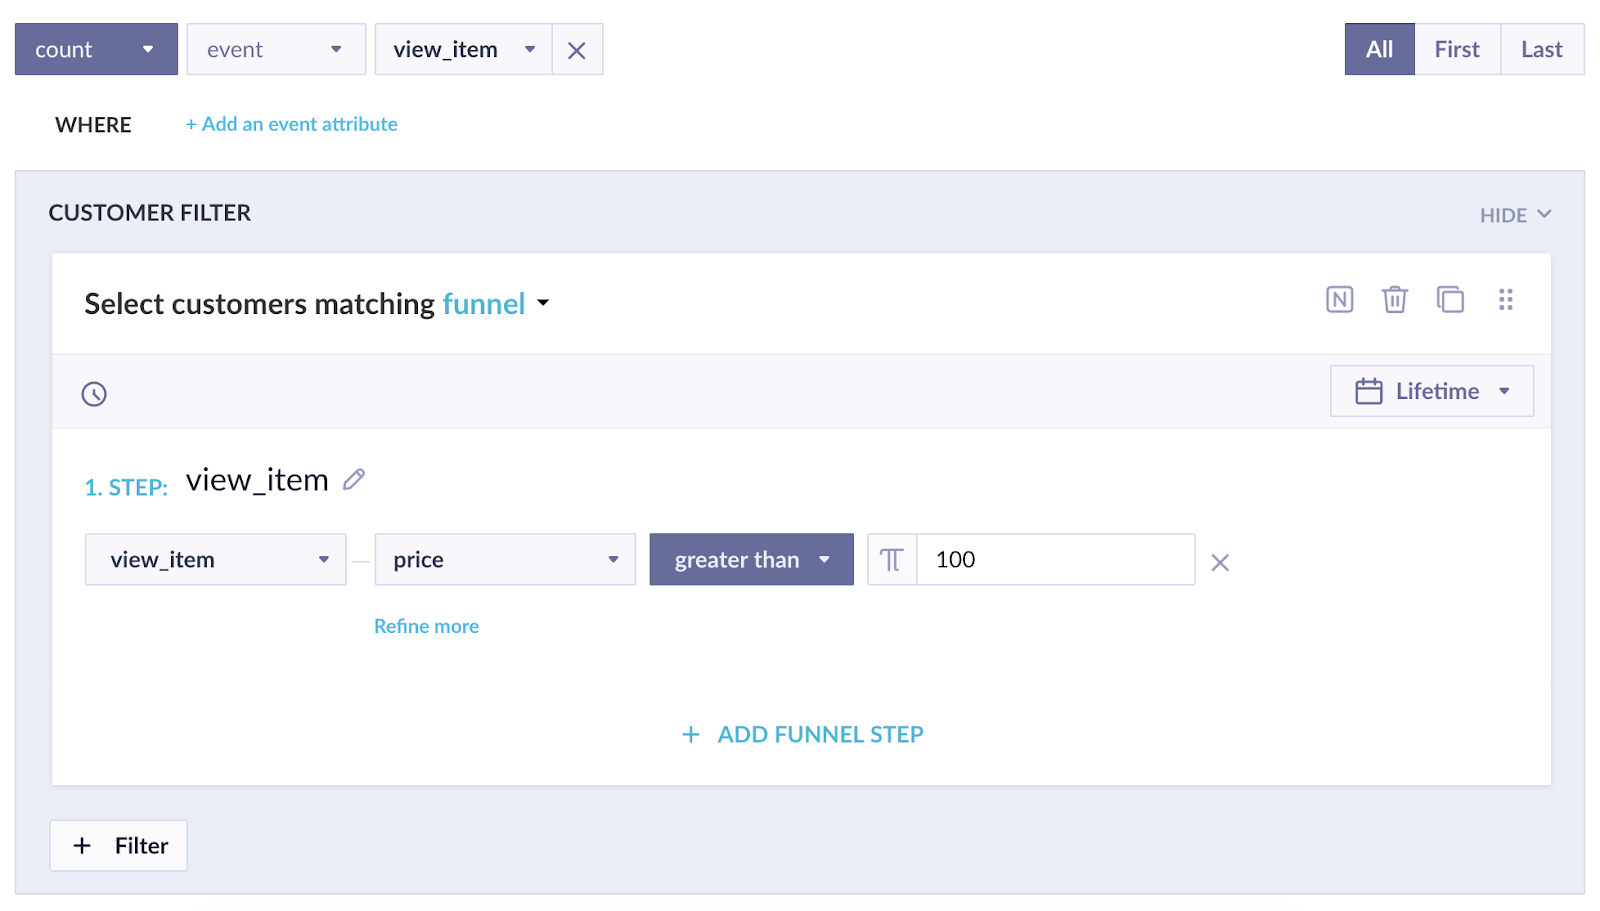
Incorrect way to achieve count of events where products has a price greater than 100
The first image depicts the correct way of achieving the desired output, while the second one is incorrect.
In the first example, you only count those product views where the price of that viewed product is greater than 100. Exactly what you want.
In the second example, however, you count all product views by customers who, at any point in their history, viewed a product with a price > 100. So if customer A viewed product 1 with a price of 200 and then product 2 with a price of 30, your filter would count 2 events. However, if customer B only viewed product 3 with a price of 40 and product 4 with a price of 50, your filter would not count any of those events as this customer never viewed a product with a price >100 and hence does not satisfy the funnel. This is obviously not the output you are seeking.
Tips
- When counting unique customers that fulfill some criteria (for example, buyers) use
count eventand select the first occurrence instead of usingcount customerand then specifying the customer filter. This may give you different results. - When creating a metric, don’t specify the date filter unless necessary. Date filter can always be specified later in a report or a dashboard, and you can easily forget that you set a date filter within the metric too, resulting in unexpected outputs.
Examples of metrics
How many people visited our web page in the last 30 days?

What is our conversion rate in the last 30 days?
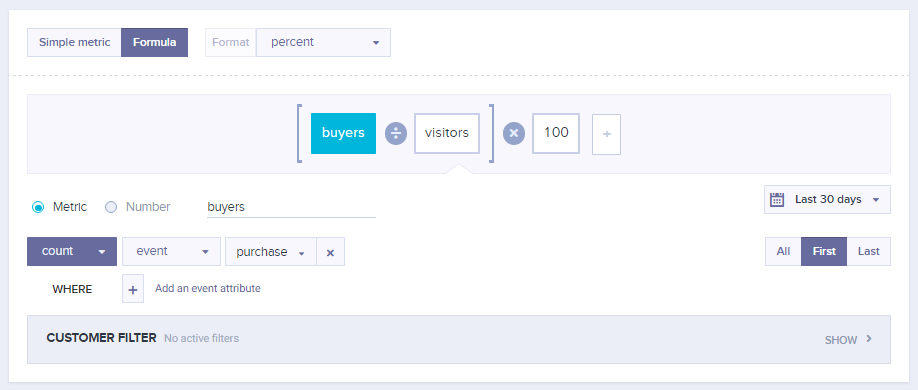
What is our bounce rate today?
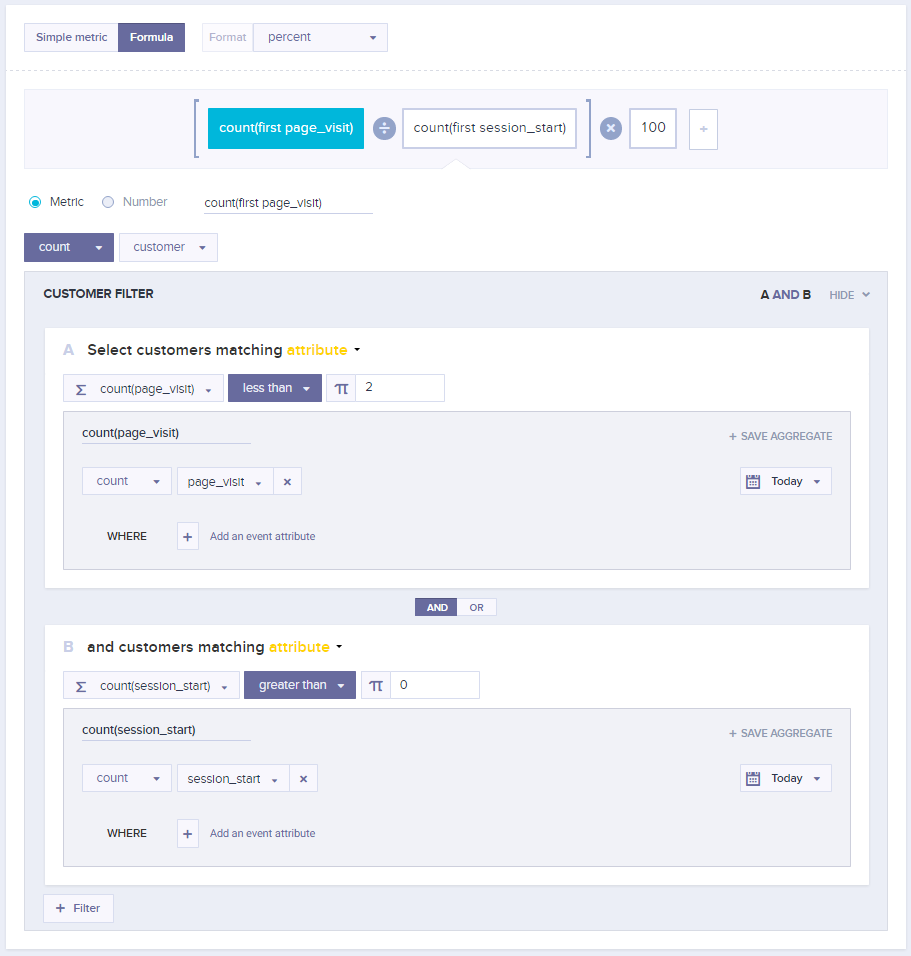
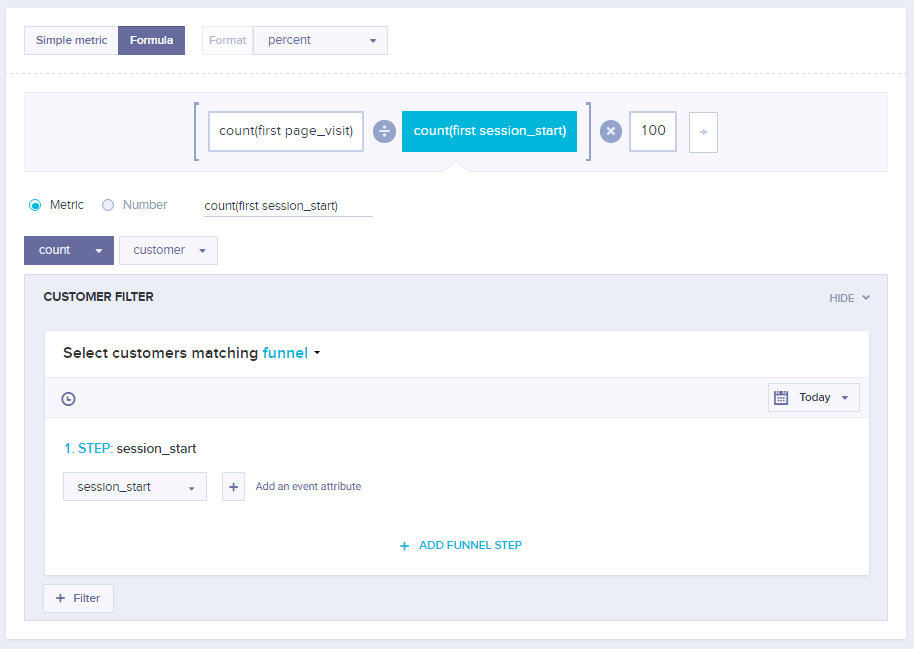
Bounce rates
Read our block about Email marketing analytics about metrics, KPIs, and reports for more information on Bounce rates.
Updated over 1 year ago
