

Segmentations
Segmentations let you divide your customers into smaller groups based on shared characteristics or behaviors. You can segment by demographics, interests, purchasing patterns, or any other factor that helps you understand how different groups behave differently.
This guide walks you through creating and configuring a segmentation. Learn how to set up segments, navigate the editor, and apply settings like date filters and profile metrics.
If you want to segment events, read the article about event segmentation. Watch this video to get an overview of the basic features of segmentations.
Why use segmentations
Segmentation gives you a sharper understanding of your customer base and helps make data-driven marketing decisions. With segmentations, you can:
- Better understand the needs and preferences of different groups, helping you tailor products and services to meet each group's specific needs.
- Identify trends and patterns across customer groups, driving data-based decisions about how to market and sell your products.
- Explore opportunities for growth and expansion, such as identifying untapped markets or developing new products and services.
Group customers by any metric: revenue generated, engagement level, activity, or funnel completion. Visualize segments, track movements between segments over time, calculate aggregated data (for example, total revenue per segment), or target customers through scenarios. You can also use saved segmentations in other analyses to compare group performance, for example, in A/B testing.
Steps to create a segmentation
1. Create a new segmentation
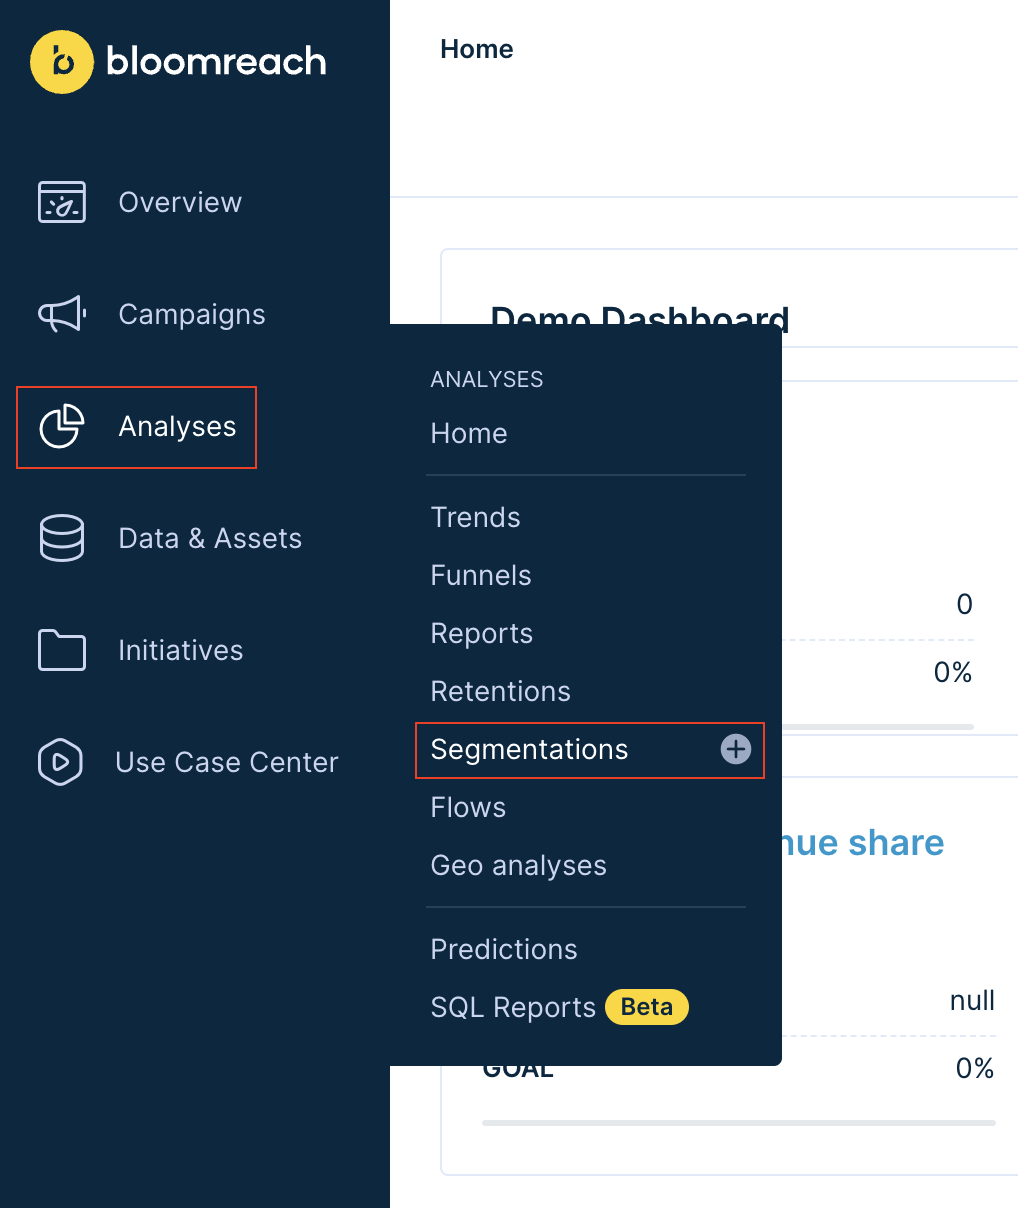
Access segmentations from the Analytics menu
- Go to Analyses > Segmentations.
- Click the + sign next to Segmentations in the dropdown menu.
- The editor opens a new, empty funnel step.
2. Navigate the segmentation editor
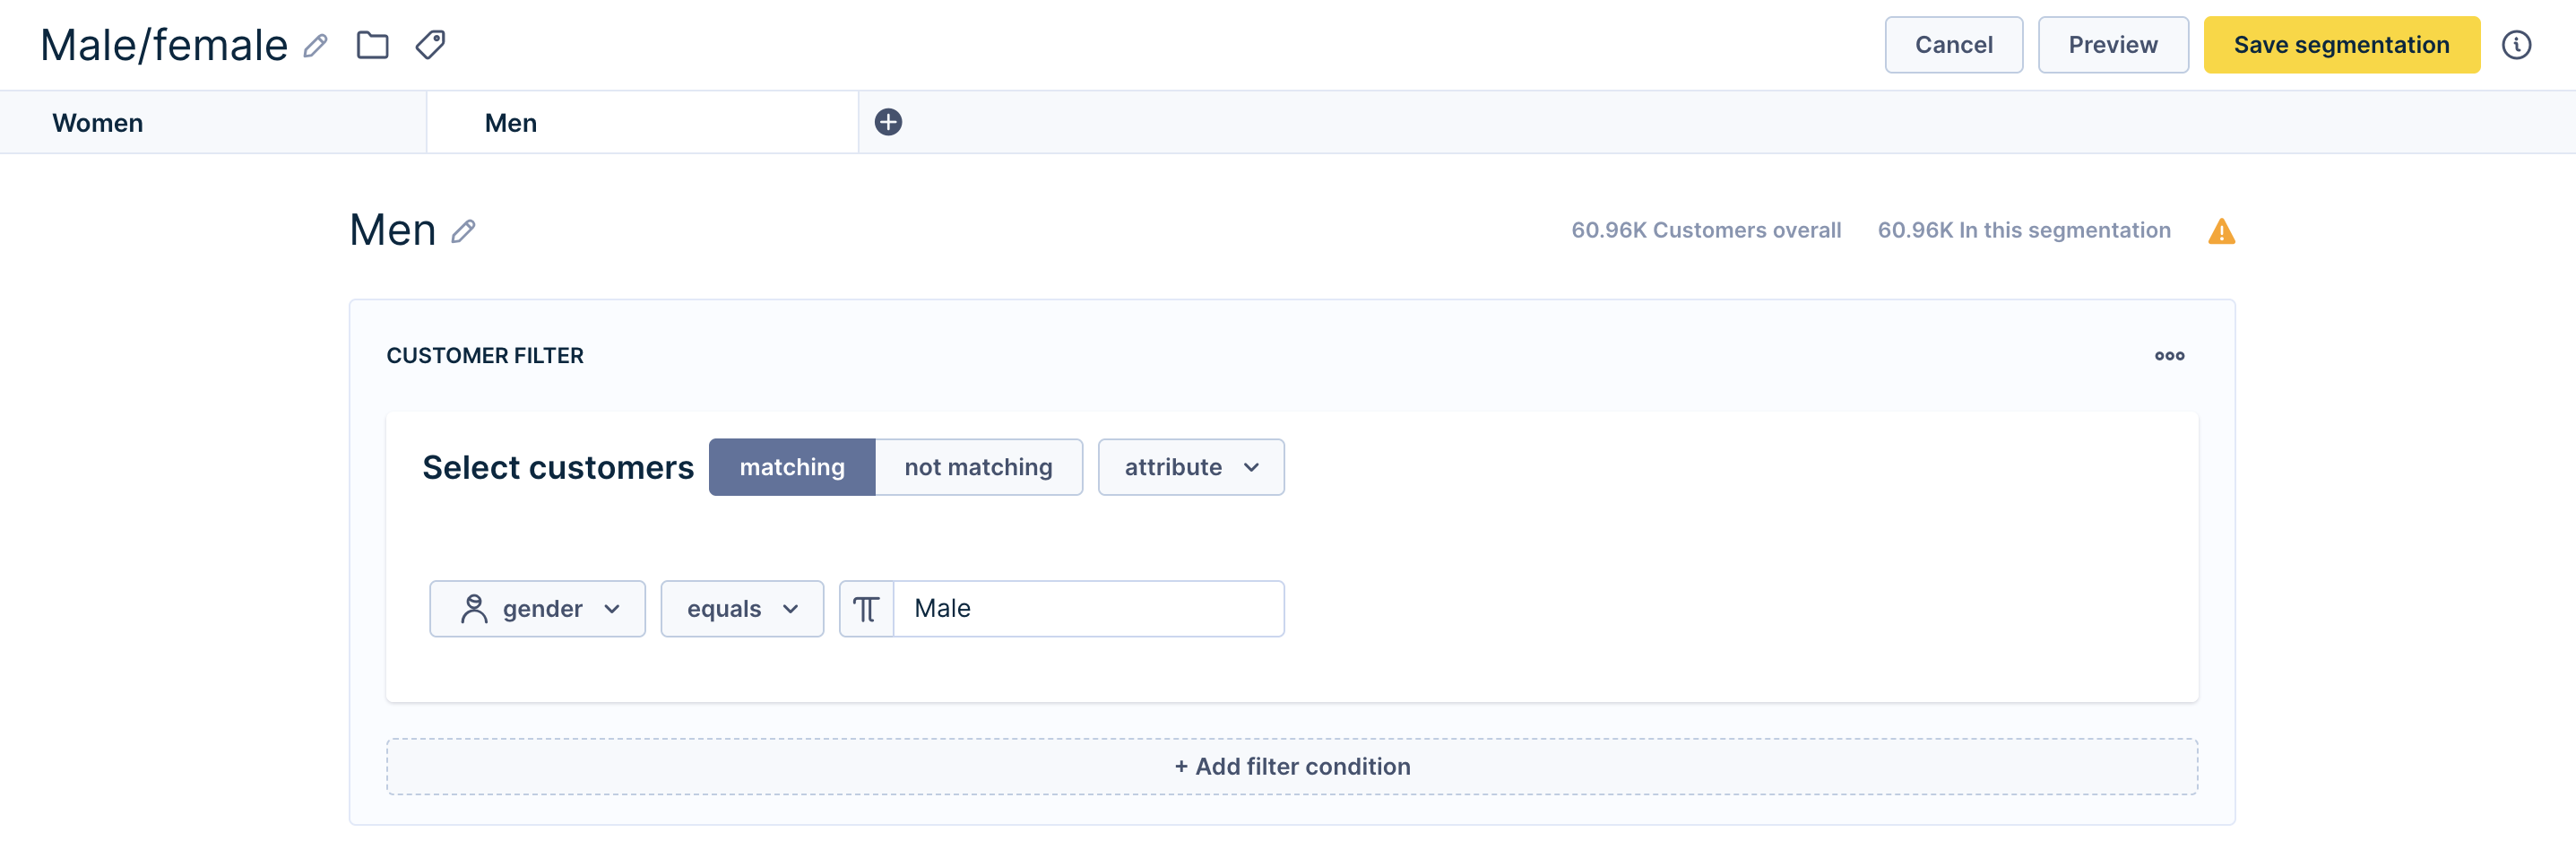
The segmentation editor has a tab-based layout, with each tab representing one segment
The segmentation editor consists of a bar with tabs at the top and their Customer Filter contents below.
- Click the blue + sign next to the tabs to create a new segment.
- Click a tab to edit an existing segment.
- Hover over a tab to reveal the copy and × icons.
- Click the copy icon to duplicate the segment.
- Click the × icon to delete the segment.
- Define each segment using customer filters.
3. How to use segmentations in Bloomreach
Order of segment tabs matters
Each customer can only belong to one segment within a segmentation. If a customer meets the conditions of more than one segment, they're placed in the first applicable segment, reading from left to right.
For example, if you have three age-based segments — "less than 15," "less than 30," and "less than 45" — a customer aged 14 is placed only in "less than 15," even though they technically satisfy all three conditions. If you moved "less than 30" to the first position, that customer would fall into that segment instead.
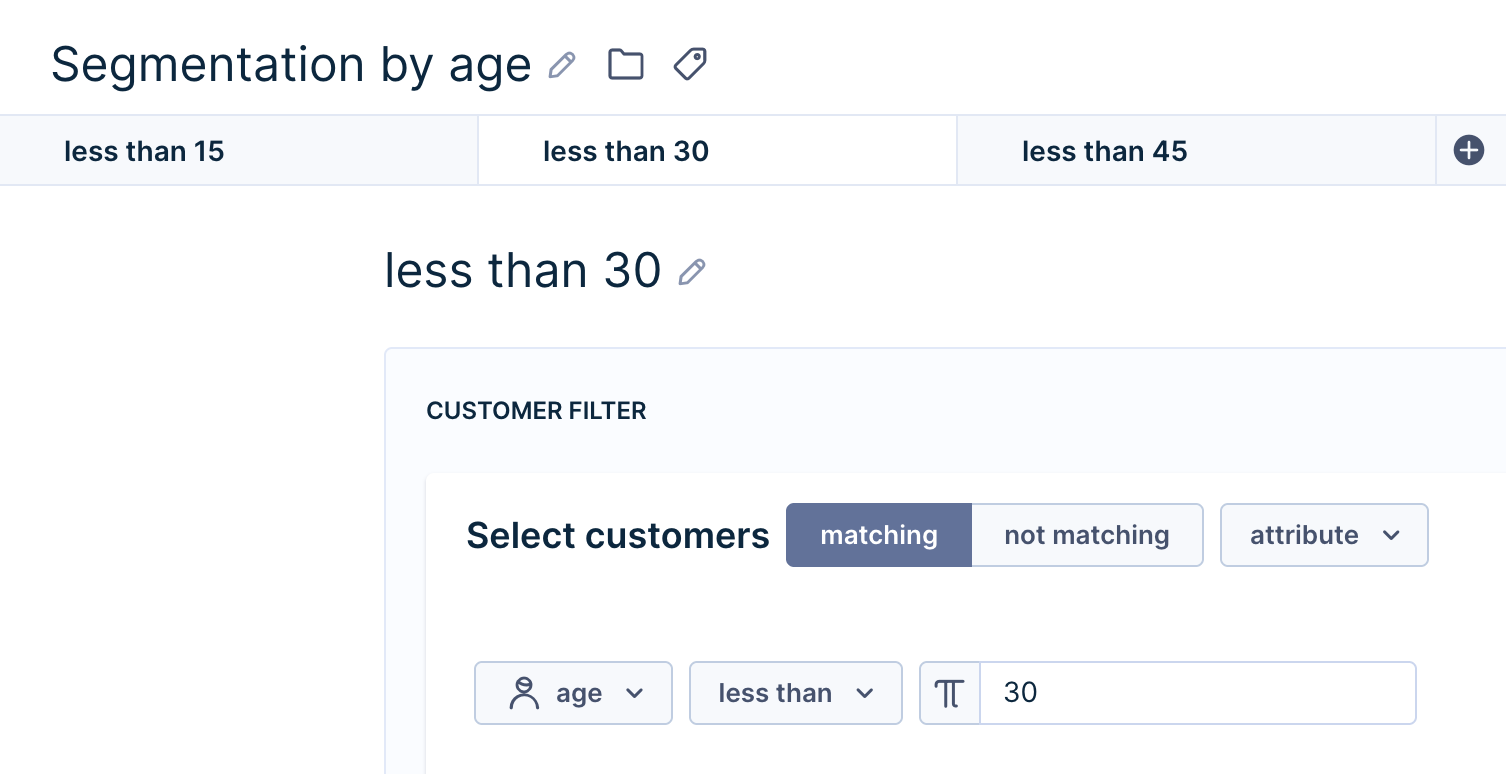
Segment tab order determines which segment a customer is assigned to when they meet multiple conditions
Segmentations become customer attributes
When you save a segmentation, it creates a new customer attribute. For example, a segmentation named "Segmentation by age" with three segments — "less than 15," "less than 30," and "less than 45" — creates an attribute with those three possible values. Customers who don't belong to any segment receive "no value".
The attribute appears in customer profiles and is available when working with analyses, filters, and campaigns.
Other settings
Date filters
Date filters allow you to specify the start and end dates for which the segment is created. Customers change segments over time, and this feature allows you to observe their movement. You can observe the changes in the segmentation movements panel. To learn more about Date, Customer, and Event filters, read the Filtering data article.
Profile metrics
By default, the segmentation schema shows the number of customers for each segment in the table below the chart. Adding profile metrics allows you to view other metrics in this table, such as the Average Purchase Item Price or Average Order Value.
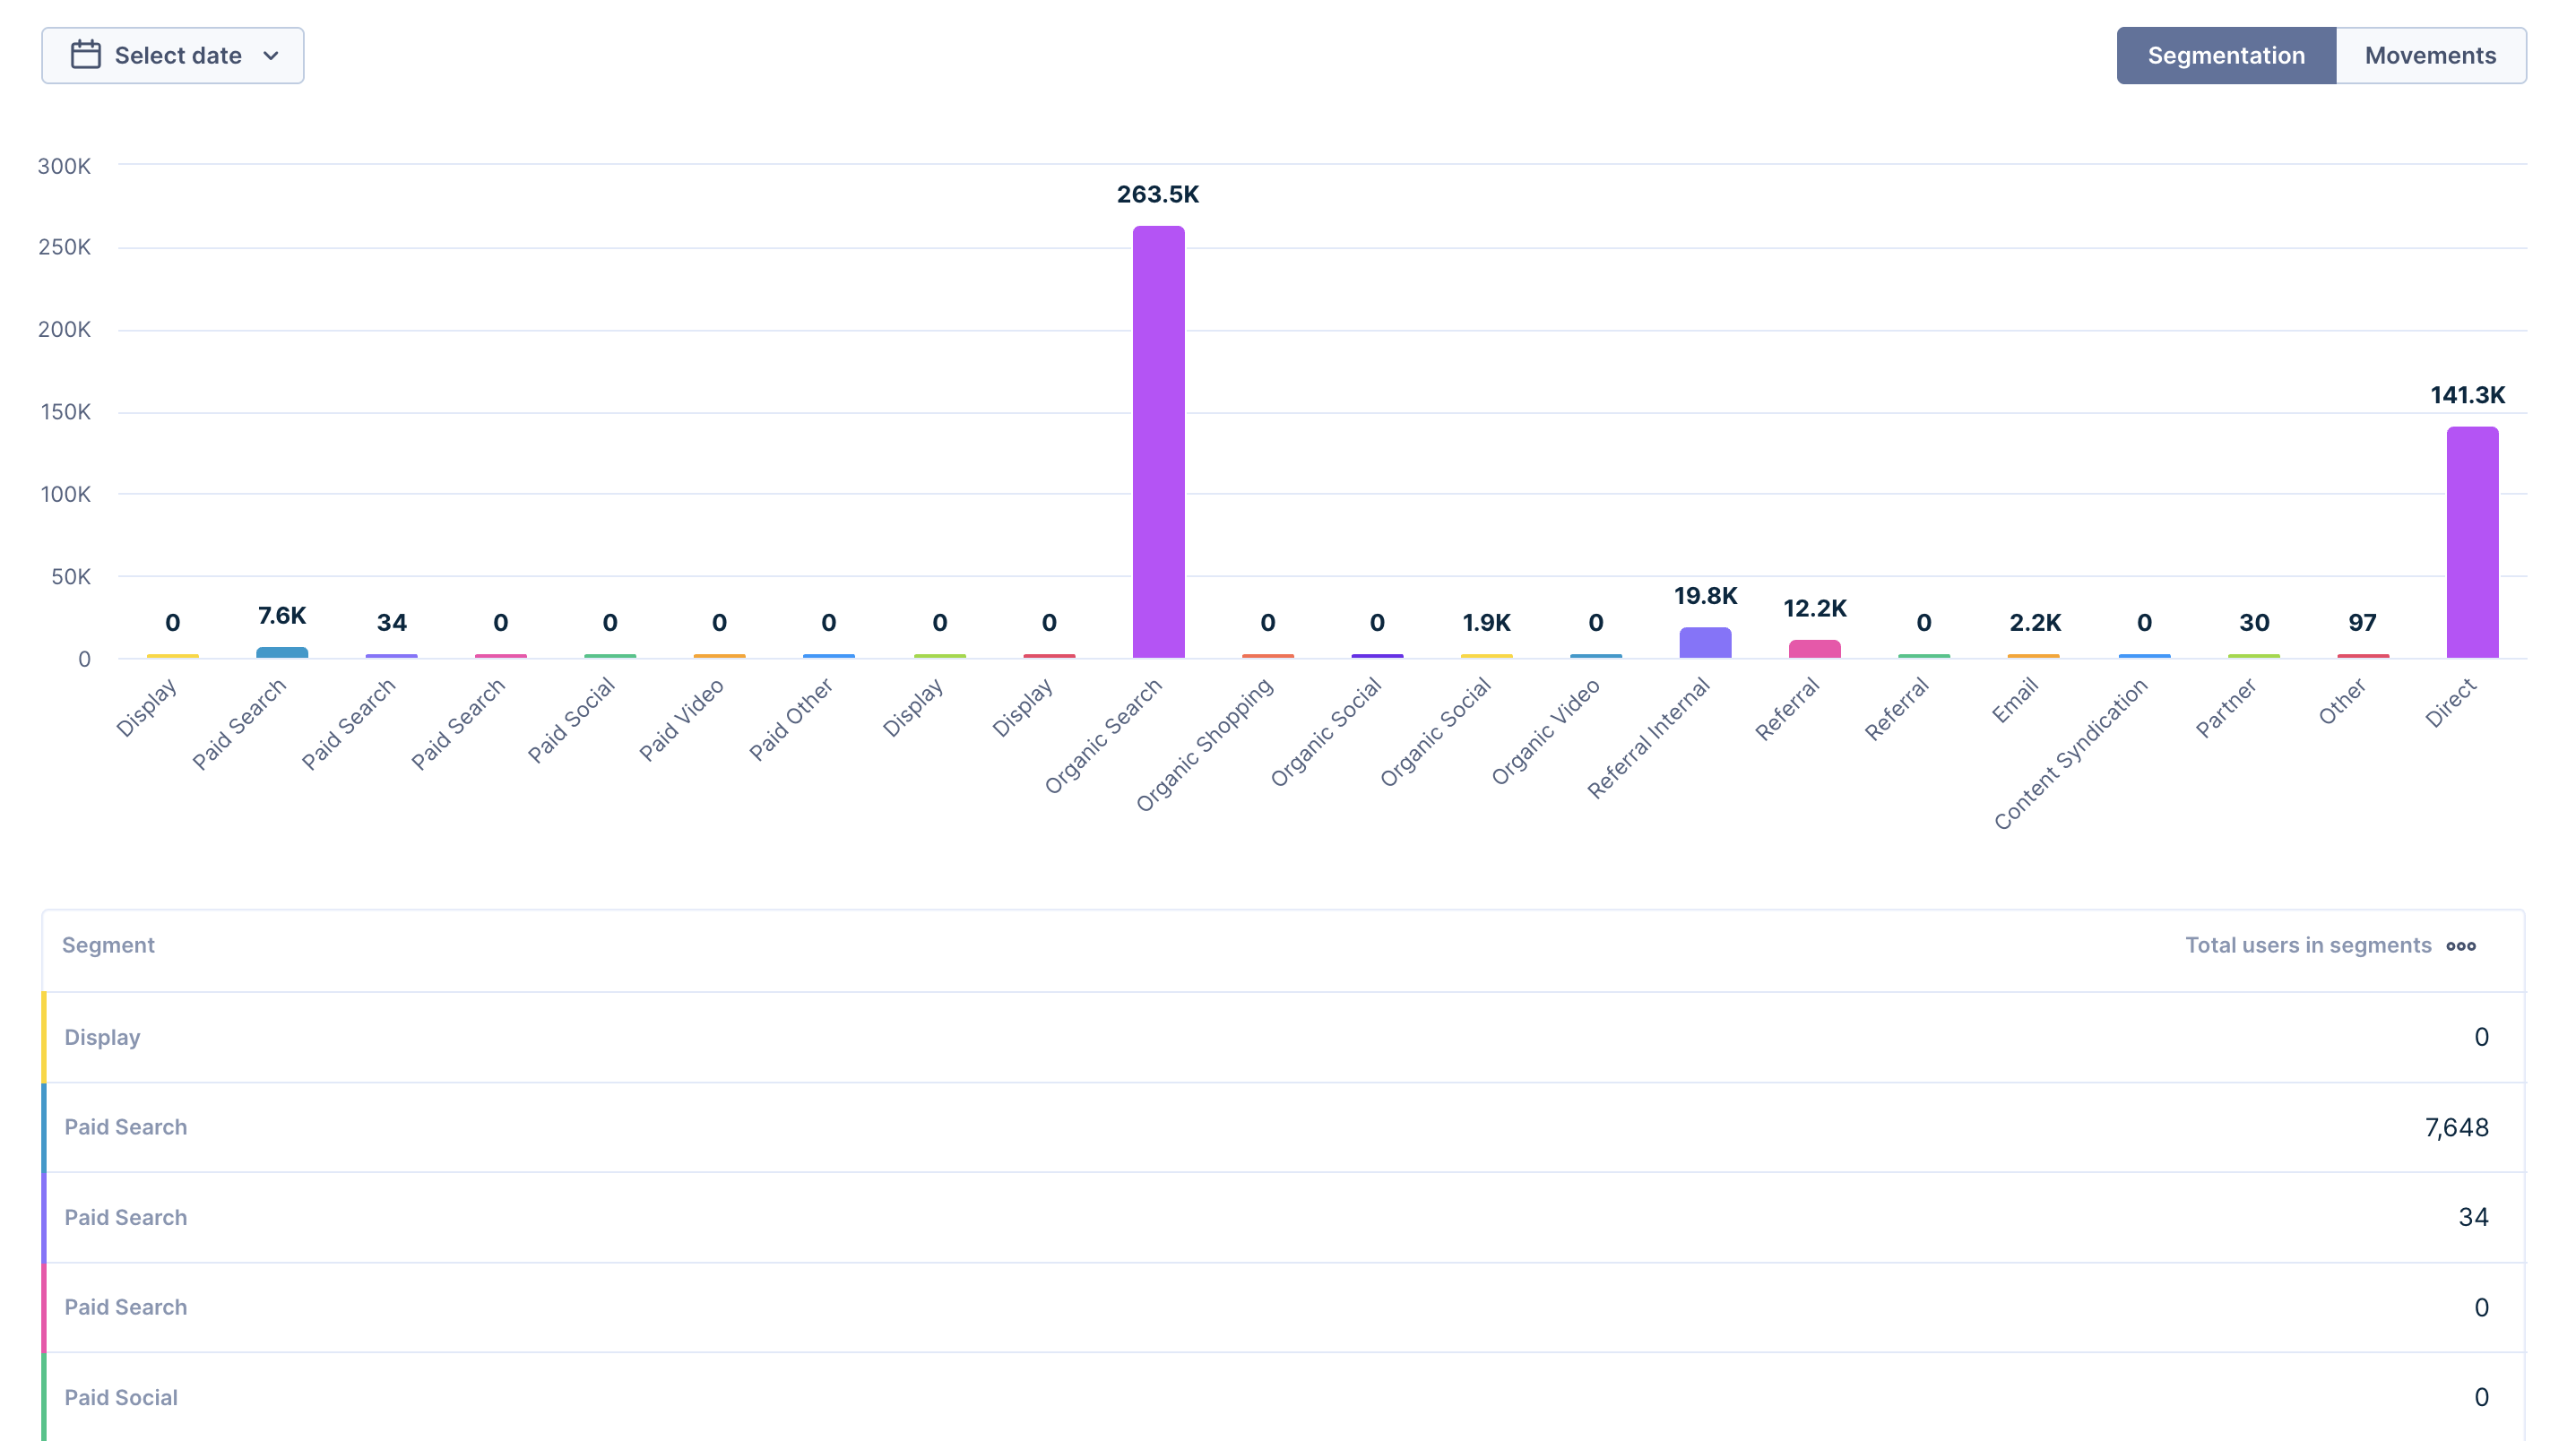
Profile metrics add extra data columns to the segmentation table below the chart
Click on a segment in segmentation map or segment distribution charts to perform actions such as:
- Show customers in the segment
- Send a campaign to a given segment
- Use for prediction (experimental)
2D and 3D visualizations of segmentation schema
Click on a metric and assign it to either the X or Y axis to create a 2D visualization of the segmentation schema. Another name for this visualization is segmentation map. Assign the volume of a metric to the Z axis to control the sizes of the bubbles.
Movements
The attributes of customer events, particularly aggregates, can change over time and cause customers to move from one segment to another. The From -> To table feature displays these movements.
Your segments' start and end dates are the baseline period. Bloomreach calculates the number of customers in the previous period for these segments and predicts the trend for the next period. Every time you edit the movement, for example, by changing the start and end date, the segmentation recalculates using the current definition.
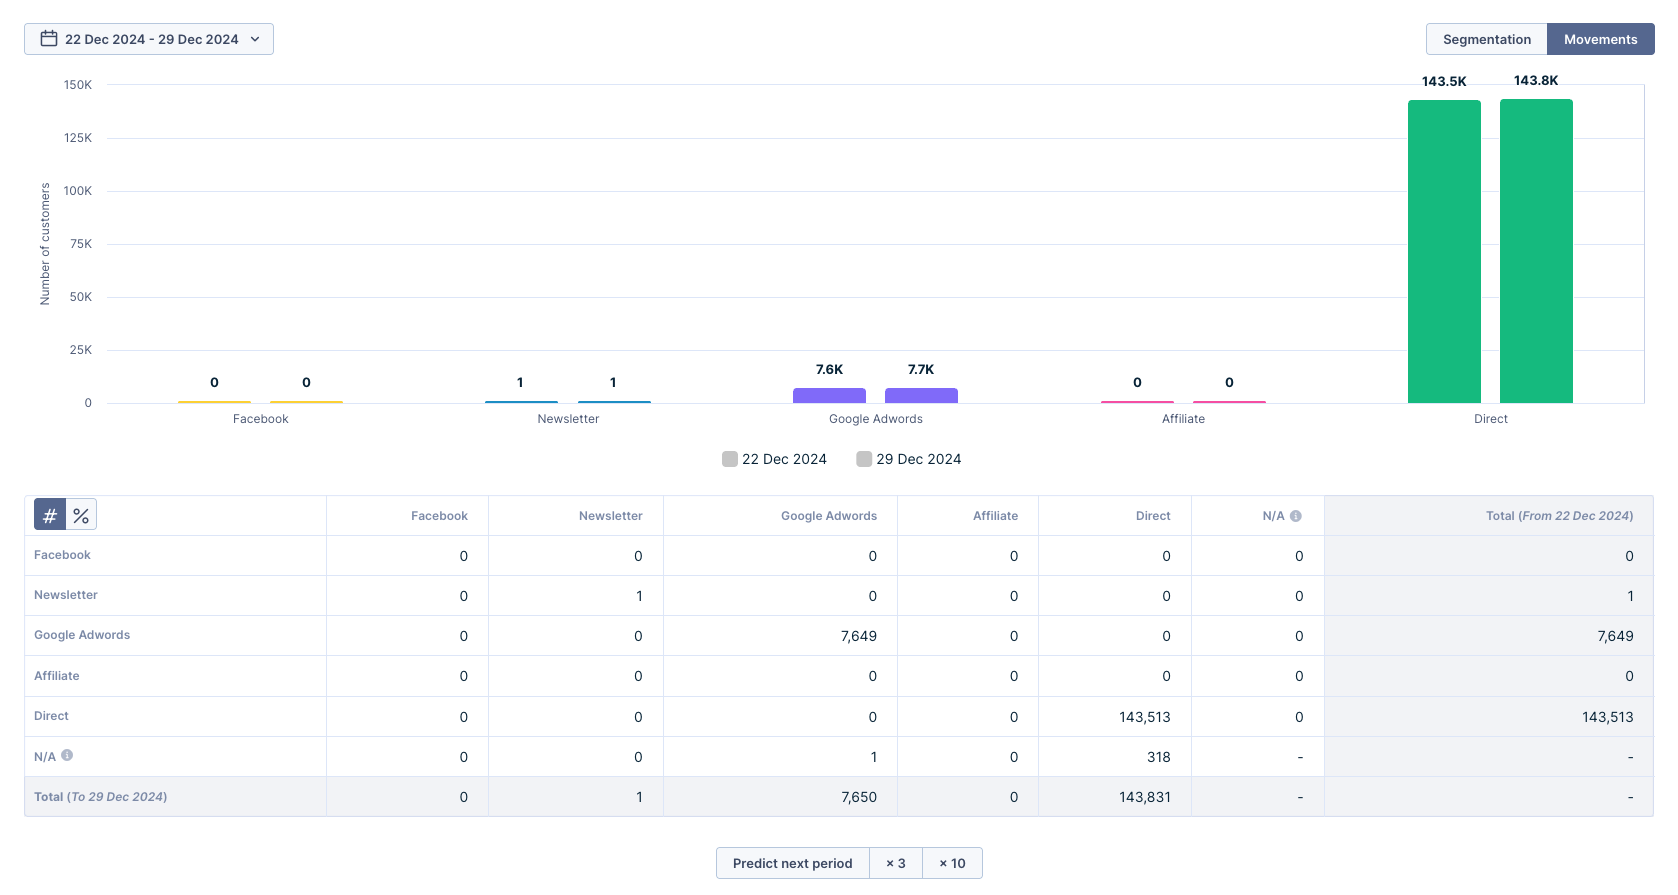
The movements table shows how customers move between segments over time
ImportantMovements require event-based conditions. Therefore, the movement feature for segmentation with customer properties does not work.
Use case examples
There are many specific use cases that can benefit from the use of segmentations in e-commerce analytics. Some examples include:
- Identify the most valuable customer segments based on their purchase history, which allows you to focus your marketing efforts on retaining and acquiring more customers from key segments. Visit the technique of segmenting customers based on the recency, frequency, and monetary value of their purchase in the RFM Segmentation use case.
- Develop targeted marketing campaigns by using segment data to understand customer interests and preferences, so your messaging resonates with each group.
- Time your marketing efforts efficiently by identifying usual purchasing patterns. Understand how to deploy the use case in Time Between Purchases article.
- Optimize product offerings by identifying gaps and developing new products to meet the needs of specific segments.
Updated 12 days ago