

Email click heatmap
This guide introduces you to the Email click heatmap.
The only way you can effectively improve your email marketing is to understand how your customers interact with your emails. The Email click heatmap provides a fast and visual way to understand where your customers click in your emails.
Acess click map
You can use the click map in both email campaigns and scenarios. Go to either:
- Campaigns > Email campaigns > New evaluate > Click map
- Campaigns > Scenarios > Evaluate > Click map
The click map shows the percentage of customers who clicked each link in the email.
NoteClick map is calculated per node. In case of multiple email nodes in a scenario you will see a dropdown menu next to
Previewfor where you can choose the desired email node.
Understand click map metrics
You can choose the metric on which the preview of the click map will be based. You have three choices:
- Click rate: counts the number of
unique_clicksdivided by the number ofunique_deliveries. - Unique clicks: counts only the first
clickedevent of a customer. - Total clicks: counts all the
clickedevents of a customer.
WarningThere are some differences in how bot traffic is considered for 'Total clicks' and 'Unique clicks', so when the option Show reliable clicks is used, there can be a discrepancy between the numbers.
To ensure proper click map functionality, be aware that the following applications can affect the final evaluation of already sent emails :
- Changing the structure of your email after the initial run of the scenario (even a test run).
- Changing the structure of your email using Jinja personalization (can change from one customer to another).
- Using the wrong tags order or position in the email structure (can be checked in the HTML editor for errors if something is wrong with the structure).
Since the evaluation runs on the most recent template, the new ones are evaluated correctly. Changes like adding new elements or re-arranging the existing ones will cause incorrect evaluation due to the changed xpath. Modifying the existing text can be done without affecting the evaluation, then.
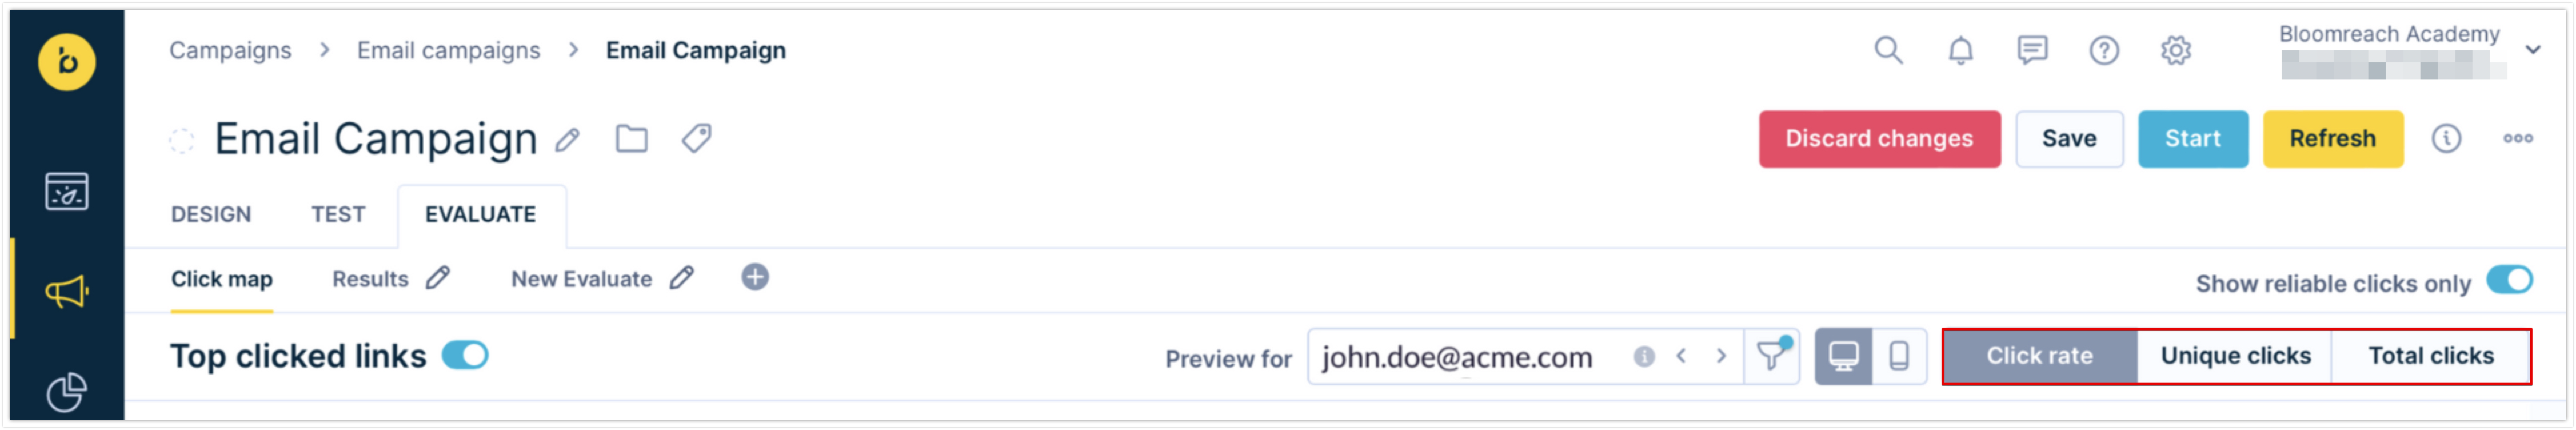
Click map metric selector showing click rate, unique clicks, and total clicks options
ImportantClicks from links that are within VML (like <!--[if mso]> blocks) doesn't show in the heatmap because the xpath cannot be determined. This impacts just MS outlook.
Click map with personalized emails
When you send out personalized emails, different customers see different products with different links in the email. This, however, isn't a problem for the heatmap results, as it doesn't track how many times a specific URL is clicked, but instead how many times a specific place within an email structure is clicked, regardless of which product is shown there.
The heatmap for emails with the same structure, therefore, works in the same way even if personalized. If you want to see what version of the email was shown to a specific customer, insert their cookie or email into the Preview for bar. By using the filter, you can also see the version of the email that was shown to a specific group of customers.
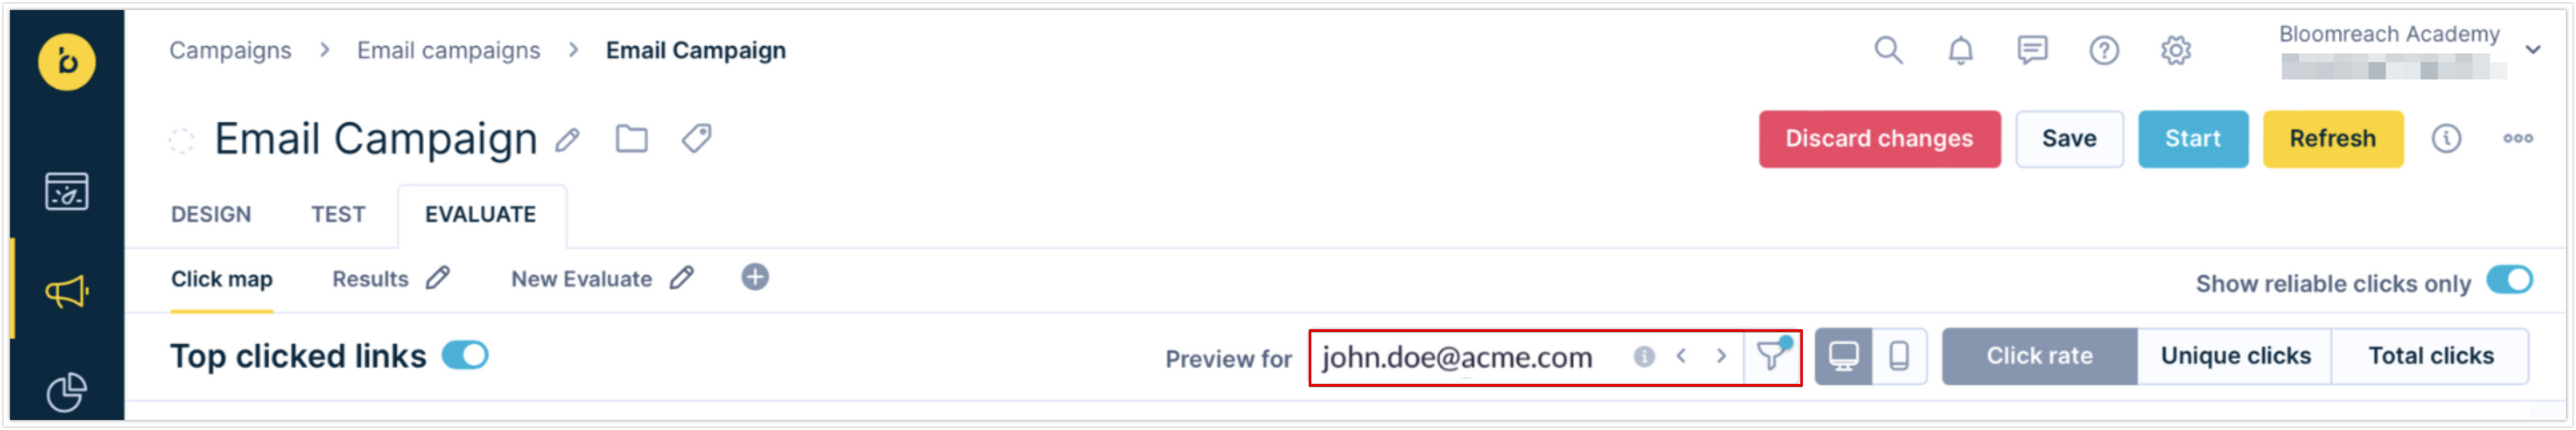
Preview for filtering the click map by individual customer
Choose to see the mobile/desktop version of the same email. Remember that clicks are counted jointly across both device types, and that choosing from these two previews will not affect the numbers in any way.
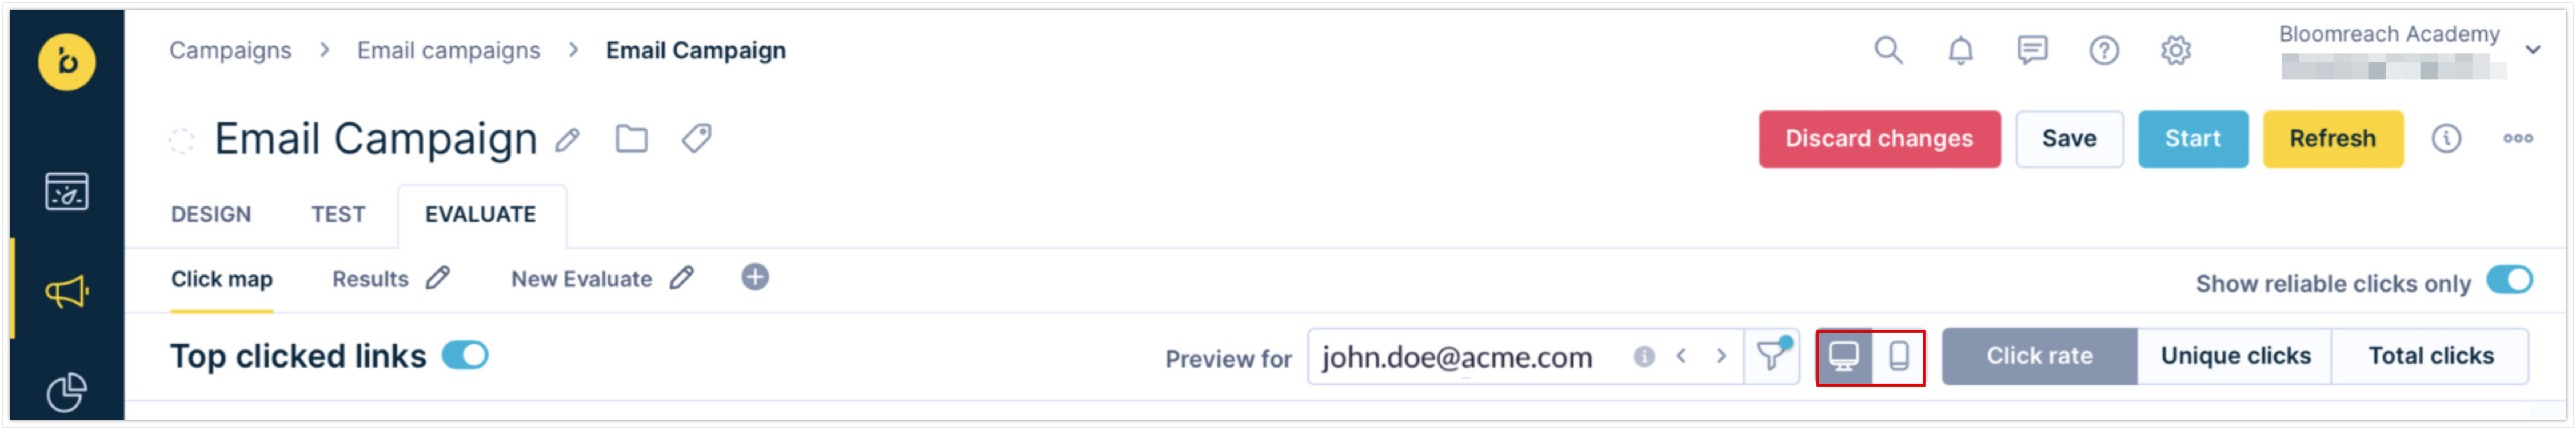
Mobile and desktop preview toggle in the email click heatmap
Updated about 9 hours ago