

Event usage dashboard
About this dashboardThis dashboard is for customers on event-based pricing. Usage is calculated based on events processed and reflects the metrics used for billing on older plans.
If your account is on profile-based pricing, refer to the Profile usage dashboard instead.
How it works
The dashboard shows a historical snapshot of your data, sourced from Bloomreach's internal BigQuery table. It isn't connected to your Loomi BigQuery and isn't recalculated—so if you've set up event expiration, the dashboard still includes data from those expired events.
The dashboard updates every 48 hours and isn't real-time. maximum event storage (MES) tracks the highest storage recorded at any point during a given month. If you delete or expire a large portion of events mid-month, the decrease won't show up until the new calendar month starts.
Access the dashboard
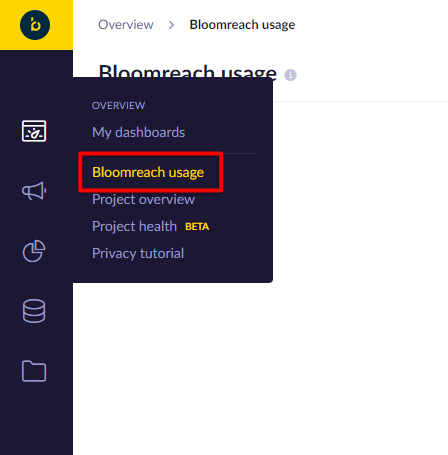
Go to Overview > Bloomreach usage.
Use the switcher in the top right to move between project, account, and instance views. At the account level, the dashboard compares your data to the subscription plans set in your account settings.
The view you can access depends on your role:
| View | Required role |
|---|---|
| Project-level | Project Admin |
| Account-level | Account Admin |
| Instance-level | Instance Manager |
Dashboard tabs
The usage dashboard shows the current usage and usage history in 5 different categories.
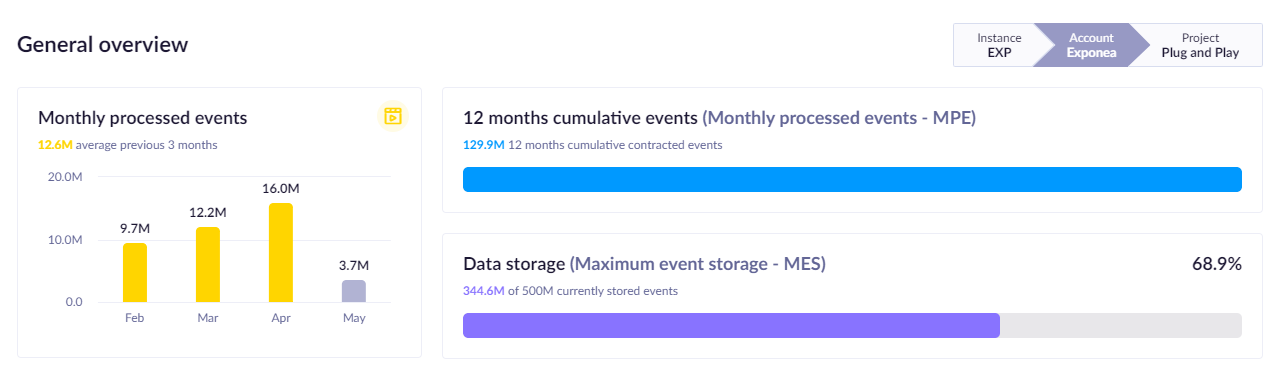
General overview
| Metric | Details |
|---|---|
| Monthly processed events | Current month plus the previous 3 months |
| Cumulative events | Configurable time period; defaults to last 12 months |
| Data storage | Current IMF usage |
Omniconnect monthly requests
The General overview tab includes an Omniconnect monthly requests view showing inbound request volume for the last 3 completed months plus the current month, plotted against your workspace's monthly allowance. See Omniconnect limits for the thresholds that apply to your plan.
Communication
The Communication tab consists of:
- Emails enqueued on average per month.
- SMS sent on average per month.
- Notifications sent on average per month.
- WhatsApp messages sent on average per month.
- Webhooks sent on average per month.
- Ad audiences events processed on average per month.
NoteCommunication data is based on
campaign_actionsprocessed within each month and reflects real actions in Bloomreach. It doesn't account for campaign event mapping in Project settings. Deleting or expiring events won't change what appears here—data from those events still shows in this tab.
Personalization
The Personalization tab consists of:
- Weblayers shown on average per month.
- In-app messages shown on average per month.
- Experiments shown on average per month.
- Recommendations served on average per month (including requests for a recommendation without tracking the serve event, for example, email previews).
Data breakdown
The Data breakdown tab consists of:
- Monthly processed events: Breakdown by event type.
- Outgoing communication: Breakdown by action type and status.
- Data storage: MES for the last 12 months.
Both breakdowns include an option to see up to 12 months' history and download the data into CSV.
Other allowances
The Other allowances tab contains:
- GiB of data processed on average per month
- Catalog rows processed on average per month
- Rows exported on average per month
- Active prediction models on average per month
- Tracked events
- Imported events
Updated 5 days ago