

Analyze time between purchases
The time between purchases report shows how often your customers make purchases. Use it to identify the best moment to target customers with personalized campaigns and improve your retention rate.
Prerequisites
To create this report, you'll need to be familiar with:
Why analyze time between purchases
Knowing when customers are most likely to make another purchase helps you target them with campaigns or special offers at the right time. For example, if your customers typically make their 3rd purchase between 1 and 4 months after their 2nd, you can target customers who've made 2 purchases within that time frame.
The ideal time between purchases varies across industries. A business selling seasonal equipment like skis has a different purchase cycle than an online drugstore. Compare your results to similar businesses to determine whether your retention rate meets industry standards.
Read the report data
Use the report to identify patterns in your customers' purchasing behavior.
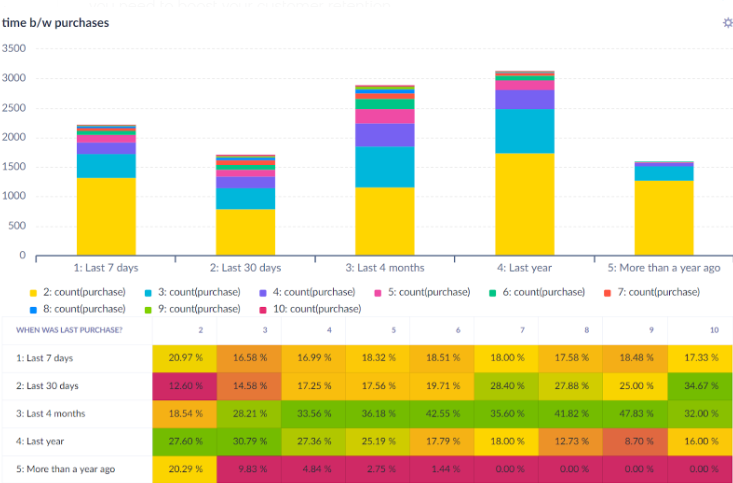
Time between purchases report showing purchase patterns across customer segments.
A typical time between purchases report shows the following:
- Most returning customers purchase between 30 days and 4 months after their previous purchase.
- Avoid sending communications to one-time buyers in the 2nd, 3rd, and 4th week after their purchase.
- If you don't reactivate active customers within a year of their purchase, you risk losing them.
Create a time between purchases report
Create the expression
Create an expression for the time between a customer's purchase and their previous purchase:
- Go to Data & Assets > Data manager > Definitions > New definition > Expression.
- Select Expression for event and select
purchase. - Create a running aggregate
last(purchase.timestamp)and subtract it fromtimestamp. - Divide the result by
86400to convert the output to a day count. - Name the expression and save it.
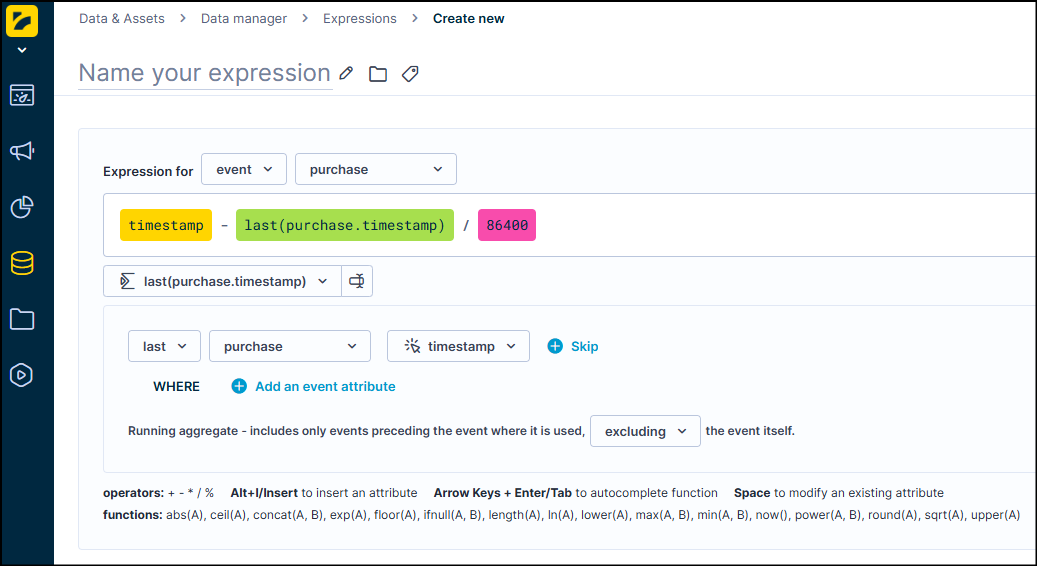
Set up the expression to calculate the time between purchases in days.
Create the event segmentation
Create an event segmentation using the expression you created:
-
Start from the smallest time difference and increase incrementally.
-
Set time limits based on your preferences. Use the following segments as a starting point:
- Last 7 days (first segment)
- More than a year ago (last segment)
Create the final report
- Create a new report and use the event segmentation you created in the rows.
- For the columns, create a running aggregate showing the number of purchases.
- Use a simple count of purchases in the metrics.
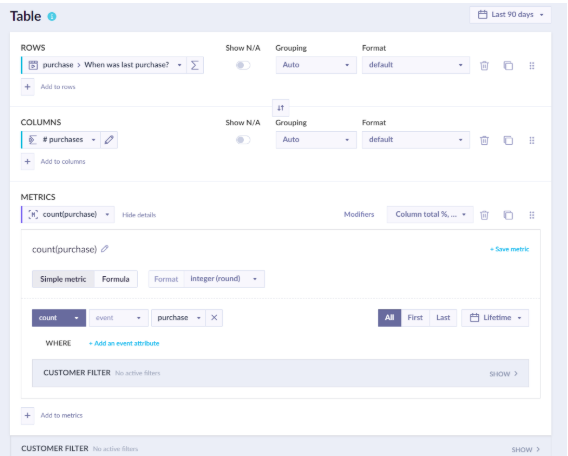
The final report with event segmentation in rows and purchase count in columns.
Set the correct value format for the count(purchase) metric.
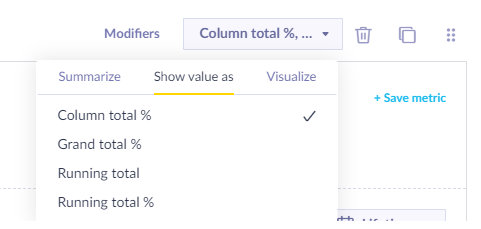
Select Column total % in the Show value as dropdown to set the correct value format.
NoteIf your purchase event has a different name than
purchase, adjust the event name in the report, event segmentation, and expression.
Calculate time between first and second purchase
The approach above calculates the gap between any purchase and the one before it. Use this variant when you want to measure how long it took a customer to come back for their 2nd purchase, specifically to identify your average conversion lag or to time re-engagement campaigns around that window.
This approach uses customer-level aggregates to pin the timestamps of the 1st and 2nd purchases, then subtracts them.
Create the customer aggregates
Create 2 customer-level aggregates — 1 for the first purchase date and 1 for the second. Filter both to completed purchases only to avoid counting canceled or pending orders.
First completed purchase date
-
Go to Data & Assets > Data manager > Definitions > New definition > Aggregate.
-
Select Aggregate for event and select
purchase. -
Add an event filter for completed purchases — for example,
purchase_status = success(use your project's equivalent). -
Set Aggregation to
first(ormin) onpurchase.timestamp. -
Set the period to Lifetime.
-
Name it — for example,
First completed purchase timestamp— and save it.
Second completed purchase date
-
Repeat the steps above with the same event and filter.
-
Set Aggregation to
first(ormin) onpurchase.timestamp. -
Set Skip first to
1. This skips the 1st purchase and returns the timestamp of the 2nd completed purchase for each customer. -
Set the period to Lifetime.
-
Name it — for example,
Second completed purchase timestamp— and save it.
Customers with only one completed purchase won't have a value for the second aggregate—there's no 2nd purchase to return. For more on how Skip first works, see Aggregates and running aggregates.
Create the expression
Create a customer-level expression that subtracts the first purchase timestamp from the second and converts the result to days:
-
Go to Data & Assets > Data manager > Definitions > New definition > Expression.
-
Select Expression for customer.
-
Subtract
First completed purchase timestampfromSecond completed purchase timestamp. -
Divide the result by
86400to convert to days. -
Name the expression — for example,
Days between first and second purchase— and save it.
Use the result
Once the expression is in place, you can:
-
Segment customers by how many days it took them to make a 2nd purchase. For example, customers who returned within 30 days vs those who took 60–90 days.
-
Trigger re-engagement campaigns timed to your average first-to-second purchase gap, targeting customers approaching that threshold who haven't returned yet.
-
Report on conversion lag across different customer cohorts, product categories, or acquisition channels.
This expression only returns a value for customers who've made at least 2 completed purchases. Customers with fewer than 2 return a null value and are excluded from segmentations using this expression.
Best practices
Break down data by attributes other than the number of previous purchases. Consider segmenting by gender, age, order value, shipping city, or total customer value to generate more granular insights.
Updated 3 months ago