Exponea Console
Exponea Console is a free Google Chrome extension that shows debugging information from the JS SDK, including tracked events, user IDs, SDK configuration, and more. This can be very useful for debugging or testing your web integration, and event tracking or web personalization.
We have rebuilt the Exponea Console from the ground up. The new version described in this article works without the need to add API endpoints to the extension. You will need SDK v2.13.1 or newer.
If you have been using the beta version of the console, this comes as an automatic upgrade. Anyone that was using the first legacy version of the console will have to reinstall the extension manually.
Installing the console
Exponea Console works as a Google Chrome extension. This means that in order to use it, you have to first download and install the extension from Google Chrome Web Store in your Chrome browser.
The installation process is simple. Simply navigate to the Console’s Chrome Web Store page and click on the “Add to Chrome” button. The installation will begin automatically. Once complete, an icon should appear in the top-right corner of your browser window. Now you are ready to use this feature.
Using the console
Exponea Console has a secure connection with the Bloomreach Engagement SDK, from which it receives all the information it displays.
The extension is accessible as one of the tabs in the top menu of Chrome's Devtools. To use it and view all the information, you can navigate to Devtools by right clicking on the website > Inspect elements, by navigating to Menu > More tools > Developer tools, or by pressing Ctrl+Shift+I / Cmd+Option+I.
Currently, Exponea Console has 4 tabs, each with different functionalities.
Timeline
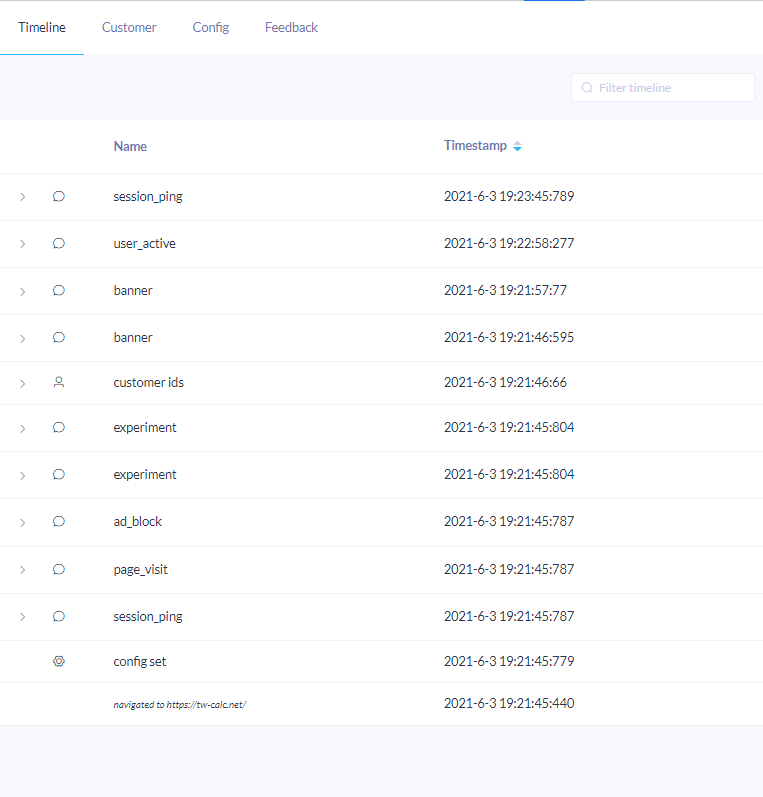
This tab shows all the events and attributes, customer IDs, or config changes that are being generated on your website and sent to your Bloomreach Engagement project. These are ordered by timestamp by default. The sort order can be adjusted and the items can be filtered.
- Events are marked with a thought bubble symbol. Event attributes can be viewed by clicking on the event in the list.
- Customer IDs are marked with a portrait symbol.
- Config changes are marked with a wheel symbol. These represent a point that the SDK config was set.

Customer
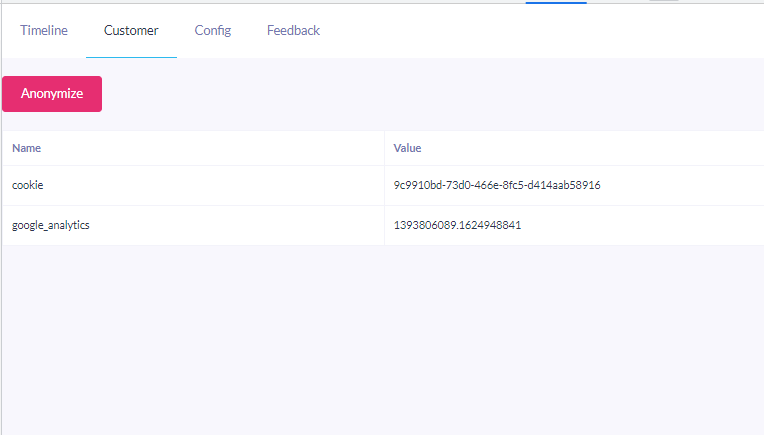
This tab shows the current user’s IDs and offers an option to anonymize. These can include, for example, your cookie or Google Analytics ID, if they are set. You can use this information to find your customer profile in the Bloomreach Engagement app.
Clicking on the “Anonymize” button will call the anonymize function on the SDK which generates a new customer cookie. You can read more about what this function does and its limitations in our tracking documentation.

Config
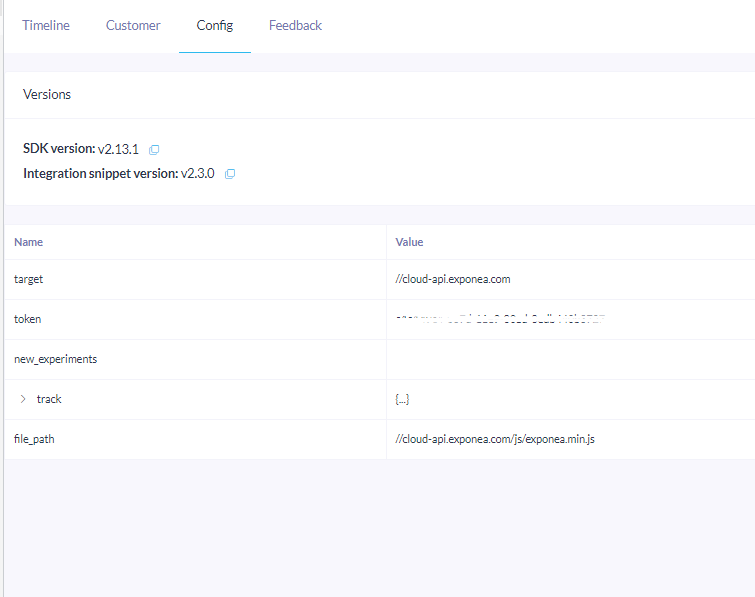
This tab shows which version of SDK and the integration snippet is being used on the webpage, and the SDK configuration under the “track” item in the list. You can also view your project token here.

Feedback
This is a place to leave any feedback about the extension. We will be grateful for any feedback you might have. We aim to keep improving the extension, so any comments or feature requests are welcomed. This can be submitted anonymously, but we would be grateful if you would leave us your email or name so we can follow up on the feedback.
Data gathering
To remain 100% transparent, we would like to inform you that we track very basic events when you use the Exponea Console. We do this to better understand whether you like it and which features you use the most.
These events are limited to someone opening Exponea Console, which tab they viewed and what feedback they left, if any. All this data is anonymous (unless you voluntarily leave us your name or email when submitting feedback).
Updated 28 days ago
