

Aggregates and running aggregates
Aggregates are custom customer attributes that are calculated from already existing data. They help you calculate aggregated information for every customer. An example of an aggregate is calculating a customer's lifetime value. In your report, use sum>purchase>total_price.
Running aggregates are custom event attributes, which is the main difference from aggregates. They help you calculate aggregated information for any event. Use running aggregates in almost any analytical part of Bloomreach.
| Aggregate types | Description |
|---|---|
| minimum/maximum | Returns the smallest / biggest value from the dataset. |
| sum | Sums values in the dataset. For example, sum > purchase > total_price returns the total spend. |
| count | Counts the number of data points. For example, count > purchase returns the number of purchases. |
| avg (average) | Returns the average of all values of that specific event. |
| first/last | Returns the value of the first/last occurrence of that event. |
| exists | Returns either 1 or 0. For example, if a customer has never purchased before, then exists > purchase returns 0 and vice versa. |
| most common | Returns the most common value, such as the most viewed item. |
| count distinct | Counts distinct values in a data set, such as the number of categories a specific customer viewed. |
| distinct values | Lists all the unique values within an aggregate. |
For the most common aggregate type, in case there are two (or more) equal outcomes, Bloomreach picks the first one that occurred in the event history.
ImportantWhen using decimal numbers, ensure to denote them by
.(e.g.12.34) as otherwise,sum,avgor other mathematical aggregates don't work properly
Grasping aggregates and running aggregates and the difference between them might be a bit tricky at the beginning. This short video explains the topic.
Create aggregates and running aggregates
Create in two ways:
- Go to
Data & Assets>Data manager>Definitions>New definition. - Create aggregates/running aggregates when selecting customer attributes/events for your analysis, wherever it is possible. You can also save them for later use (so they appear in the list next time) by clicking the Save button.
The process of creating an aggregate is simple:
1. Select the calculation operator (sum, first, last ...)
2. Select the event with which you want to calculate the aggregate. For example Count > purchase calculates the number of purchases for all customers.
3. Specify the metric further by adding an attribute of the event. For example Sum > purchase > total_price calculates the total revenue generated by each customer.
Running aggregates: Difference between including/excluding event
Running aggregates contain one additional setting, which decides whether to include or exclude the event itself from the calculation. This setting is relevant when the anchor event is identical to the event from which the running aggregate is calculated. See the 2 use cases about calculating revenue and conversion rate by country.
Skip first function
You can skip any number of values for the first, last and most common aggregates. For example, you can use the aggregate "first purchase timestamp > skip 1", which gives you the timestamp of the second purchase of that particular customer.

The skip first input field in the aggregate configuration panel
NoteFor distinct aggregate, it has 100% precision if there are less than 10k unique values. If there are more values, it has around 97% precision.
Group by attribute
The Group by feature organizes events based on specific attributes, allowing you to track changes for each customer or entity. It’s especially useful when you need to capture the most recent update for an event attribute—such as the latest destination in travel bookings or the final status of a purchase.
Key benefits of Group by attribute
- Track the latest or first value for a specific attribute (for example, the most recent update).
- Useful in industries like travel, hospitality, or retail, where event attributes can change over time.
- Ensures your analysis reflects the most up-to-date information for each grouped entity.
NoteYou can only group events using attributes defined in the Data Manager schema. Make sure the attribute you want to group by is available in your data fields.
How Group by and filtering work together
The Group by feature always groups all events by your selected attribute before any filters are applied. This means:
- Grouping happens first: All events are grouped by the chosen attribute (for example, booking ID or purchase ID).
- Filtering happens second: Your filter criteria are then applied to the grouped results.
Example: If you group by "ID" and then filter for purchase_status = success, the grouping includes all events for each ID, not just those with a successful status.
Example 1: Find the updated final destination for flight bookings
Suppose customer John has booked several flights. Each booking event has an ID and a final destination. If John changes his destination, multiple events share the same ID but have different destinations.
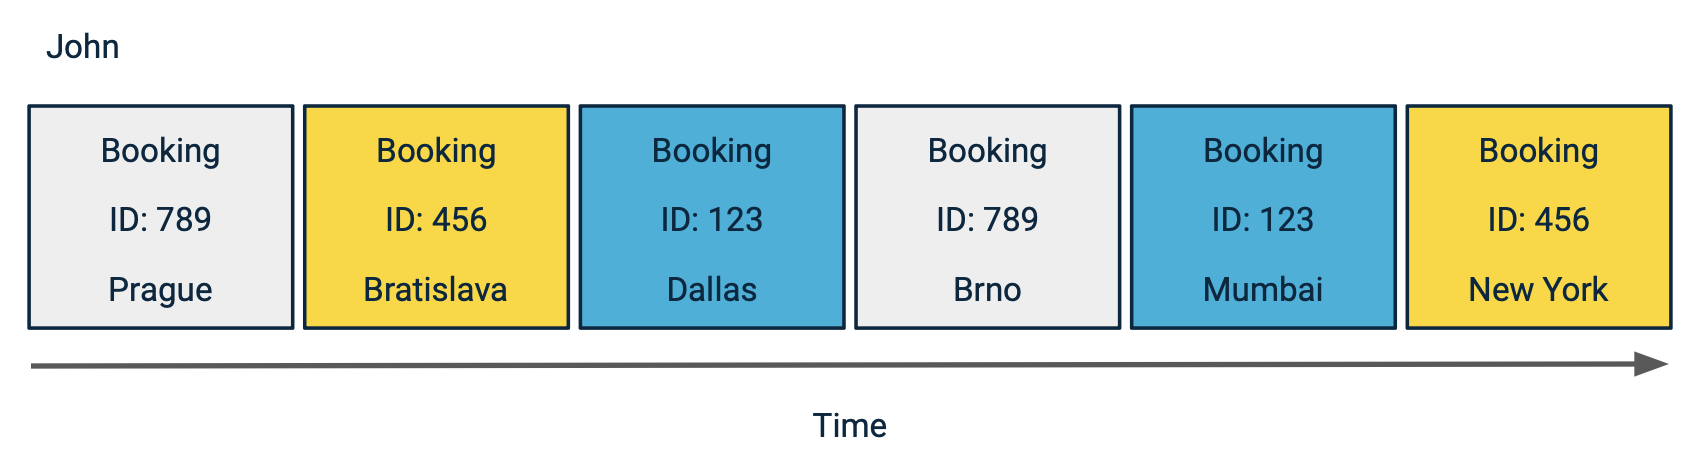
Grouping by booking ID to retrieve the latest destination per booking
Here's the situation in the comparative table:
| ID | Original destination | Updated final destination |
|---|---|---|
| 789 | Prague | Brno |
| 456 | Bratislava | New York |
| 123 | Dallas | Mumbai |
Group by attribute allows you to see the latest destination by grouping based on an attribute shared by the bookings. This case applies an event filter for ‘bookings’ and groups by ‘IDs’.

Then, instead of looking at all the events, the feature only looks at the last one and finds the newest information for each booking.
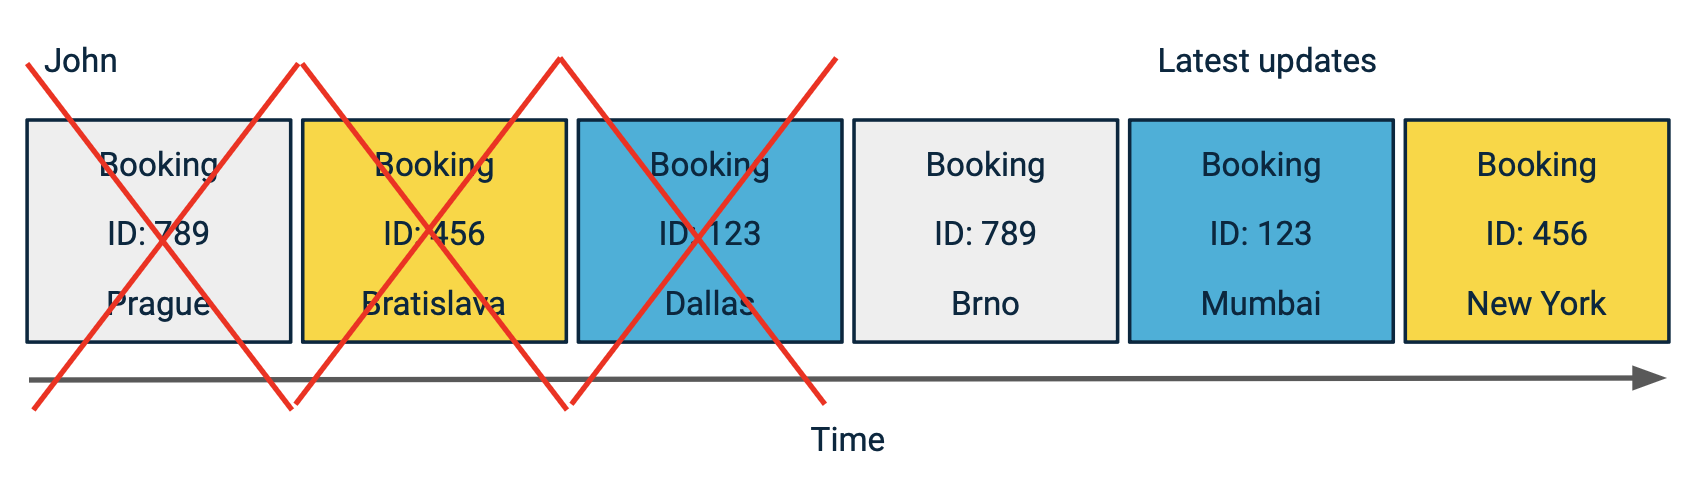
The aggregate returns one row per booking ID, reflecting the most recent destination
Example 2: Find the lifetime value of a customer
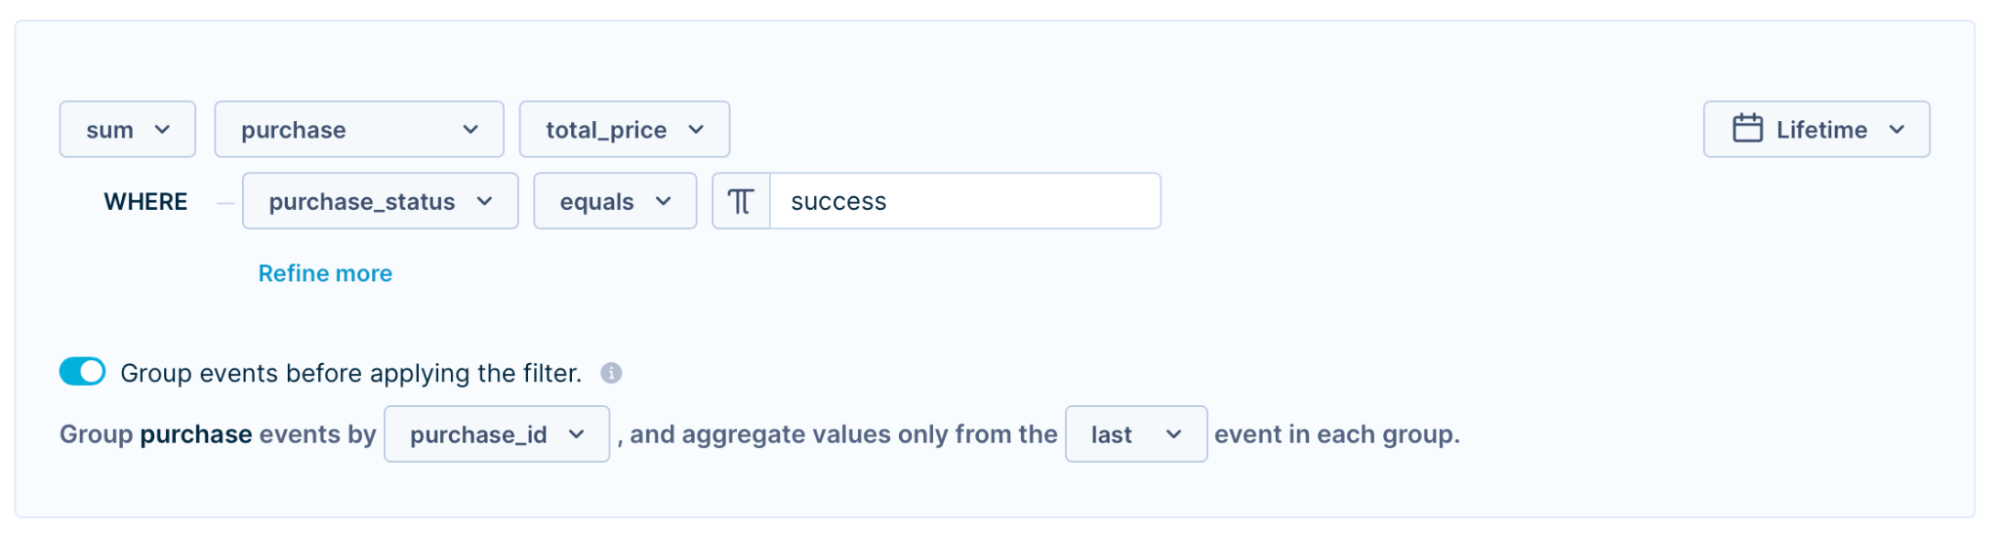
Group by attribute also helps you calculate a customer’s real lifetime value by considering only purchases with a purchase_status of "success," automatically excluding returns.
Suppose John made several purchases, and one was returned (ID 789).
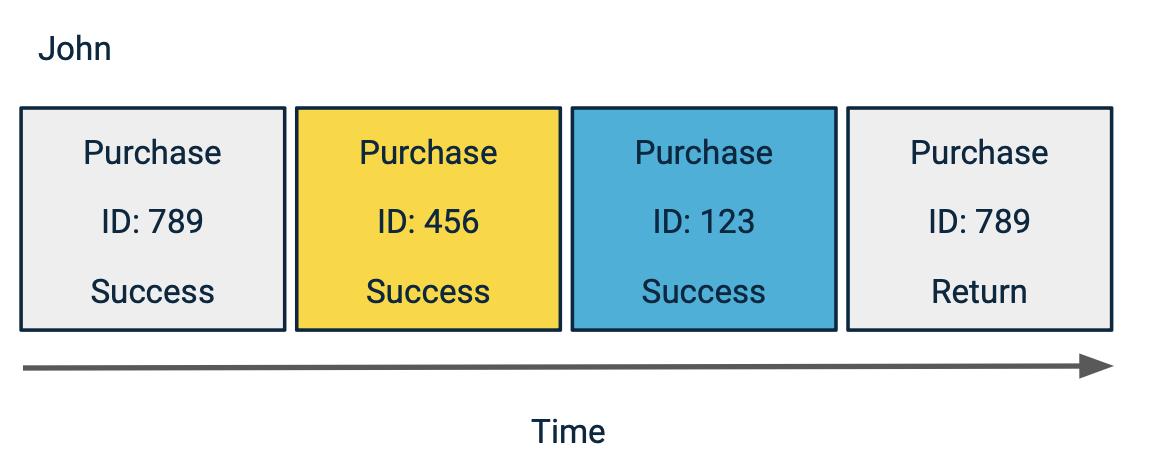
Grouping by purchase ID
Grouping by "ID" and filtering for purchase_status = success, you ensure only successful purchases are counted.
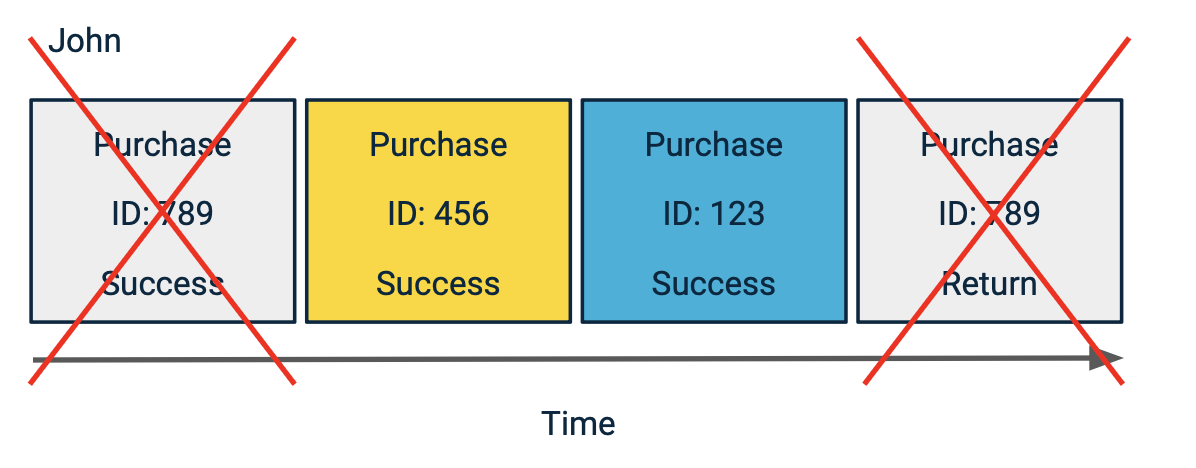
Filtering for successful status excludes returned orders
How group by attribute works
- Create an aggregate. Define aggregation, event type, and filters.
- Enable grouping:
- Select an event attribute for grouping.
- Choose to aggregate values from either the First or Last event in each group.
Select the grouping attribute and event preference in the aggregate panel
- Save the aggregate.
- Use this aggregate as usual.
TipUse Aggregates for personalization through Jinja, as well as for analytics.
Example use cases
Aggregates
Aggregates can be used for filtering and segmenting customers or in expressions. They are usually used in campaign filters. Check out these examples to see what kind of insights are available through aggregates. Notice every analysis related to a customer.
How many purchases does a customer have in total?

How many times customer visited our page in the last 30 days?

What is a customer’s total lifetime value?

What is the average customer purchase when using loyalty points for purchase?

What was the referrer of a customer’s first visit to the webpage?

How many emails has the customer received from us in the last 14 days?

What was the last product the customer viewed?

Running aggregates
What is the revenue per country?
If you don't track country as an attribute of the purchase event, then you need to retrieve it from the session_start event using a running aggregate. For every purchase in the past, Bloomreach looks at the last session_start > country that preceded that purchase and attributes that purchase to the country which is tracked there.
NoteChanging the
including/excludingoperator does not make a difference here. Read the next use case for further explanation.

Running aggregate retrieving country from the last session_start event
What is the conversion rate per country?
The metric (conversion rate) is, in this case, a formula that uses two types of events – session_start and purchase – meaning that the report cannot be broken down by an attribute of one or the other. As mentioned above, the attribute ‘country’ is tracked for event session_start, but usually not for event purchase.
The running aggregate for this report looks like this:

Running aggregate configured to find country for session_start
Here, it is crucial to switch from excluding to including. There are two anchor events in this case – session_start and purchase. The running aggregate looks for the country of the last session_start both before every purchase event and before every session_start event, including that very event.
The including/excluding setting matters here because the running aggregate is calculated from one of the anchor events - session_start.
The report looks like this:

Conversion rate by country using a running aggregate
In this case, you have to insert the running aggregate into Rows, before inserting the Metric. Once you insert a formula that uses two types of events under Metrics, you won't be able to choose an event attribute (or running aggregate) under Rows anymore. So make sure to start with Rows in such cases.
What was the referrer for the last session_start of this event (for example: purchase)?

When was the last time a specific weblayer was viewed by any customer?

When was the last time an email was delivered to any customer?

Group by attribute
- Travel companies: Track new events for updates on trips, flights, or accommodations.
- Insurance companies: Maintain a record of the latest state of contracts.
- Count purchase aggregation: Create an aggregate for each user to get the number of purchases. Without this feature, you would also count purchases that have resulted in a return (Success - Return). However, with 'Group by' you can exclude such purchases like this:
- Count Purchase
- Where
Status = Success
- Where
- Group by ID and aggregate only the most recent events (Last events). This ensures that purchases marked as "Success" are genuinely the latest ones, and any subsequent "Return" status events are excluded.
- Count Purchase
Updated 8 days ago