

Channel performance
Channel performance dashboards within Performance dashboards provide comprehensive insights into your email marketing efforts. These dashboards help you assess campaign effectiveness, financial impact, and delivery health to optimize your email strategies.
Explore our video clip on Channel performance for a guided visual tour.
Channel performance dashboards types
Email revenue dashboard
The Email revenue dashboard shows revenue generated by your email marketing. It calculates key metrics including revenue, average order value (AOV), buyers, purchases, and conversion rates. Use this dashboard to evaluate and optimize campaign financial performance.
Learn more in the Email revenue dashboard article.
Email engagement dashboard
The Email engagement dashboard provides an overview of campaign performance with metrics such as delivery rate, open rate, click-through rate, and conversions. Use this dashboard to evaluate email marketing effectiveness and identify areas for improvement.
Learn more in the Email engagement dashboard article.
Email deliverability dashboard
The Email deliverability dashboard tracks email delivery performance and audience health. It shows delivery rates, bounce patterns, delivery speed, and engagement quality to help you identify and resolve delivery issues.
Learn more in the Email deliverability dashboard article.
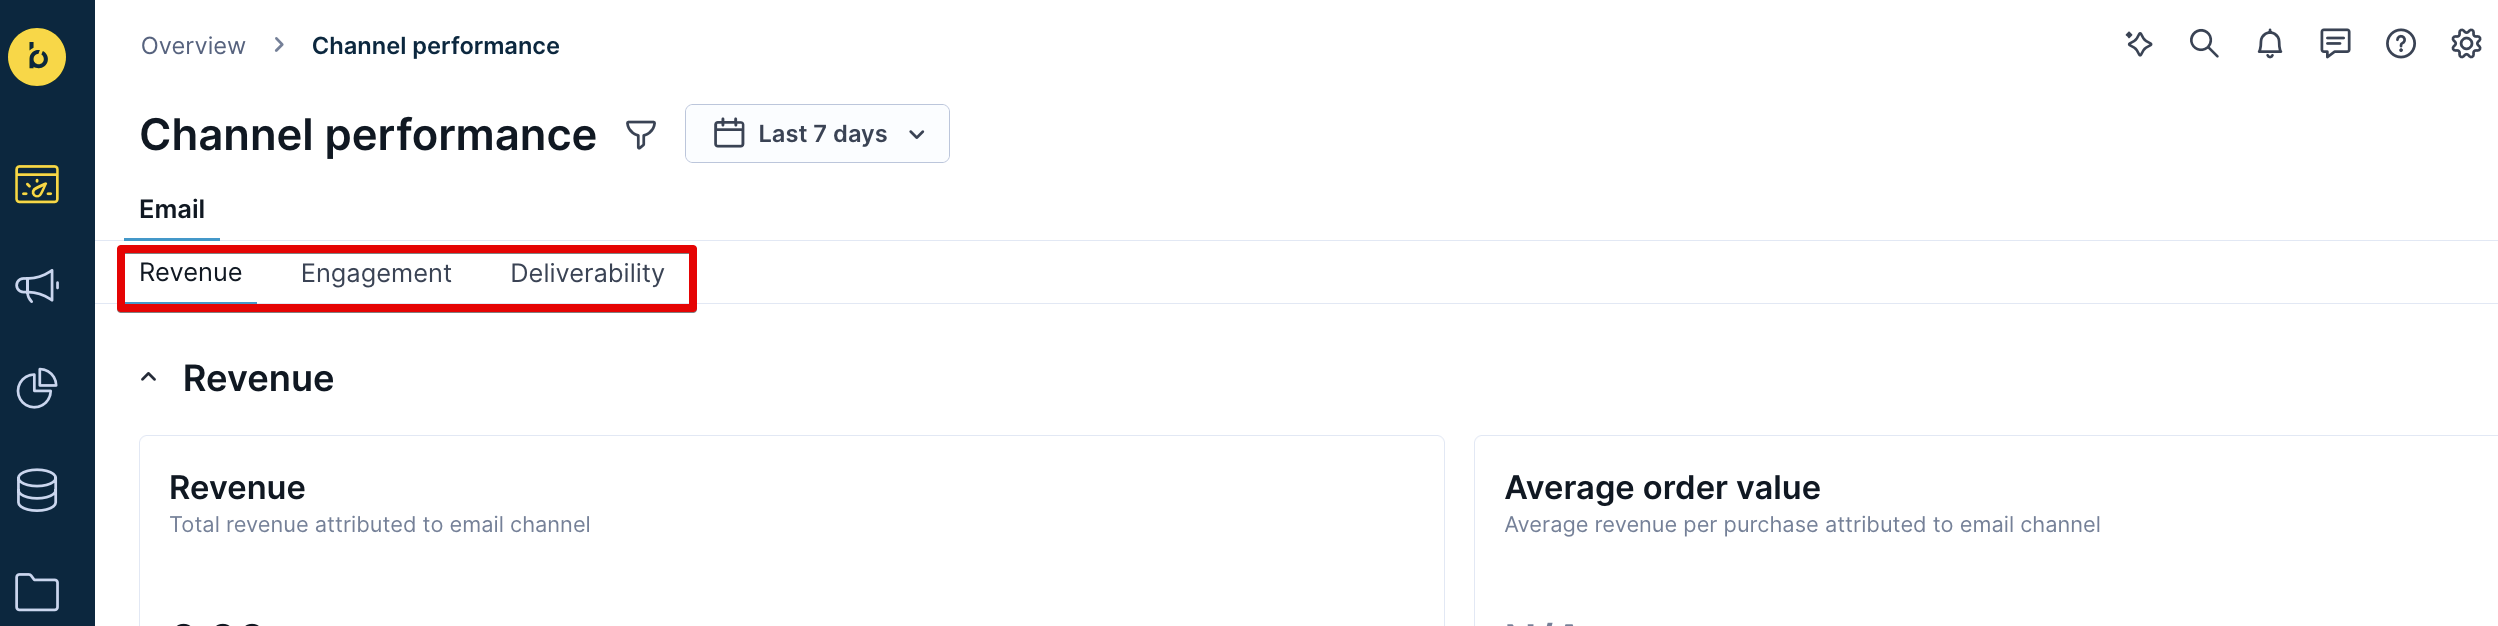
How to access Channel performance dashboards
- Click Overview > Channel Performance.
- Select Email.
- Choose the dashboard tab: Revenue, Engagement, or Deliverability.
The dashboard displays automatically generated insights from Bloomreach.
To customize dashboards to fit your specific needs, learn how to modify Performance dashboards. For metric definitions, refer to the glossary.
Updated 3 months ago