

Performance dashboards
Performance dashboards are pre-configured analytical tools that allow you to start analyzing key metrics and results immediately, with no initial setup required.
These dashboards provide insights into key areas, including:
- Overall business performance
- Channel performance
- Individual campaign evaluations
They cover the leading key performance indicators (KPIs).
Performance dashboards save your time by reducing manual effort and offering an out-of-the-box solution, without the need to build essential performance metrics from scratch.
You can also modify these dashboards to meet your specific needs.
Benefits of Performance dashboards
- Gain insights into how your marketing efforts translate into revenue.
- Identify the most effective areas for budget allocation.
- Highlight focus areas to understand what works well and where improvements can be made.
- No analytical skills to create advanced metrics are required; you get insights in seconds.
Video guide
Watch the video with our product manager's walkthrough for a complete overview of performance dashboards.
Performance dashboards types
Here's an overview of the Performance dashboards available in Bloomreach:
Project performance
It displays the revenue from your marketing activities, including different campaigns and channels for your project. Here's the relevant dashboard:
Channel performance
These dashboards offer insights into the revenue generated by your email marketing initiatives within a project and assess how your audience responds to the emails you send. Channel performance dashboards:
Campaign performance
Campaign performance focuses on specific metrics or reports relevant to your campaigns. The dashboards in this category include:
How Performance dashboards work
- Performance dashboards are pre-built to calculate data in your Bloomreach project.
- They aren't configurable in terms of changing the definitions or shape of individual components. However, you can modify your Performance dashboards in several ways to tailor them to your needs.
- Performance dashboards provide a consistent view of data across all levels.
- They work with data mapping and standard events Bloomreach generates, such as
campaignorsession_start. - For the Performance dashboard to work, data must be in the platform.
- Watch the Performance dashboards setup part of our video.
ImportantDefine the data mapping in advance, as this will determine how the out-of-the-box dashboard processes and displays data:
- Go to Data & Assets > Data Manager , and click Mapping.
- Fill in
Purchase (completed)event and its attributestotal_price,currency, andtotal_quantity.
How to modify Performance dashboards
You can customize various components to tailor your Performance dashboards to your current needs. Watch the video segment on the features for a visual tour.
Revenue attribution
Modifying attribution settings is crucial to ensure your dashboards benefit your business needs. Access the detailed Revenue attribution section with use case examples.
Filters
Filter date, customers, and events according to your specific criteria. Learn more about filtering options in Performance dashboards.
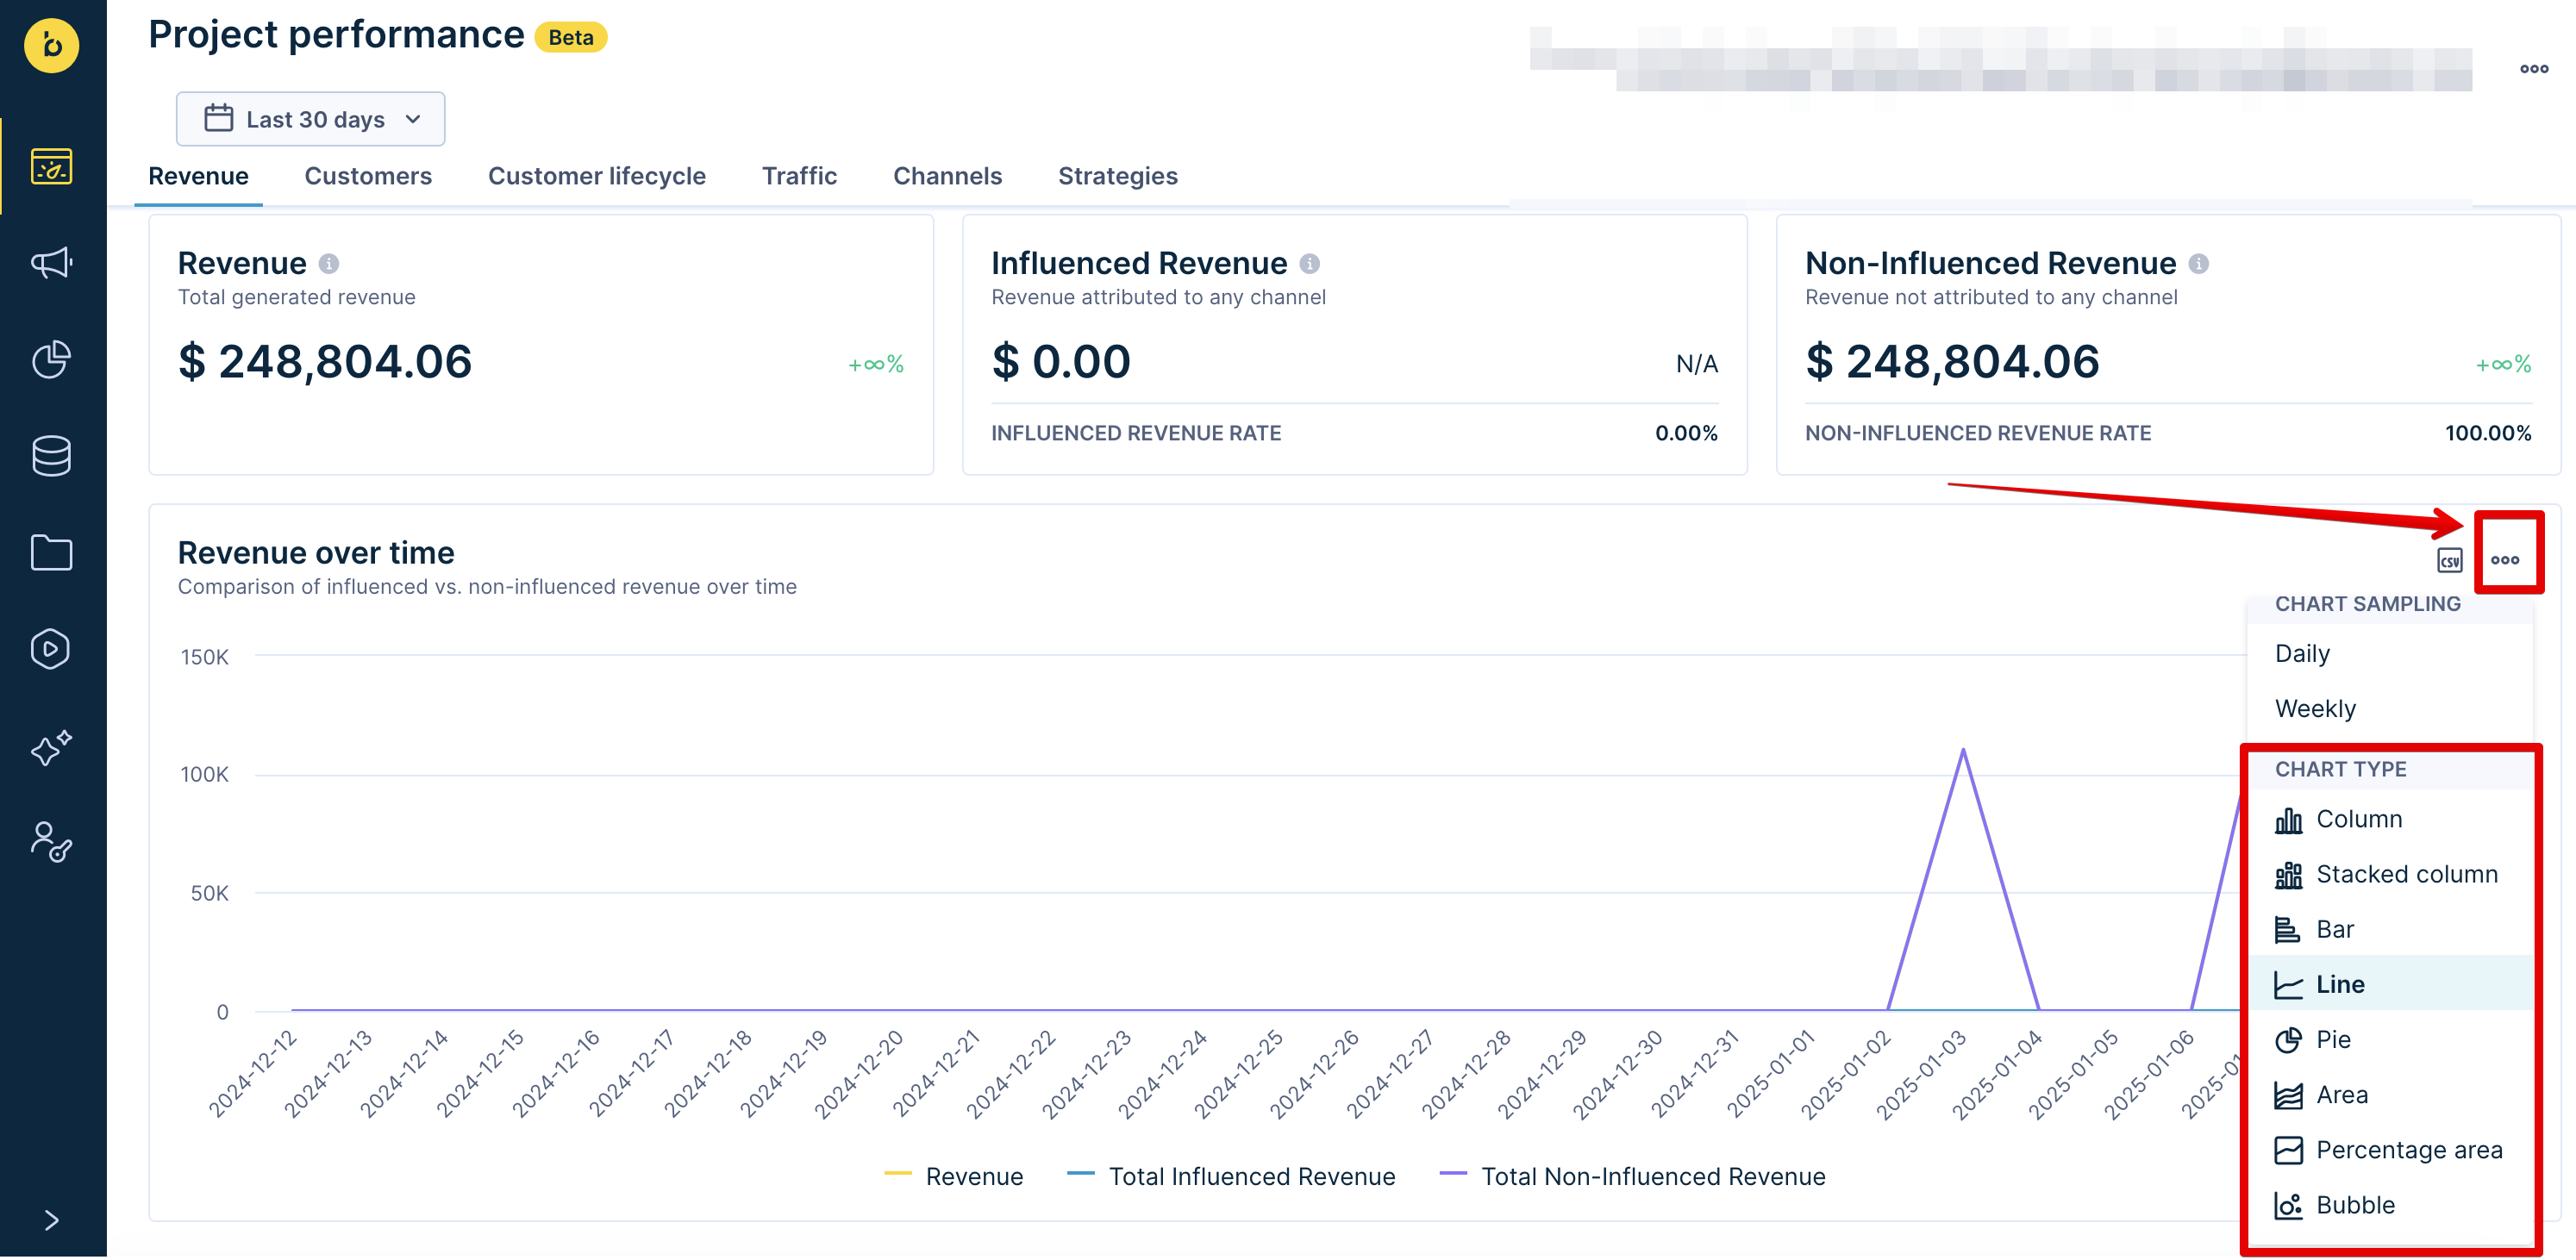
Chart types
Click on the 3-dot menu on the right corner of your report to select your preferred chart type. Refer to the chart types section for detailed descriptions.
Currency
Select the displayed currency symbol of your dashboards, and use the currency converter. Learn more about these options in the Currency in Performance dashboards article.
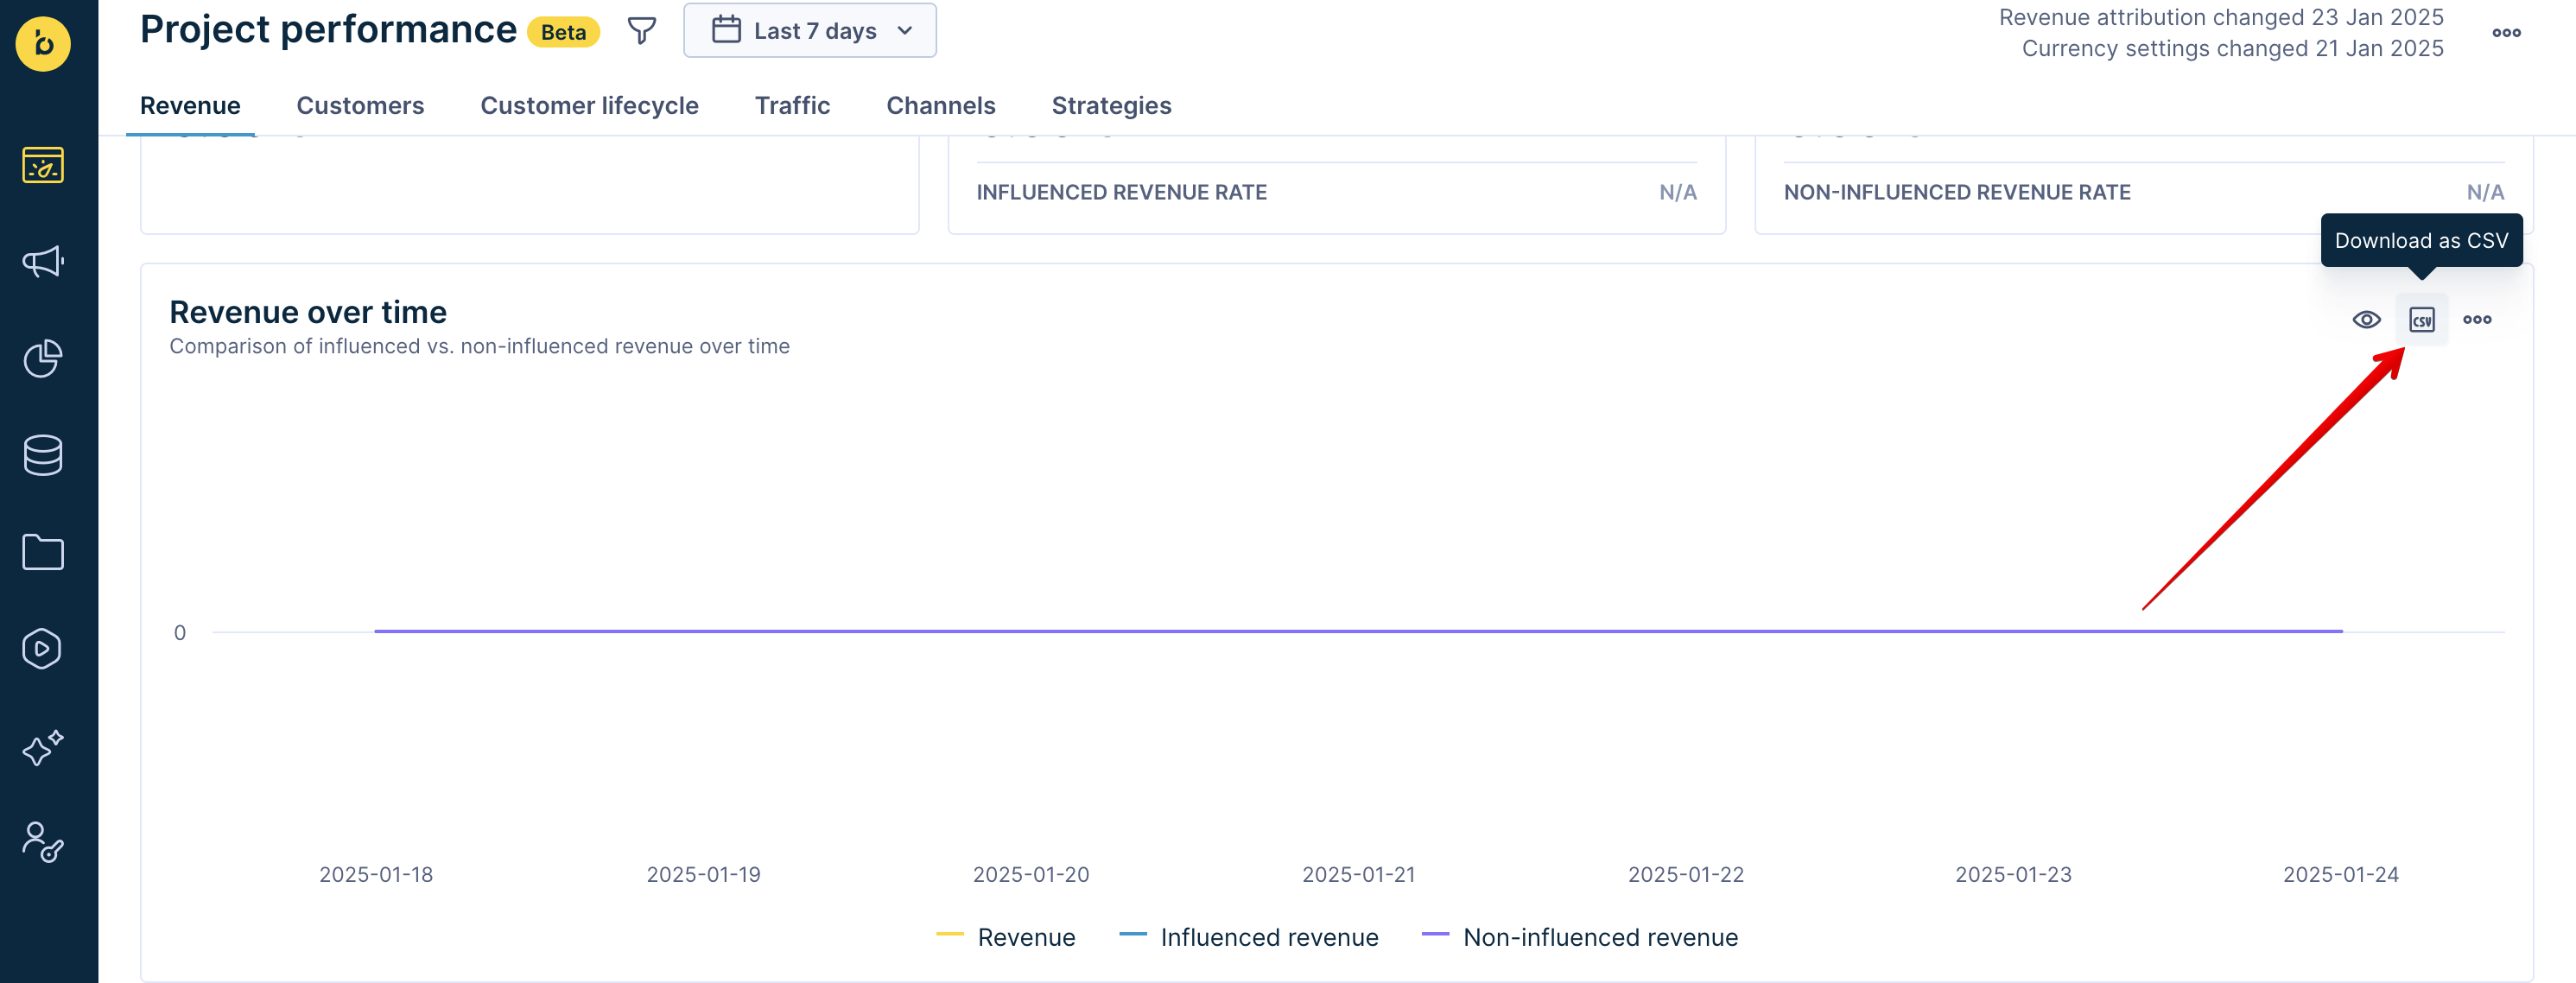
Report exports
To download a specific report as a CSV file for storage or further analysis, hover over the CSV icon at the top right corner of the selected report. Click Download as CSV. The CSV file will be in your Downloads folder.
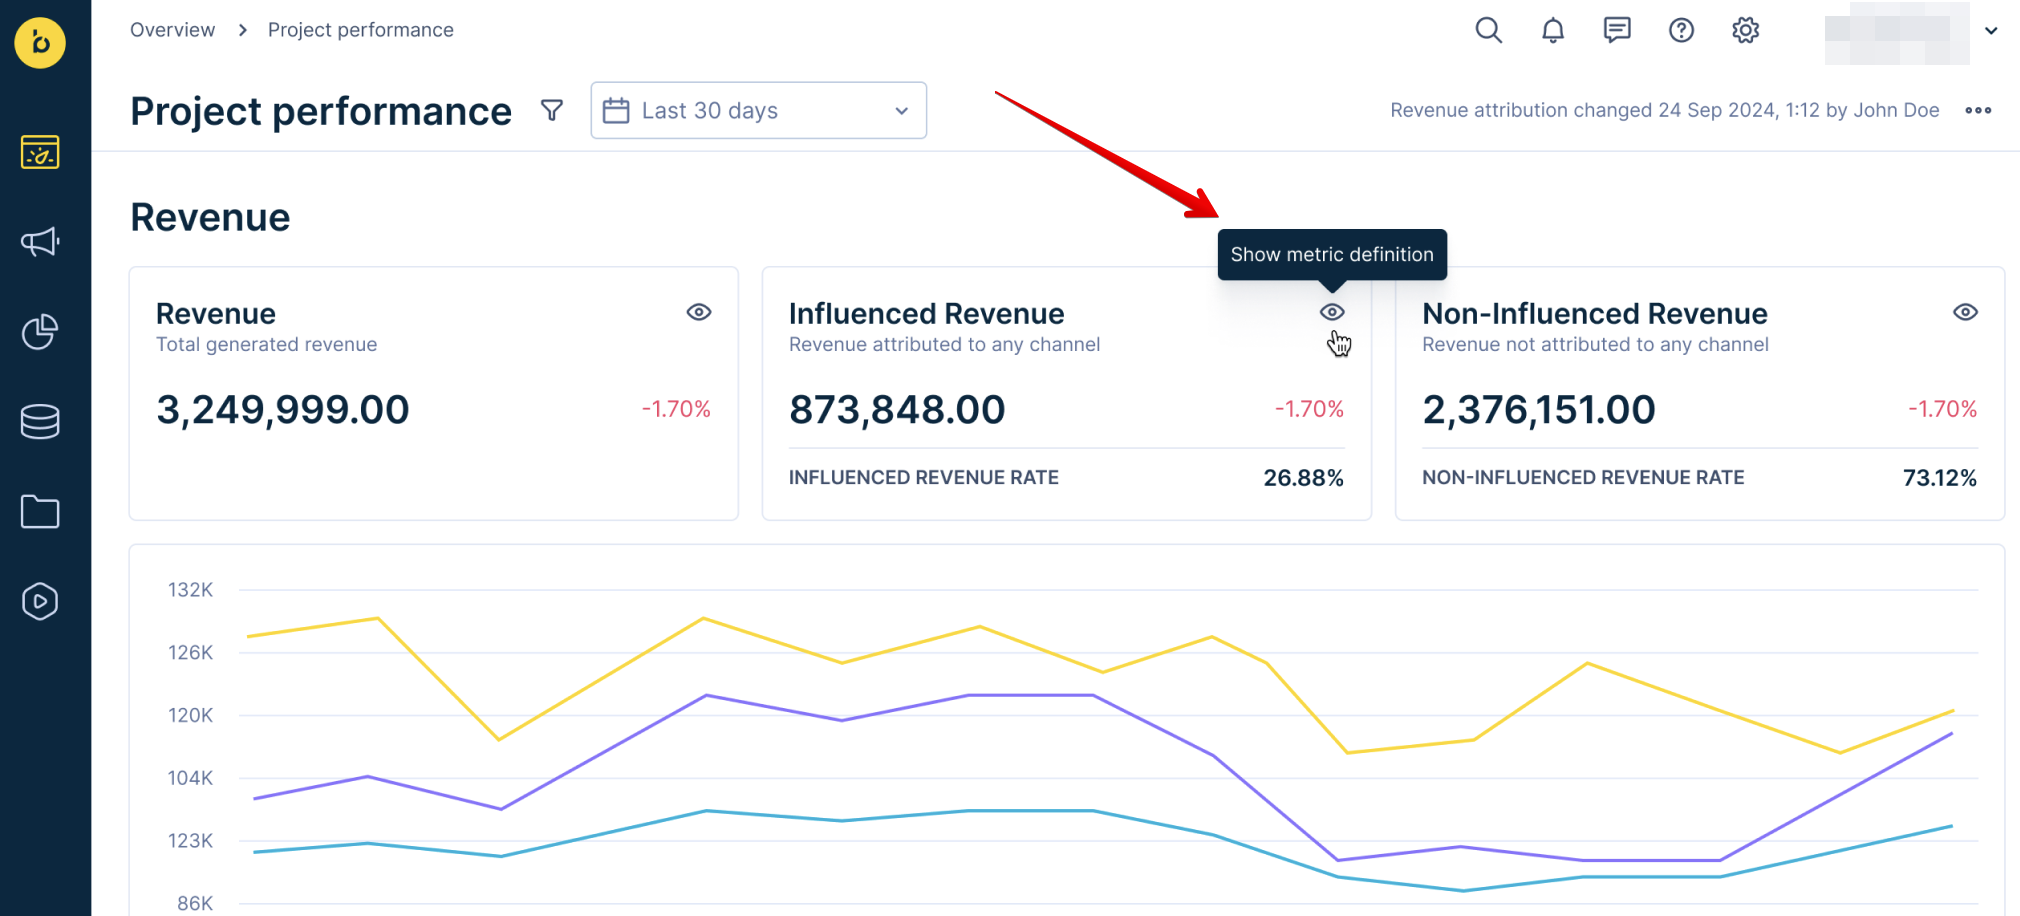
Show metric definition
The "Show metric definition" feature allows you to preview the definitions used in your dashboard's metrics. This option helps you understand the data being pulled and the formulas applied.
To use this feature, hover over the eye icon at the top right corner of a metric and click Show metric definition. A read-only window will display detailed information about the selected metric.
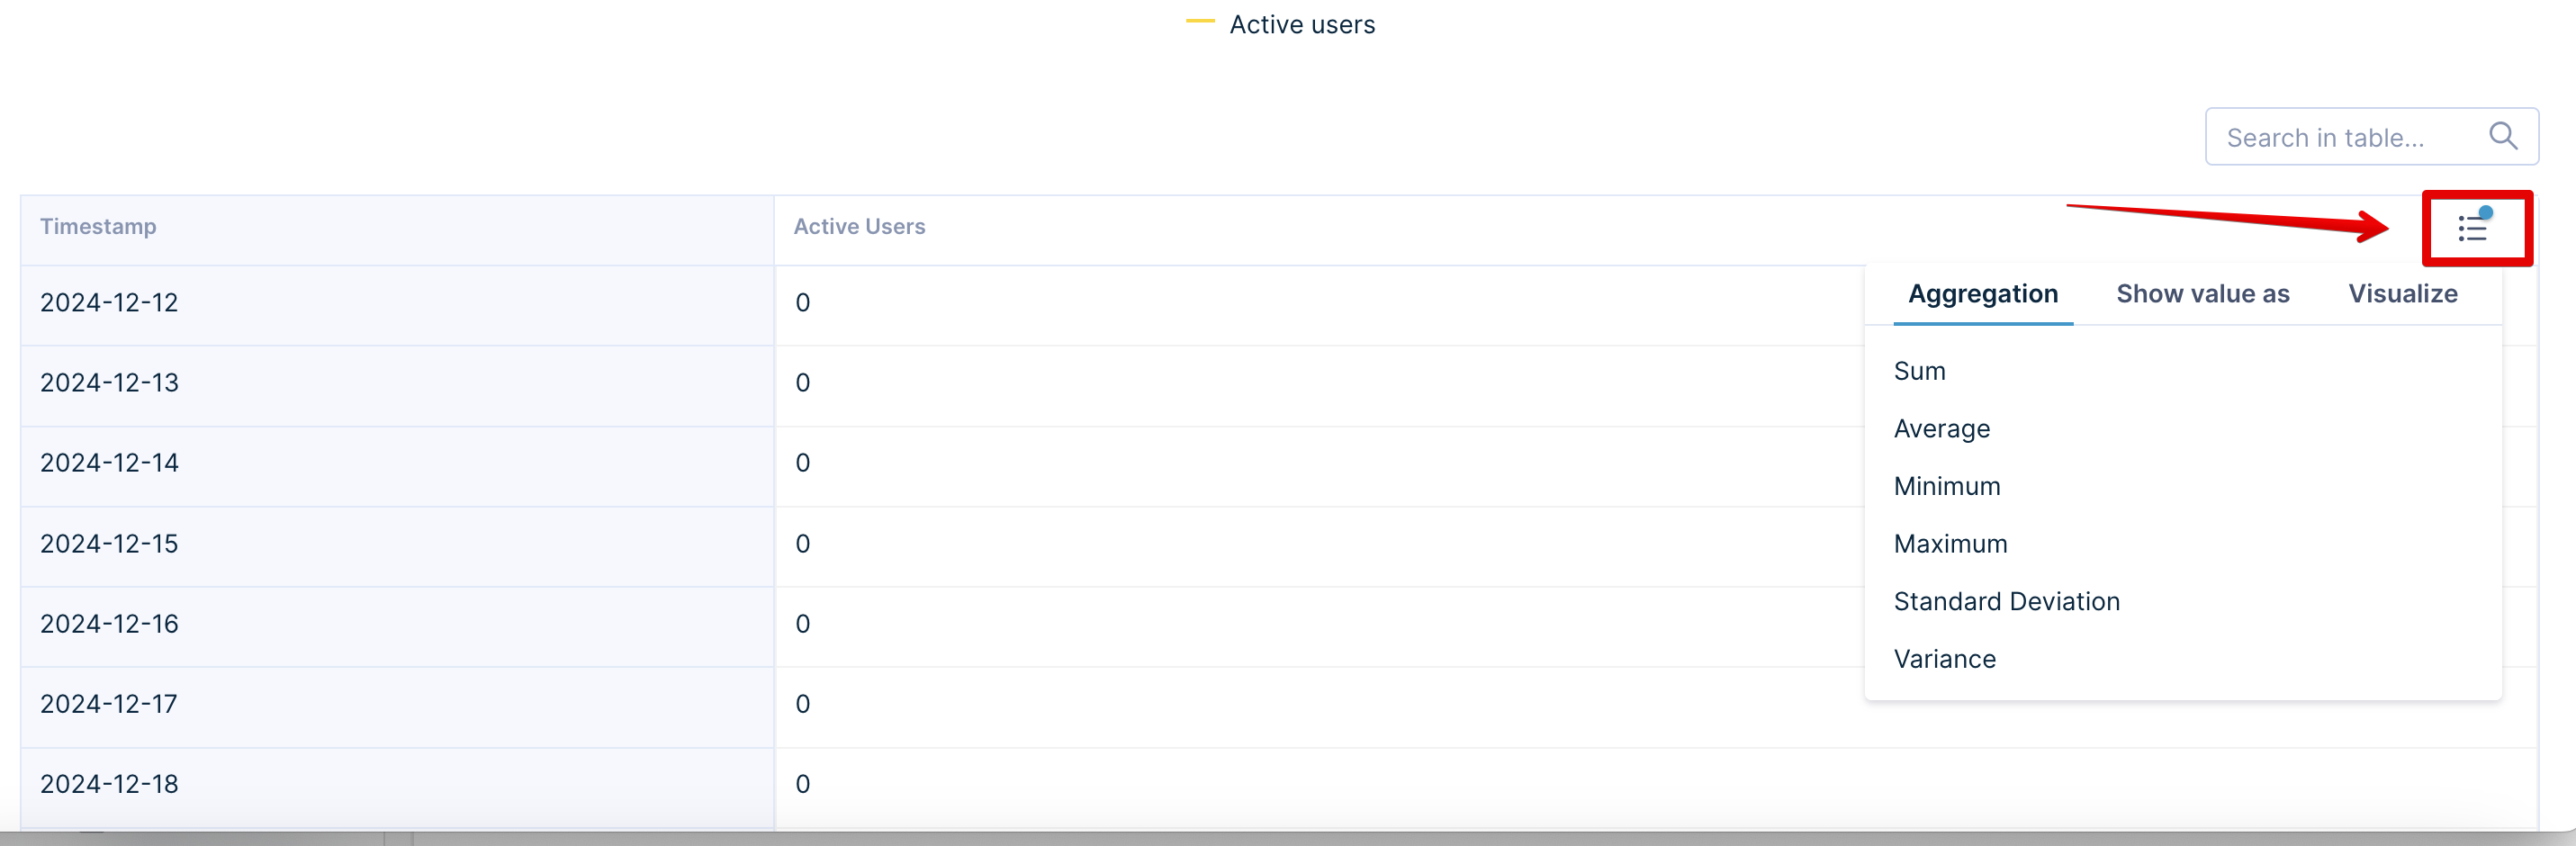
Aggregation and column visualization
Performance dashboards use the standard functionality of report modifiers.
To see aggregated data and color-visualization possibilities for individual columns (metrics), select View options icon in your table report. Then, choose Aggregation, Show value as, or Visualize options.
Limitations of Performance dashboards
- Different users may see different results based on their time zones and selected time ranges.
- You can't change the Performance dashboard's definitions.
- Performance dashboards will not calculate users with:
- More than 500 conversion events (purchases)
- More than 10,000 campaign events
- More than 10,000 banner events
- Time picker is limited to a maximum of 365 days. "Lifetime" and "From Start" ranges aren't supported.
- Sampling options depend on the selected time range and may adjust automatically to valid options.
- Aggregation calculations don't dynamically adjust based on search-filtered rows.
- CSV exports may require additional formatting for external analysis.
Updated 3 months ago