

Geo Analyses
This guide explains how to create and configure a Geo Analysis to visualize the geographical distribution of your customer activity. Watch this video to get an overview of the basic features in Geo Analyses:
How to create a Geo Analysis
1: Create a new Geo Analysis
- Navigate to Analyses > Geo Analyses.
- Click the + icon next to Geo Analyses in the dropdown menu.
- An edit window opens with a new, empty geo analysis definition.
2: Configure your Geo Analysis
- Select a Location preset from the dropdown menu in the geo analysis definition pane.
- Click Add to metrics to select a customer attribute.
- Choose Size to map the values of this attribute to the size of the dot on the map, or Color to map the values to the colors of the dots.
- Click Preview in the upper right corner of the page.
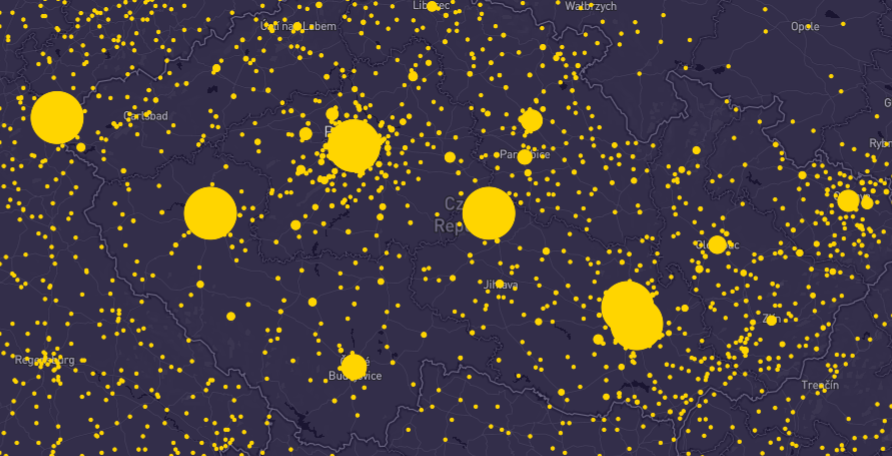
Customer activity plotted as colored dots.
Location presets
The following options are available from the dropdown menu:
| Preset | Description |
|---|---|
| First session | Takes data from the first occurrence of the session_start event per customer, using the default latitude and longitude attributes. Works as an aggregate from all customer events by default. |
| Last session | Takes data from the last occurrence of the session_start event per customer. |
| All sessions | Counts all sessions as individual occurrences. Results are not unique per customer. |
| Custom | Lets you define your own data source, either an event attribute or a customer attribute. When you select an event attribute, you can specify latitude and longitude from one event type. Event, customer, and date filters become available for further customization. |
Metrics
By default, geo analyses display the number of occurrences — either customers or events — based on the selected location preset. You can add metrics to display additional values per location, as shown below. One metric can control the size of each dot, and one metric can control the dot color based on the selected heatmap.
When Size or Color is already assigned to one metric, and you assign it to a new metric, the setting is removed from the original one. If you want more metrics to influence the color or size of the dot, create a new metric and design your own formula.
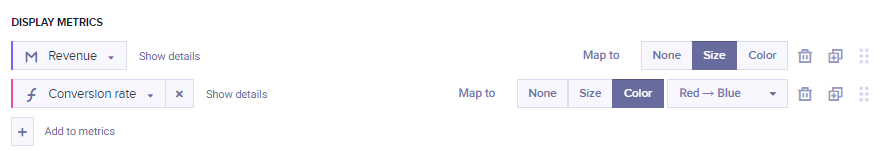
Geo Analysis definition pane with metrics configured.
Navigate the map
You can roam freely around the map by clicking the left mouse button and dragging. Use the mouse scroll wheel to zoom in, or rotate the map and switch to 3D mode using the right mouse button.
Geo Analysis map in 3D mode showing regional customer distribution.
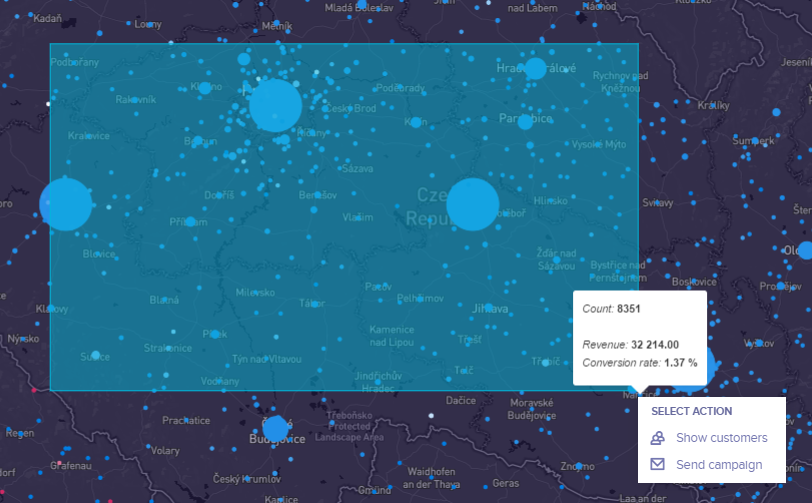
Use the direct execution menu
Hold down Shift and select an area on the map to open the direct execution menu. This lets you view or target customers in a specific geographical area.
- Show customers: Takes you to Data & Assets > Customers with two filters applied — matching either the attribute or funnel specified in the location preset, and ranging from the values selected on the map.
- Send campaign: Creates a new scenario with the condition specified using the same logic as Show customers.
NoteGeo analyses in public dashboards are only visible to users who have a Bloomreach account and are currently logged in.
Updated 4 months ago
What´s next?
Learn how to copy your geo analysis to another project in Cloning.