

Predictions
Predictions is an advanced analytics feature powered by Loomi AI. It uses machine learning to forecast what your customers will do next — so you reach the right people with the right campaigns and maximize revenue. This article covers the core concepts and available templates.
Benefits
Predictions helps you make smarter decisions across your campaigns:
- Precise targeting: Predict each customer's likelihood to purchase, churn, or engage — and focus campaigns on the right people.
- Omnichannel reach: Use predictions across web overlays, email, onsite content, and more.
- Ready-to-use templates: Start fast with prebuilt templates for the most common use cases.
How predictions work
Predictions combines historical and real-time customer data to evaluate each customer's likelihood of taking a specific action — such as making a purchase. The result is a prediction attribute: a per-customer score. The more historical data you have for your chosen target, the more accurate the results. The recommended minimum is one month, though the exact amount varies depending on the template, use case, and your project details.
Predictions attribute
When a prediction runs, Bloomreach creates a customer attribute with the same name. The attribute stores each customer's predicted value — a probability between 0 and 1 for classification models, or a number for regression models. The value is recalculated with the most current data each time it’s requested, in the same way aggregates work.
Use this attribute just like any other customer attribute — in filters, reports, segmentations, and scenarios. For example, use purchase probability to segment your audience and run campaigns only for customers most likely to convert.
Key terms
| Term | Definition |
|---|---|
| Data set | A collection of data points, also called samples. |
| Eligible customer | A customer who satisfies the conditions to be included in the model calculation. |
| Feature | An input variable the prediction model uses to make a prediction. For example, a customer's country or their number of purchases in the last year. |
| Feature window | The time period from which events are used to compute features. Expanding this window increases the information available to the model. |
| Model quality | A set of metrics estimating how accurately a model performs on new data — data that wasn't available during training. Common metrics include precision and recall (quantitative) and usability testing (qualitative). |
| Prediction model / decision tree | A statistical model trained on historical customer data to forecast future behavior, such as the likelihood of a purchase. |
| Result / probability | A score between 0 and 1 representing how likely a customer is to perform the target action. A higher score means a higher likelihood. |
| Target | The variable the model is trying to predict — for example, a purchase. |
| Target window | The time period for which the model predicts the target — for example, the next 30 days. |
| Test data set | The data set used to evaluate prediction performance. |
| Training data set | The data set used to train the model. |
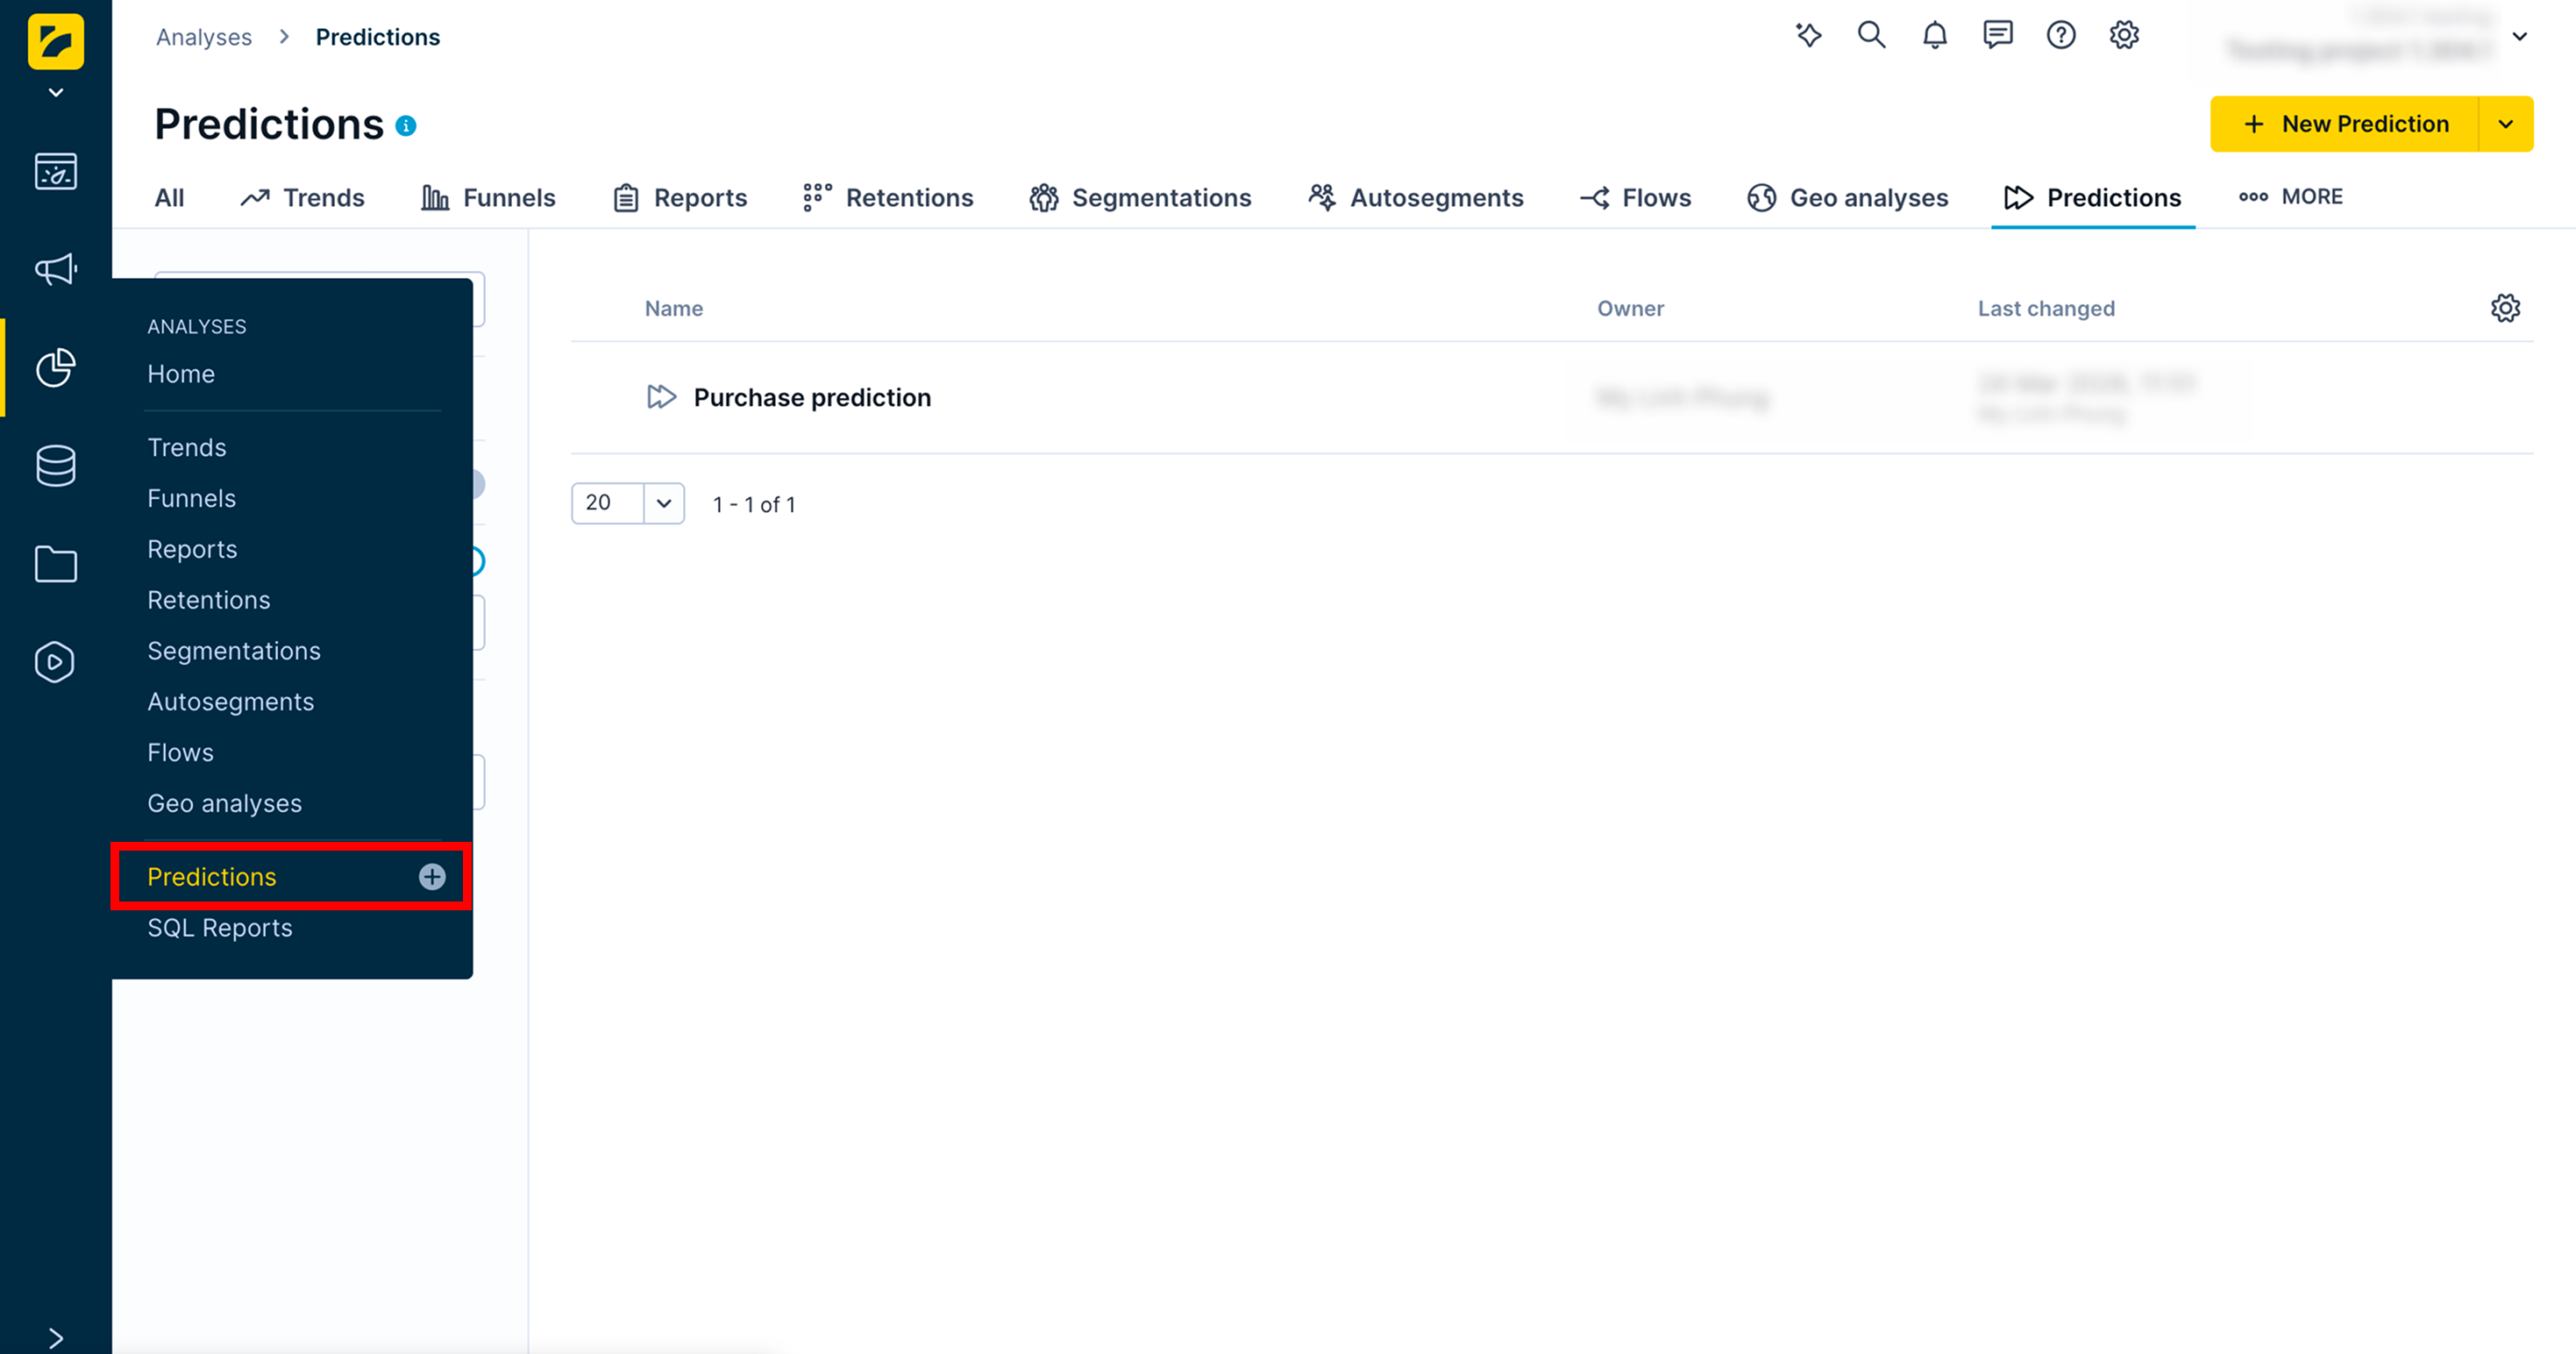
Access predictions
Go to Analyses > Predictions to manage your predictions and create new ones.
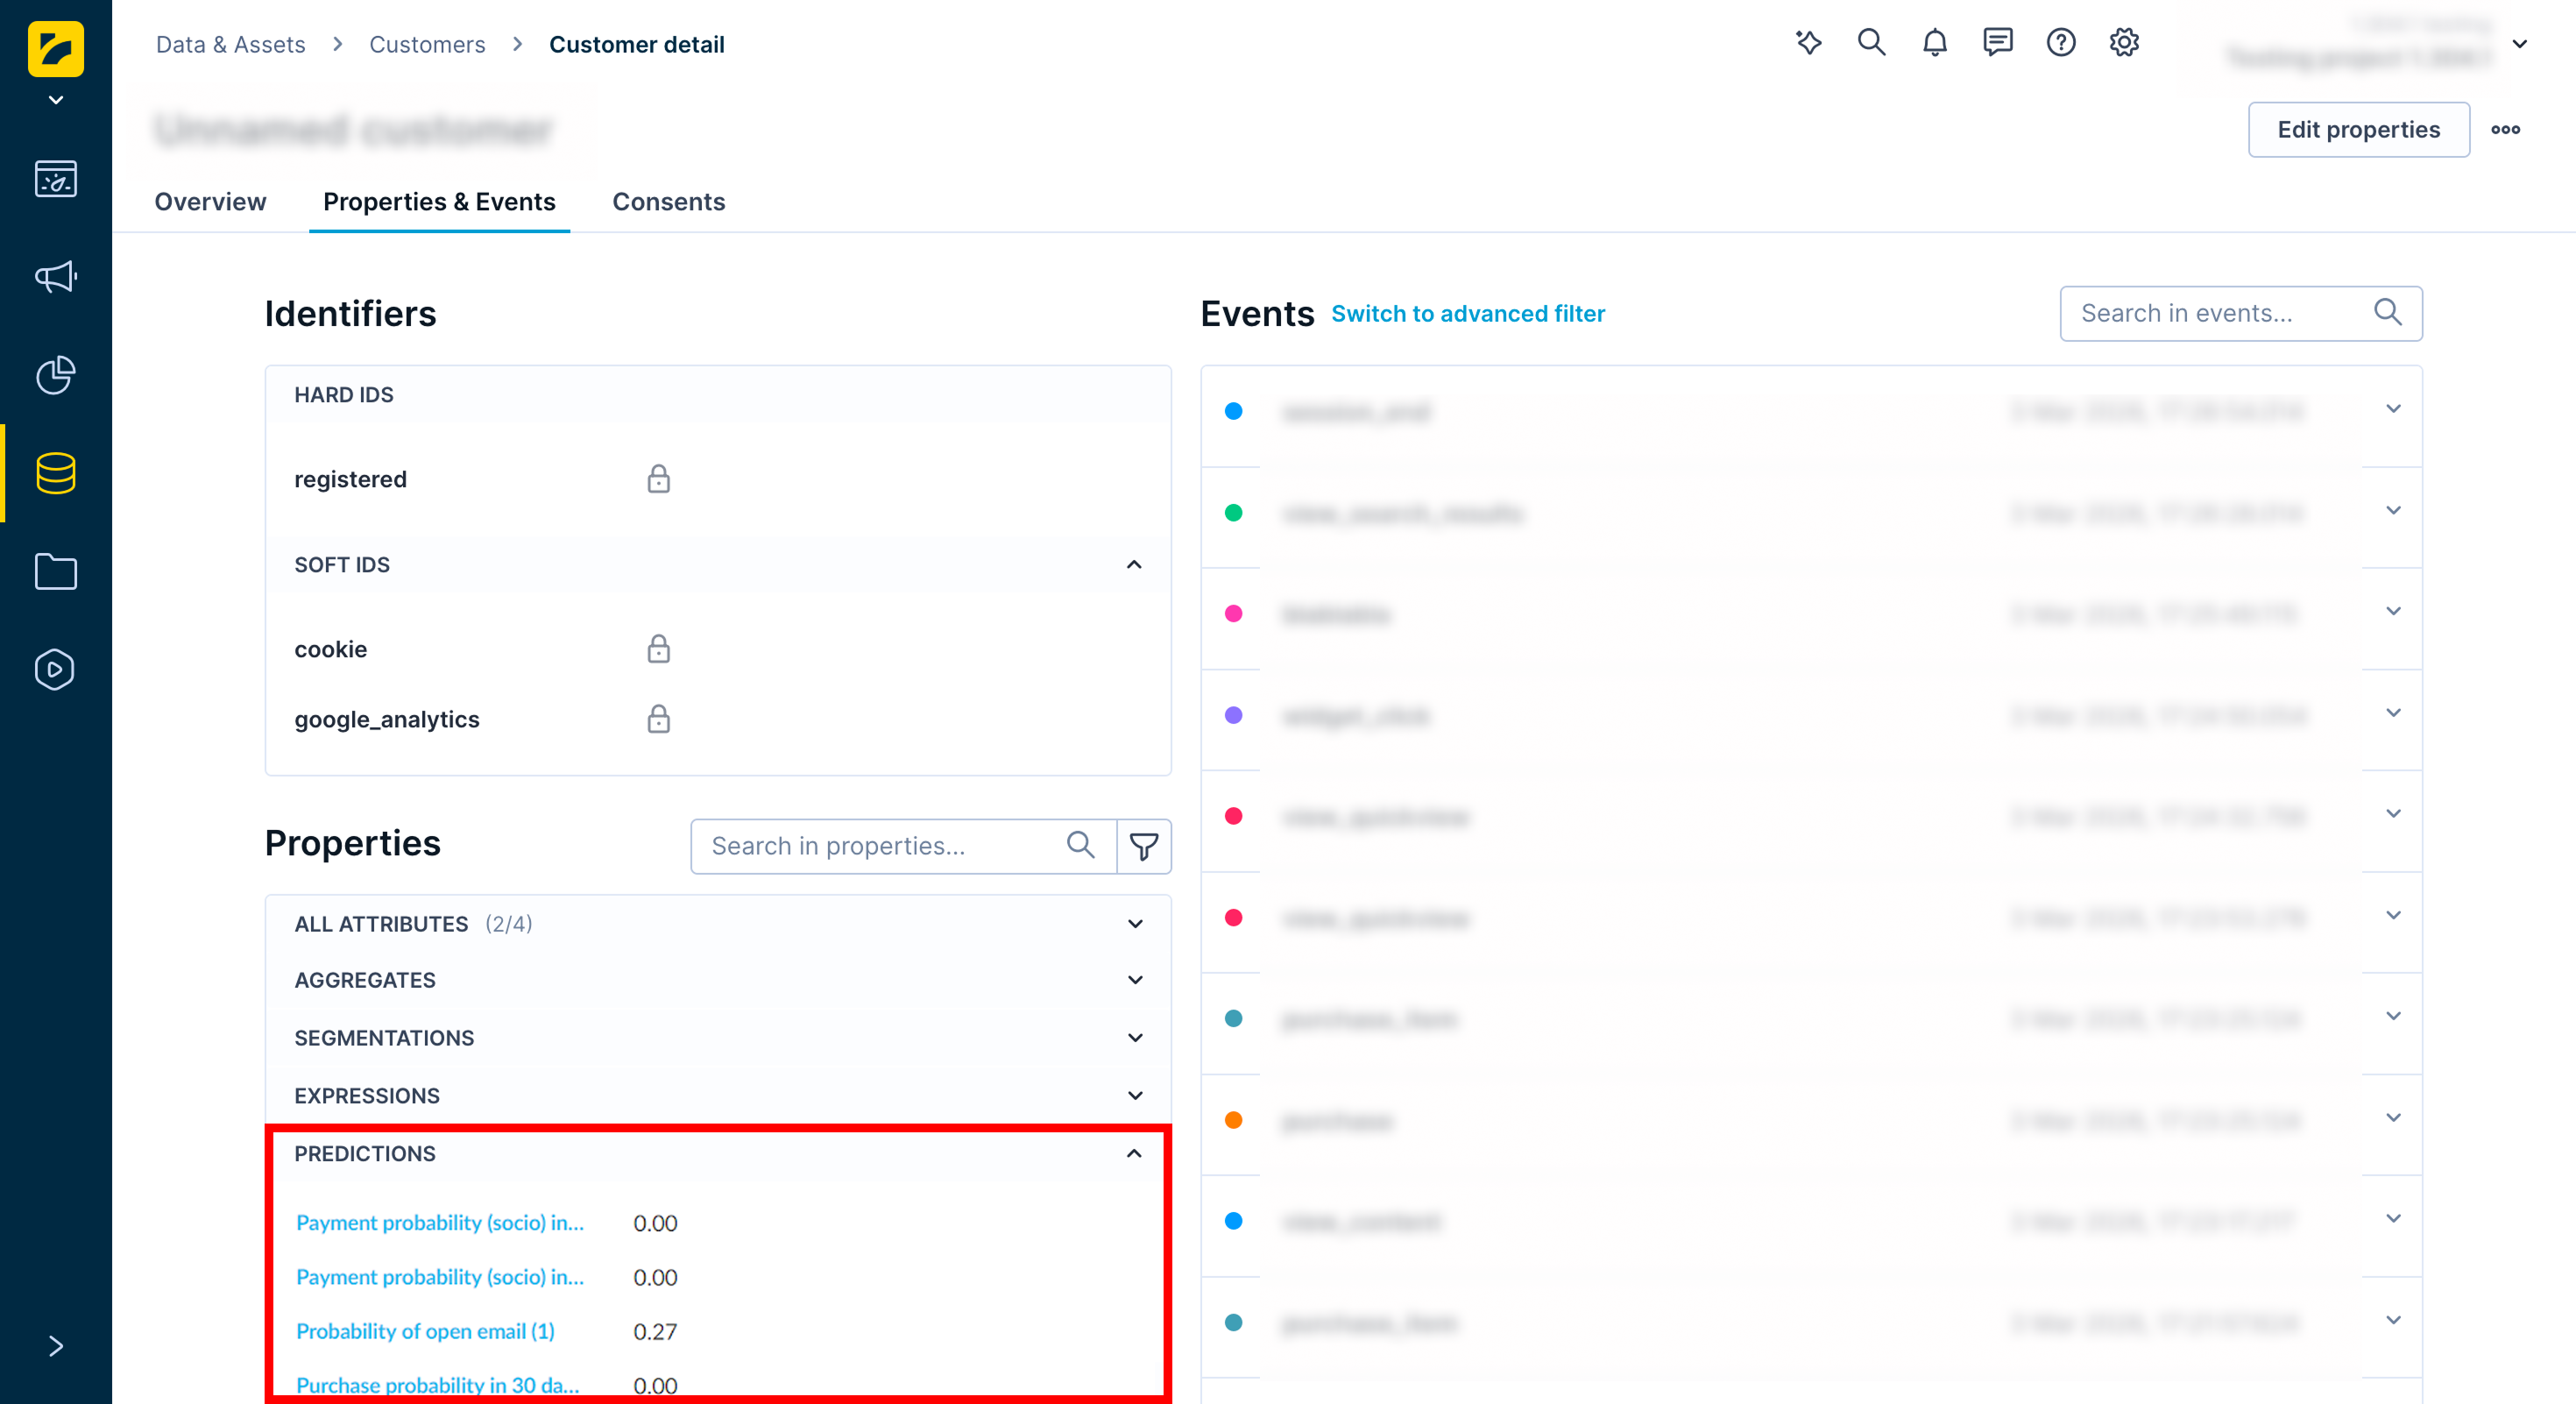
To view a specific customer's prediction scores:
- Go to Data & Assets > Customers.
- Select a customer.
- Under the Properties section, expand the Predictions dropdown.
Related articles
For setup guides, see Prediction templates and Custom predictions.
To understand and evaluate results, see Interpret prediction results and Evaluate predictions.
Updated 3 months ago