

Autosegments
Autosegmentation generates high-value segments that uncover hidden opportunities for marketers. Using AI to find unique combinations of customer properties and metrics, autosegmentation eliminates the need for manual data analysis and segment building.
Increase campaign conversions by targeting more valuable micro-segments, driving first-time or repeat purchases. You can also tailor campaign content and recommended products based on the qualitative insights about a segment provided by autosegments.
This is a Premium tier feature powered by Loomi AI.
Access autosegments
Autosegments is a premium feature. To get access, contact your Customer Success Manager.
How autosegments work
Loomi AI powers autosegments to generate potential segments from unique customer properties and metrics combinations. A visual, interactive chart presents these segments, supporting further exploration. Click into each segment for quantitative and qualitative insights, such as:
- Favorite category
- Average order value
- Revenue per visitor
You can then select the best segment and create it with a click for a personalized campaign.
You can use segments created using the autosegments feature like any audience segment within Bloomreach. For example, in:
- Scenarios
- Campaigns
- Reporting
Video guide
Watch this video to see the complete autosegments process from setup to campaign implementation.
Create autosegments
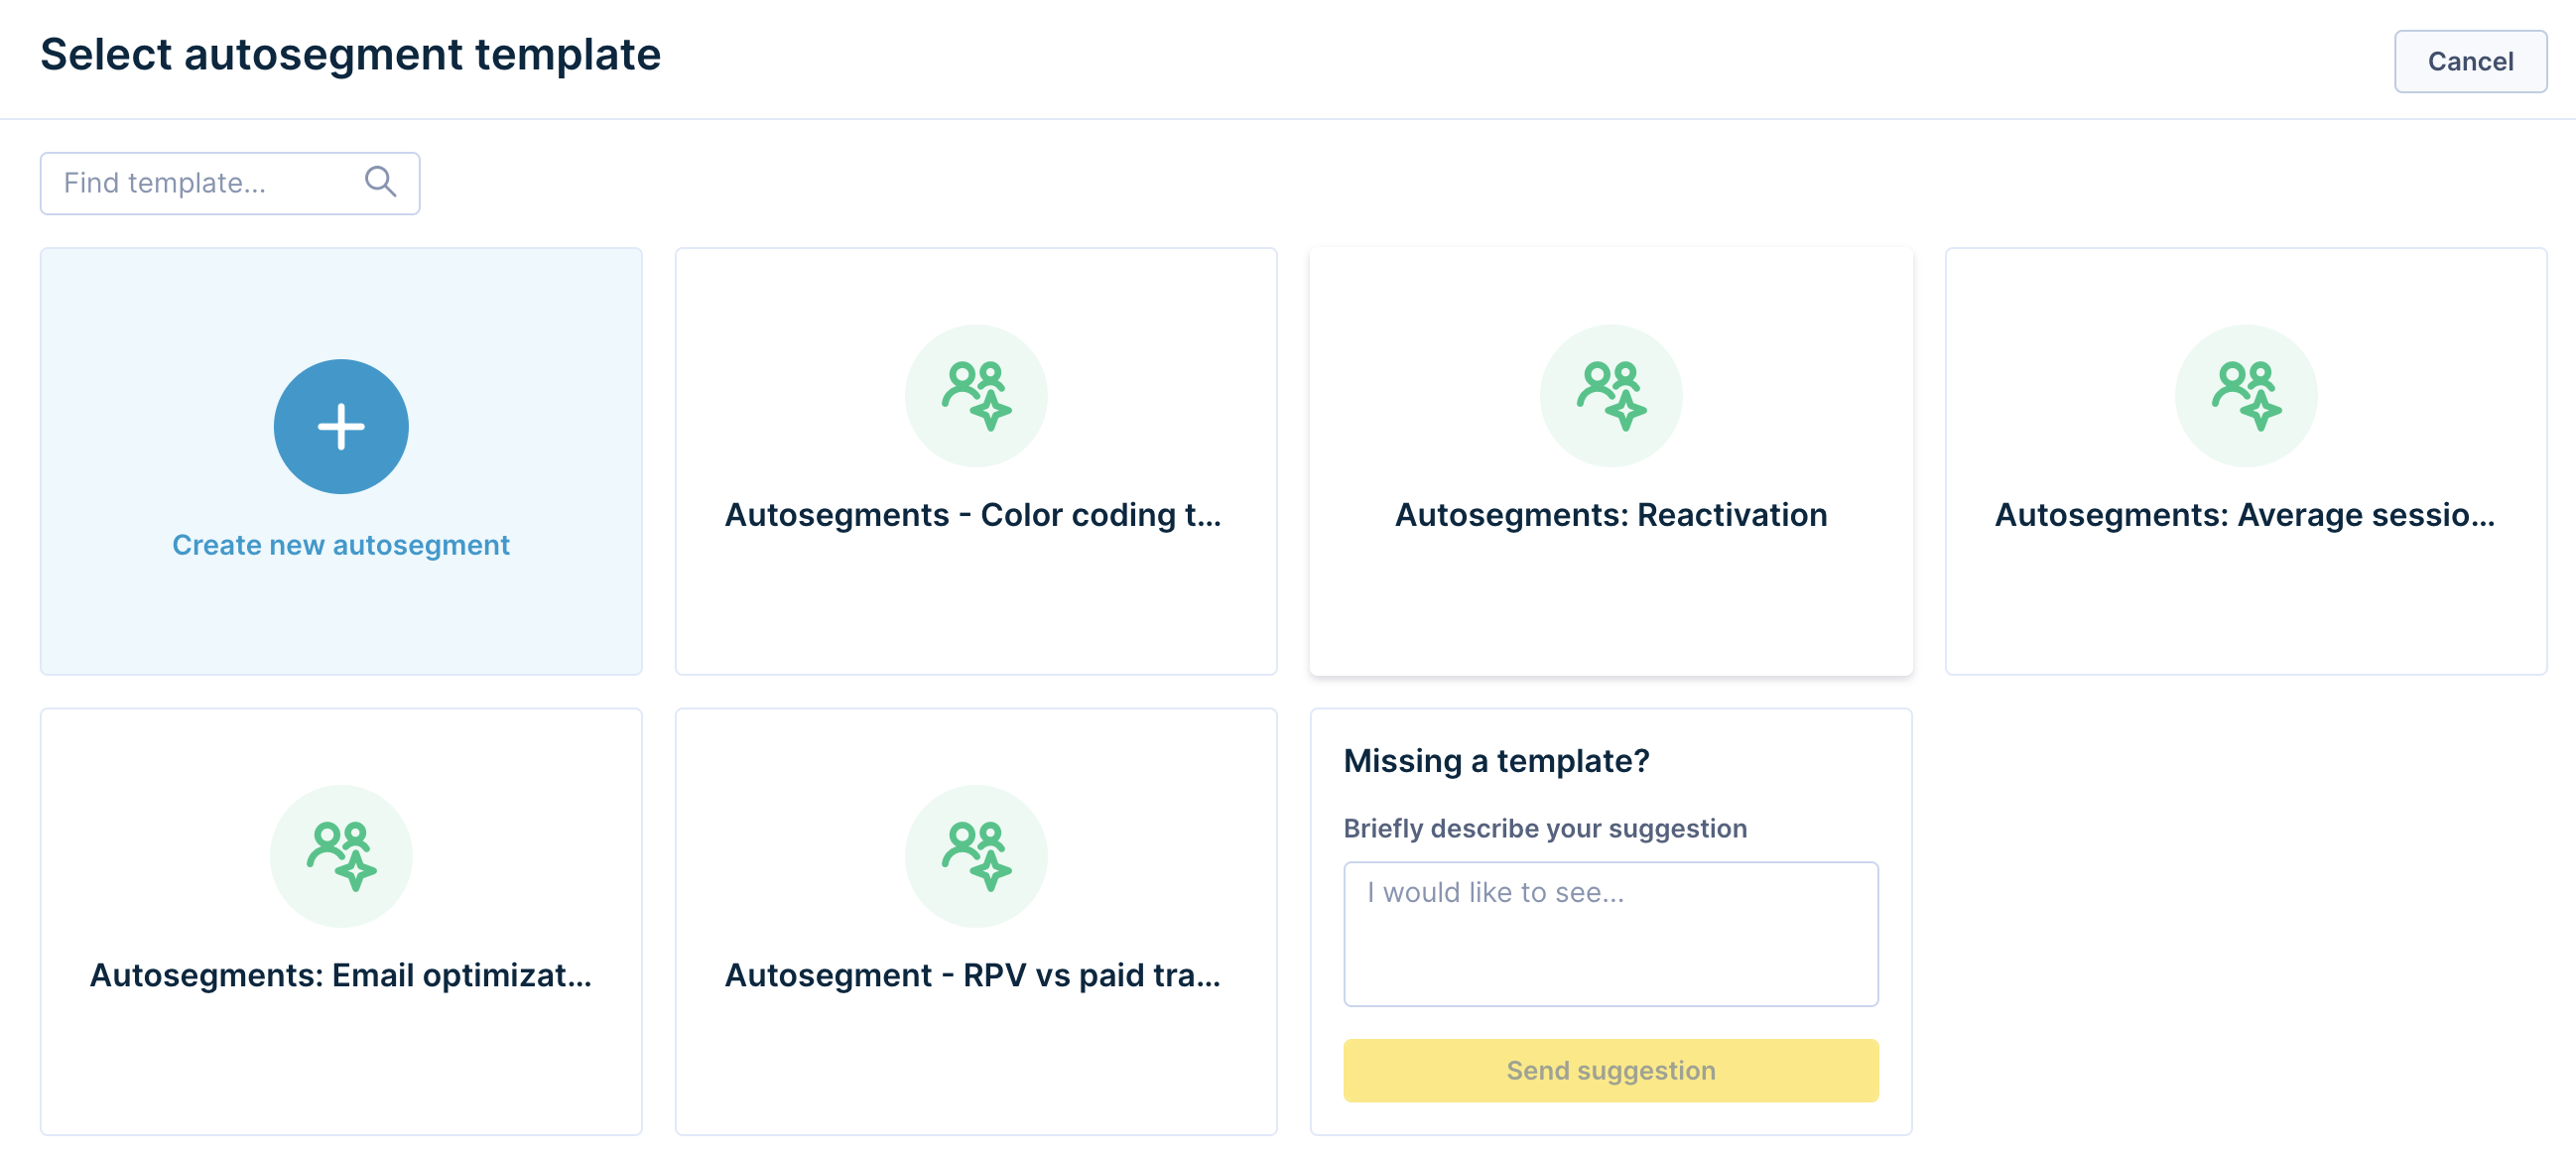
Go to Analyses > Autosegments and click New autosegment.
Choose a predefined template or create a new autosegment from scratch. If an important template is missing, leave feedback and let us know.
When you select an existing template, the user experience is similar to choosing a use case from the Use Case Center.
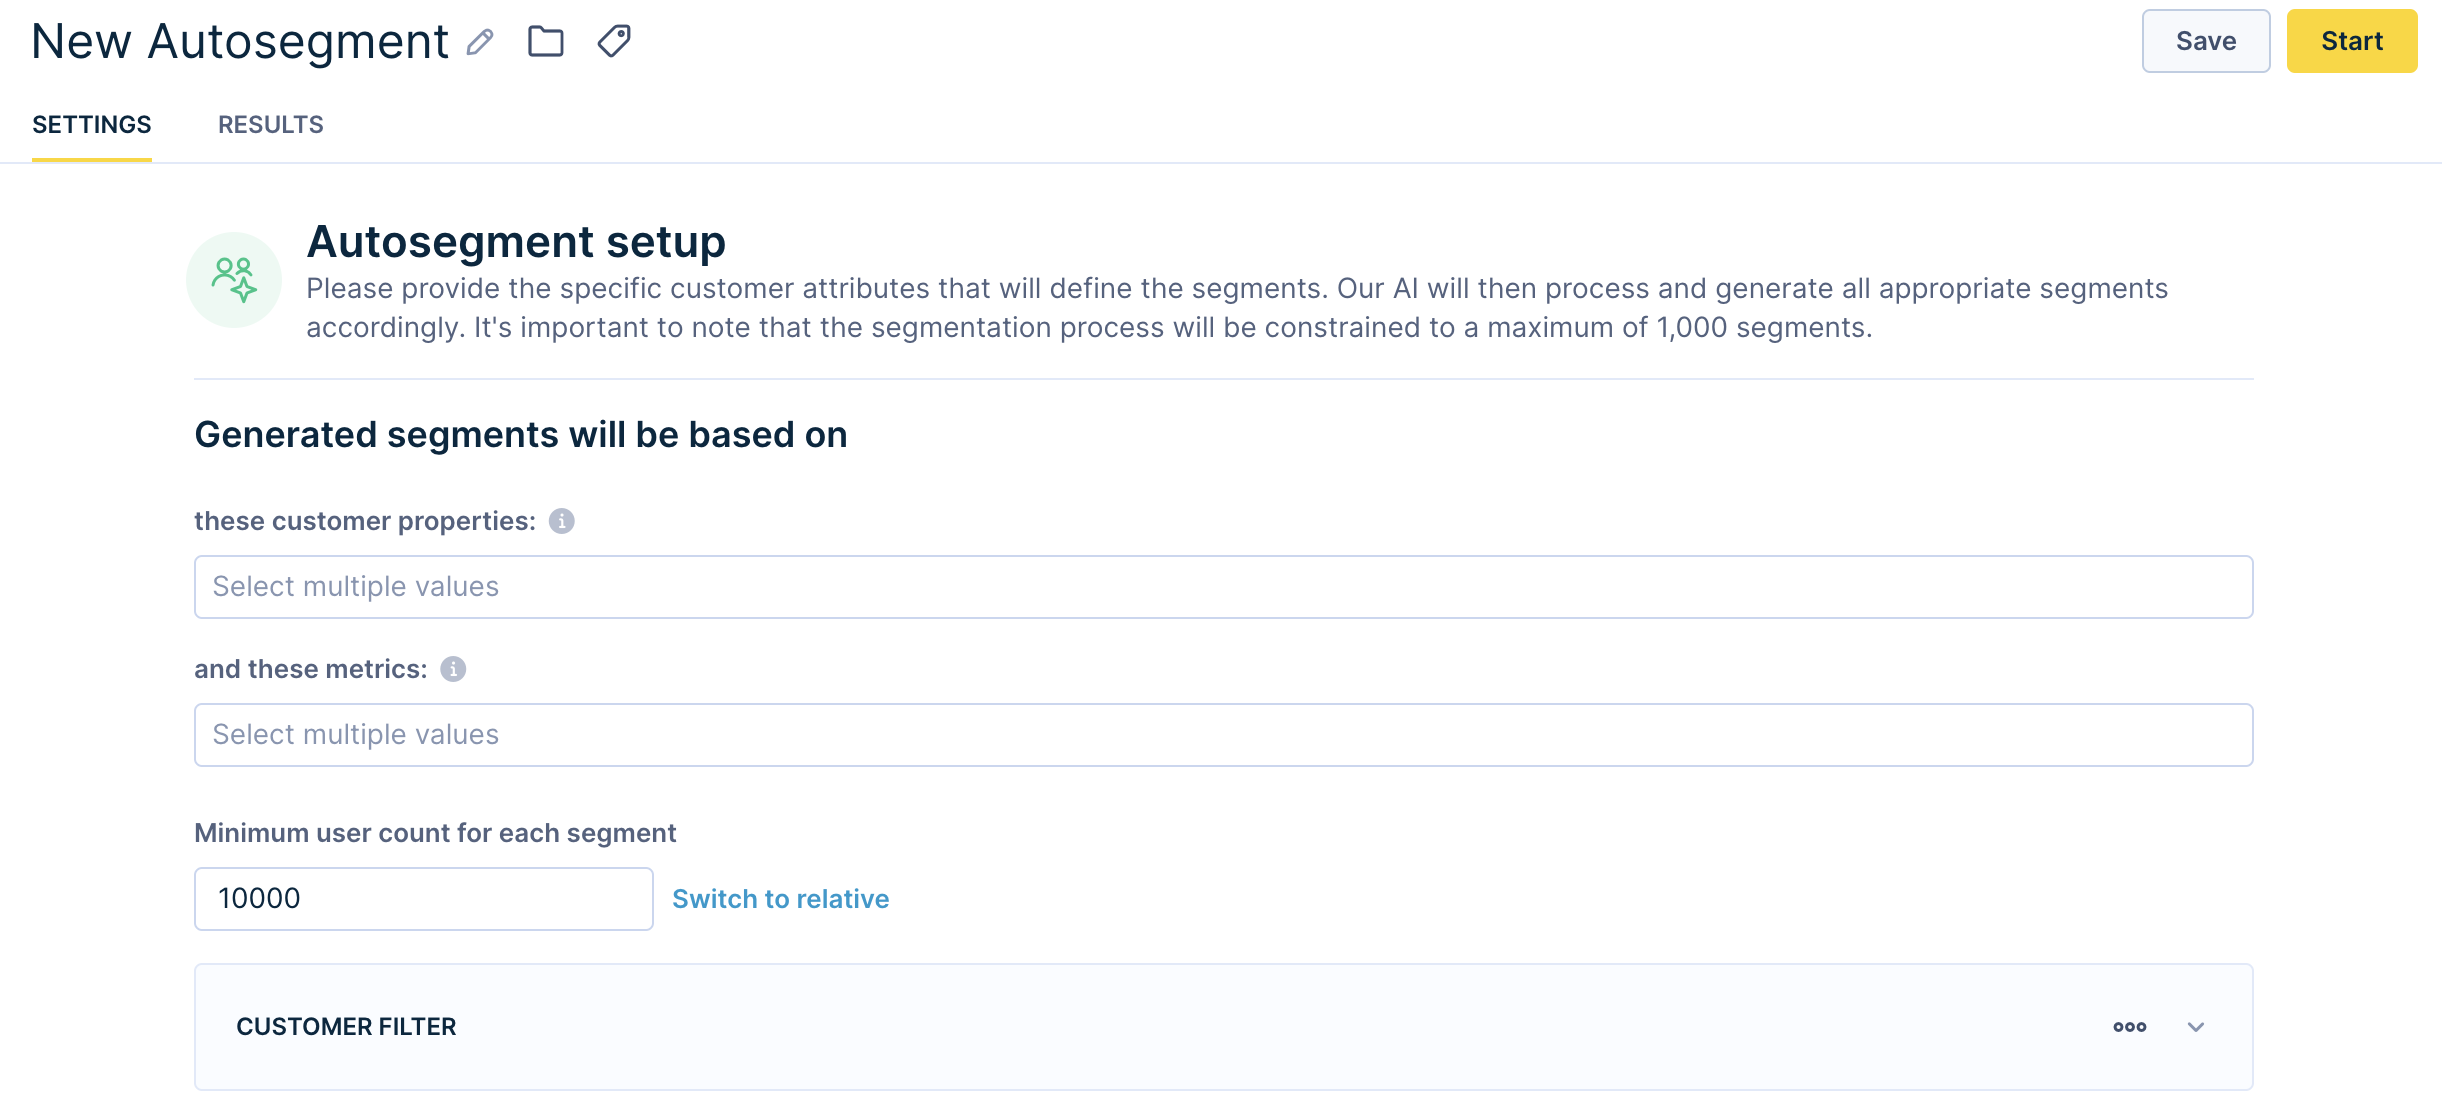
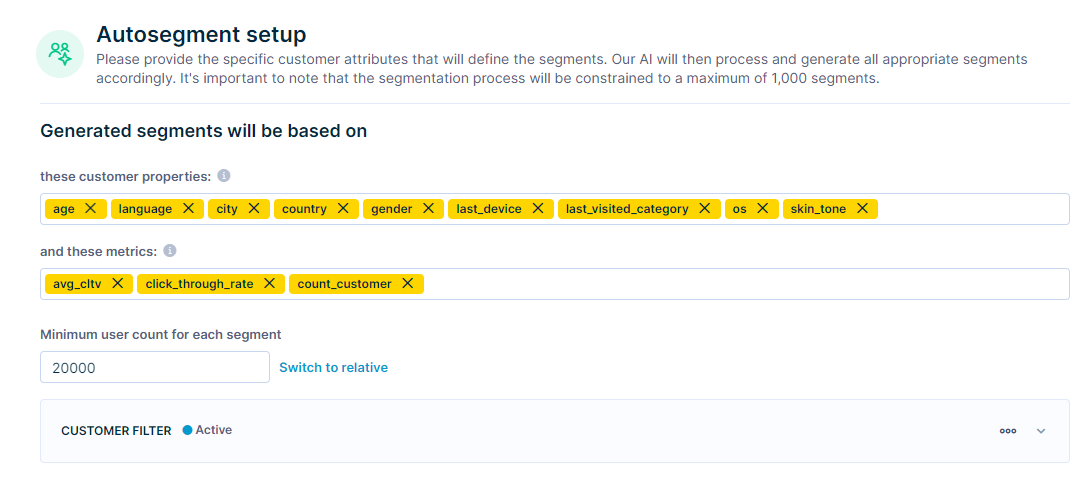
Define autosegment values
Select customer properties and metrics you wish our AI to base the autosegments on. You need to input a minimum of 1 customer property and a minimum of 2 metrics. You can use a maximum of:
- 20 properties
- 10 metrics
- 5,000 segments - if more segments are generated, a random subset is returned
- Last 6 months of data
Each segment in the autosegments feature operates independently, allowing for the evaluation of all property and filter combinations. A single user can belong to multiple segments, as they aren't mutually exclusive.
For example, a calculated autosegment might produce over 500 segments. Each of the 500 segments could have common users, allowing each segment to share unique combinations of properties and metrics.
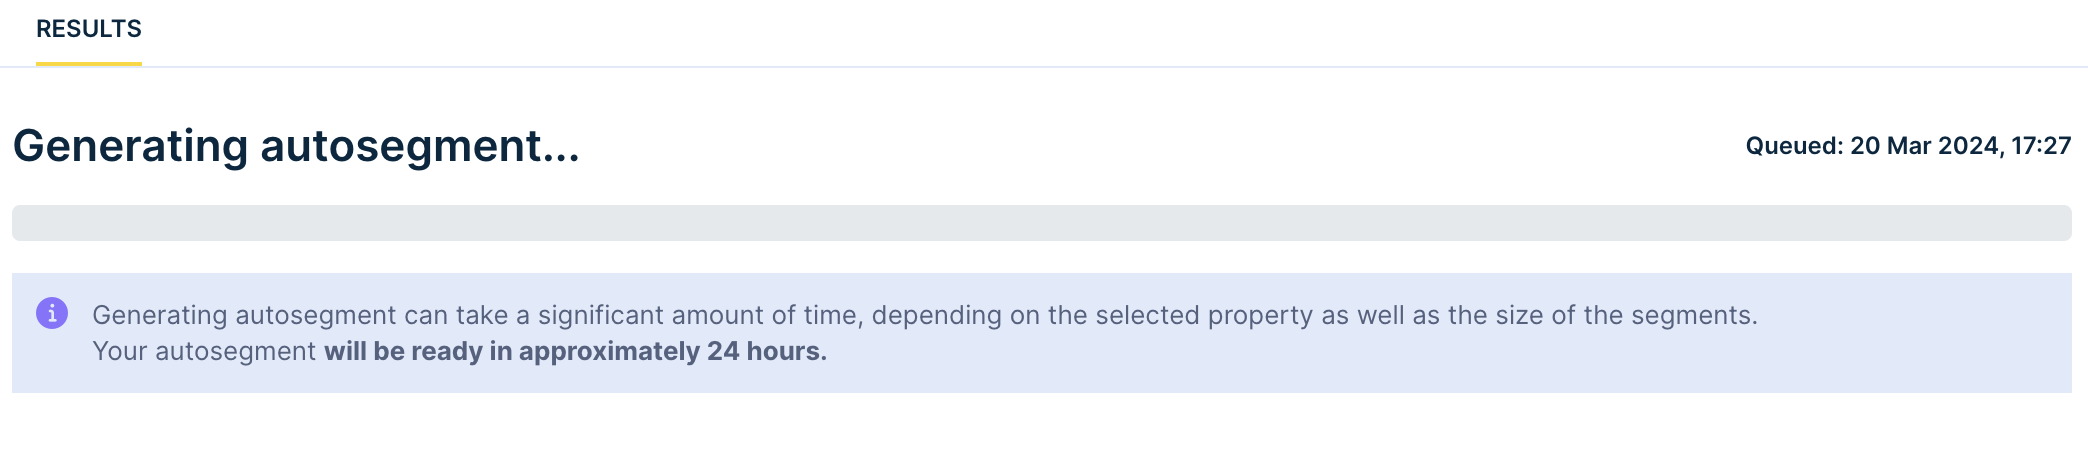
Generate autosegments
Click Save and then Start to generate an autosegment. You can monitor the process in the Results tab. It can take up to 24 hours to generate your autosegment. You can close the Results tab and access the generated autosegment later. Metrics are calculated while running the autosegment and are not updated in real time when viewing results.
Analyze autosegment results
Once the autosegment is generated, view results in the Results tab.
The results are presented as a table of segments.
Choose the metric to display on the x-axis or y-axis to sort the table. For example, you can set the conversion rate metric as the x-axis and the click-through rate metric as the y-axis.
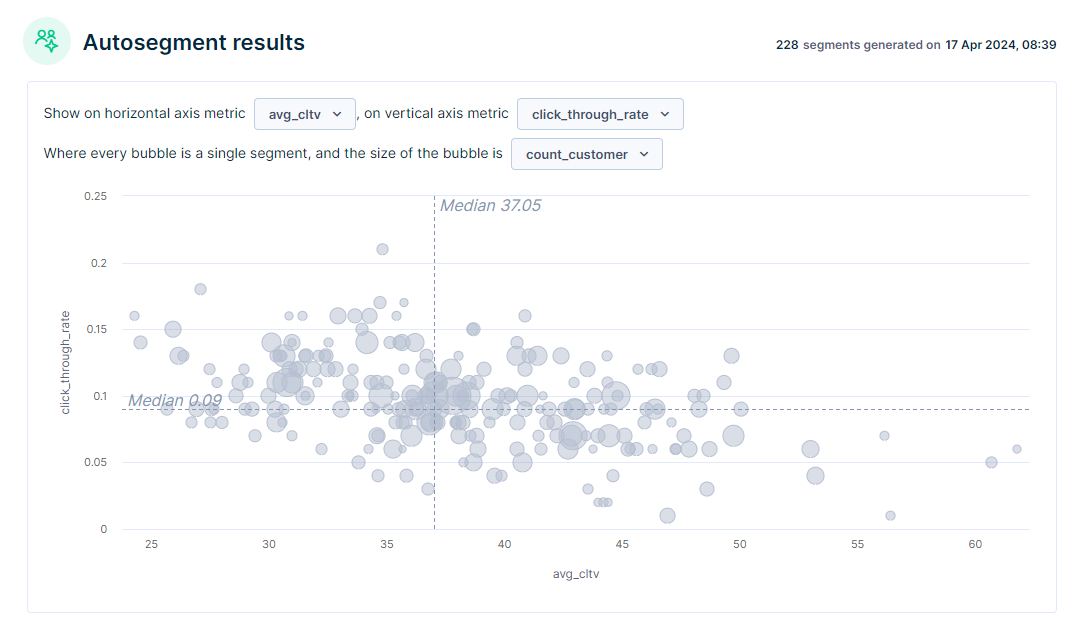
If there are too many segments and you want to filter out a few, you can exclude segments from the graph that do not meet certain metric criteria. For example, you can filter out segments that do not have a click-through rate above 20%. Do this using the Value Filter setting at the bottom of the table.
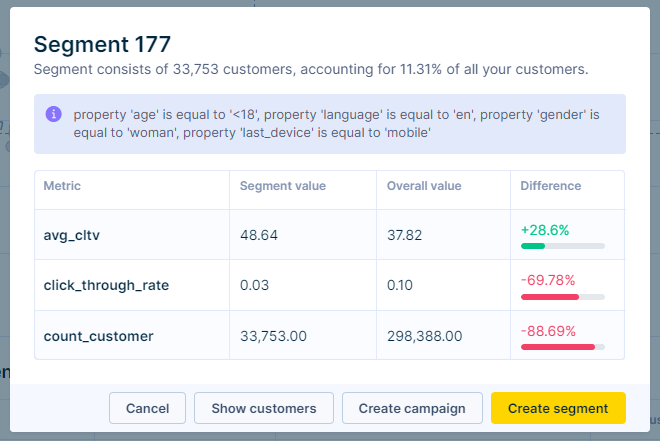
Click any segment in the table or diagram to open a modal window with the segment details, including:
- Segment name
- Segment description: Detail about used properties and values, portion from all customers (100% of customers is the number of customers after applying the customer filter from the setup screen)
- Metrics for the specific segment compared to overall project performance
- Action button: Create a segment, which opens a new segmentation definition based on the selected segment
How to read the results
Metrics in the segment table present values for the entire customer base within a particular segment. For example, the average customer lifetime value (LTV) in the table above (avg_cltv = 48.64) demonstrates the value of the whole customer base within Segment 177 (averaging the LTV of 33,753 customers), not the value for each individual customer.
- Property: Has bought before? = No
- Property: Acquired email from TikTok influencer campaign
- Property: skin shade = dark
- Metric: CTR on overall email campaign = 2%
- Metric: CTR on educational email = 60%
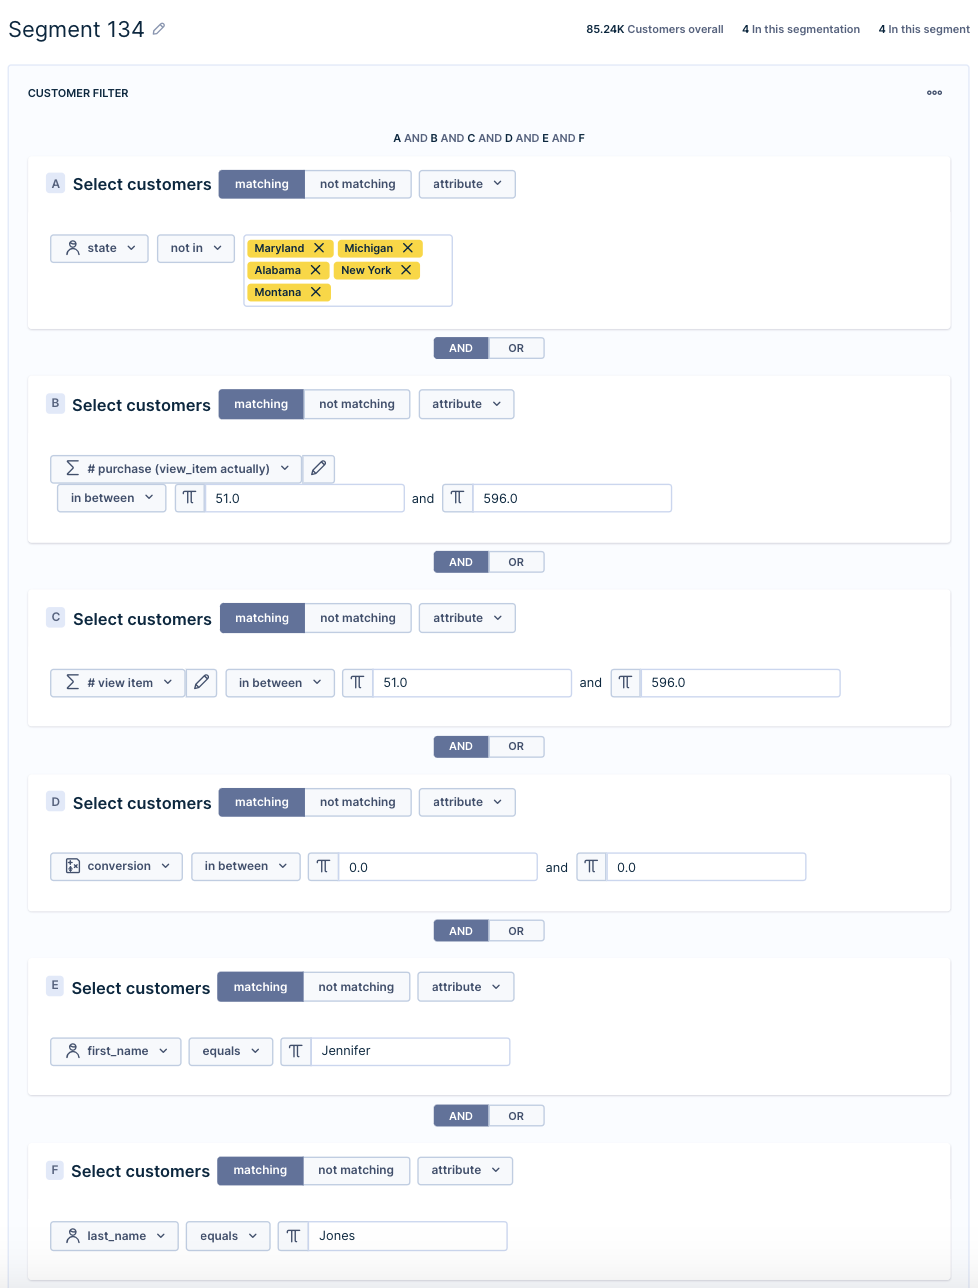
Take action with this segment
Choose the segments that you find useful and create a new segmentation. Use this segmentation to personalize marketing campaigns or optimize your product offerings. Apply this segment in reporting, dashboards, and other analyses.
Limitations
- Number of properties: 20
- Number of metrics: 10
- Number of segments: 5,000. If more segments are generated, a random subset is returned.
- Number of considered events: 1,000 million (if more events are used, they are undersampled to 1,000 million)
- Number of considered customers: 50 million (if more customers are considered, they are undersampled to 50 million)
- Max history of considered events: 6 months
- Consent as a customer property is not currently supported
- Only segments that meet the defined 'Minimum user count for each segment' are returned.
Segments and metrics are calculated once from long-term data storage and are not updated until autosegments are run again. This data storage is updated every 6 hours. As a result, there may be small differences between segments calculated from autosegments and those from the real-time data storage used by standard Segmentation.
When you save a segment from autosegments as a standard Segmentation, it is recalculated in real time. For example, an Autosegment may initially identify 1,000 users, but when applied in a campaign, the real-time calculation using the same criteria may result in 1,500 users.
Autosegments FAQ
Read the Autosegments FAQ to find answers to common questions about autosegments. Learn how to create and improve autosegments for better customer engagement and marketing results.
Autosegments in marketing campaigns
Try autosegments in the following use cases.
Optimize low-performing segments
In a given email campaign or scenario, a brand might show different kinds of content. For example:
- Product-specific images
- Educational content about how to use the product
- Flash sales
After the email flow is over, you can find low-performing segments and remove them from the “overall” campaign. Review insights about the low-performing segments and retarget them with new content.
For example, a cosmetics company finds that a subsegment of users likes the educational content and has never bought a product before. These users might want to know how to use the product before buying it. You can use other insights to deliver educational content based on customer data.
Example autosegment dimensions
- Property: Has bought before? = No
- Property: Acquired email from TikTok influencer campaign
- Property: Skin Shade = dark
- Metric: CTR on overall email campaign = 2%
- Metric: CTR on educational email = 60%
Optimize customer targeting
A common best practice is to target high LTV customers, assuming this group has a propensity to buy again due to their history of multiple or large purchases. While this is a valid assumption, repeatedly targeting the same high LTV group can lead to diminishing returns over time. To address this, you can:
- Find a subsegment within the overall group of high LTV customers.
- Use a different metric that indicates a propensity for high LTV.
If you choose the first option, use autosegments to identify a subsegment with the following example dimensions. This subsegment is particularly valuable: their LTV is higher than average, they are likely to make a purchase soon, and they last bought more than 90 days ago. This makes them eligible for items that need replenishment or updating, such as seasonal products. Target this subsegment with messaging about returning to the brand and offer a conditional promotion if the customer buys 3 or more items.
Example autosegment dimensions
- Property: LTV = $4000 (155% higher than average)
- Property: Purchase Prediction = 75%
- Property: Last Date Bought = +90 days
- Property: Average Products Bought = 3
- Metric: Add to Cart Rate = 95%
- Metric: Bounce Rate = 12%
Recommend particular brands
Deliver a product recommendation to users via email, on mobile devices, featuring Nike products that cost more than USD 40 and available to customers in the US. Identify users with a high affinity for a specific product category, primarily engaged via email, have a high AOV, and are located in the NYC area.
In this case, include specific Nike products that are more expensive but likely to convert at a higher rate, resulting in incrementally higher revenue.
Example autosegment dimensions
- Property: favorite brand = Nike
- Property: last category bought = shoes
- Property: favorite channel = mobile
- Property: location = NYC
- Metric: Add to Cart Rate = 55%
Refine Ad audiences
As an acquisition marketer, you send valuable segments to social platforms like Facebook or TikTok, allowing them to find potential customers who resemble the given “seed” set. Often, you might build lookalike audiences based on a single dimension, such as LTV.
Instead, you can enhance the AI engines of the ad platforms by providing a more specific audience to target. For example, you might send one with the following example dimensions rather than just sending a segment with a high LTV.
Example autosegment dimensions
- Property: LTV = $4000
- Property: AOV = $200
- Metric: Bounce Rate = 2% (400% lower than average)
- Metric: Conversion Rate = 40%
This approach allows for more precise targeting and better campaign performance.
Optimize retargeting strategy
As an acquisition marketer, you create prospecting ads that drive traffic to your website or app. Some users will engage by viewing products or adding items to their carts.
You can identify a subsegment from this group that is most likely to purchase. You can then bid more for this audience and retarget them, bringing them back to the app to convert.
Example autosegment dimensions
- Property: First touch source = Facebook
- Property: In-session Prediction (Likelihood to purchase = 85%)
- Property: First-time buyer
- Property: # of organic revisits = 3
- Metric: Viewed Product = 2
- Metric: Bounce Rate = 5%
Optimize re-engagement
As a CRO manager, you care about your high-value customers. Personalizing the message is difficult without specific knowledge about a segment. With autosegments, you can analyze the high-value customers who are at risk to gain a better understanding of specific subsegments.
Example autosegment dimensions
- Property: most visited category - shoes
- Property: preferred brand - Adidas
- Channel preference - email
- Metric: CLTV - USD 156 (top 10%)
- Metric: time since last purchase > 60 days
Updated 3 months ago