

Purchase frequency segmentation
What is a purchase frequency segmentation
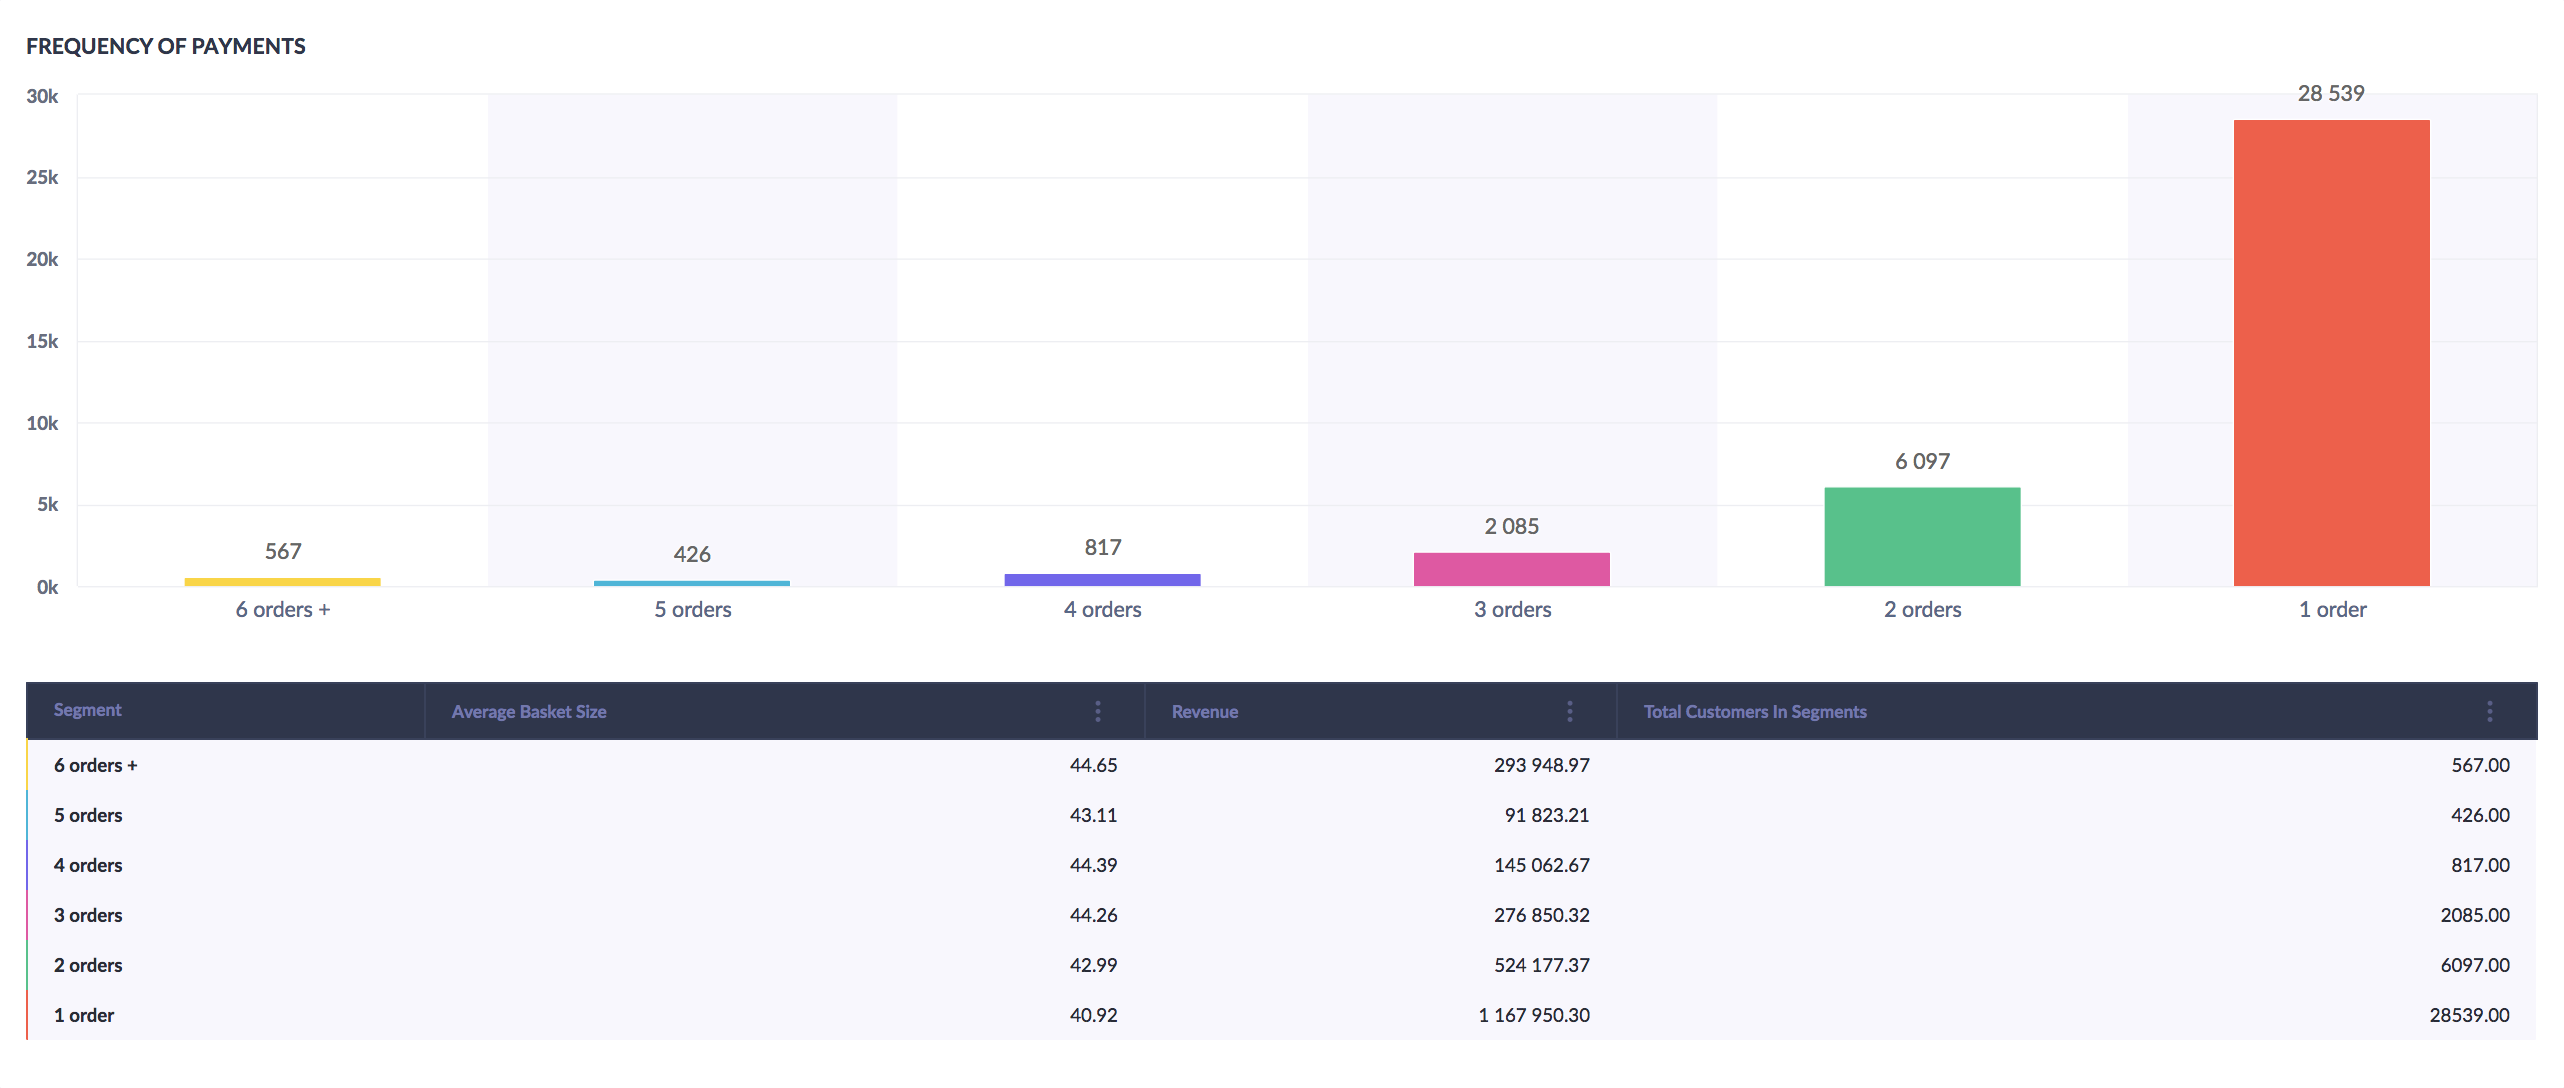
The purchase frequency segmentation is an analysis providing an overview that breaks down your customer base by the number of orders they made during a specific period of time.
This analysis creates groups of customers using the number of purchases as the differentiating factor.
All these insights will help you understand the buying habits and monetary base of your customers.
Why you should use it
In addition to the number of purchases made by your customers, this analysis allows you to deep dive into other data, like average basket size and total revenue per segment. Multiple analytical inputs will then enable you to improve your online marketing campaigns.
The average basket size provides you with monetary data (i.e. what is the average amount of money your customers spend per one purchase). Having this information, you can easily distinguish between segments containing high-value customers.
Imagine you have a segment of customers who made 4 purchases during 3 months. On the other side, you have a segment of customers who only made 3 purchases during the same period.
Which one is more valuable? There are multiple perspectives of how to evaluate the profitability of various customer segments. They can be evaluated from the retention perspective but also from the revenue-generating ability.
The additional data (e.g. the average basket size or total revenue per segment) can help you compare the monetary value of each of the segments.
All of these insights will help you better understand the buying habits of your customers.
Insights
Since the retention to next purchase is very high after 3rd or 4th purchase, you can decide to exclude some of the highly engaged customers from certain campaigns, not to spam them or unnecessarily incentivize them with vouchers.
How to create a purchase frequency segmentation in Bloomreach
Firstly, this analysis requires an event aggregate. Create a running aggregate counting the purchases as shown in the picture below.
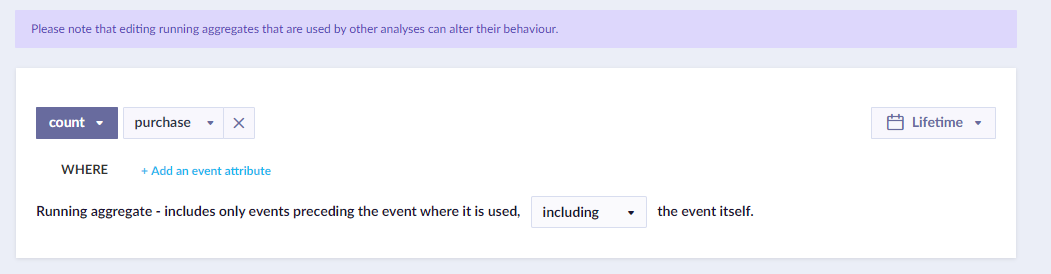
You can name the aggregate # purchases
Afterwards, go to Segmentations and create a new segmentation.
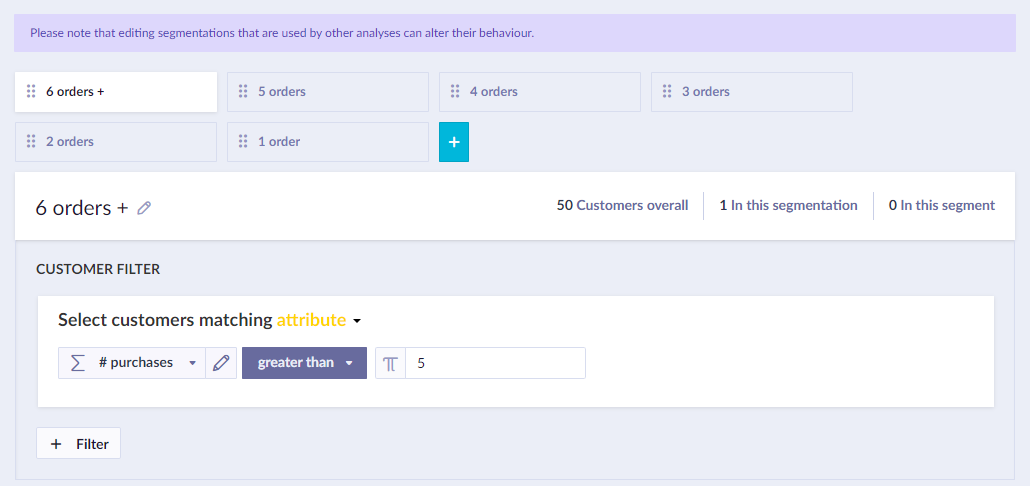
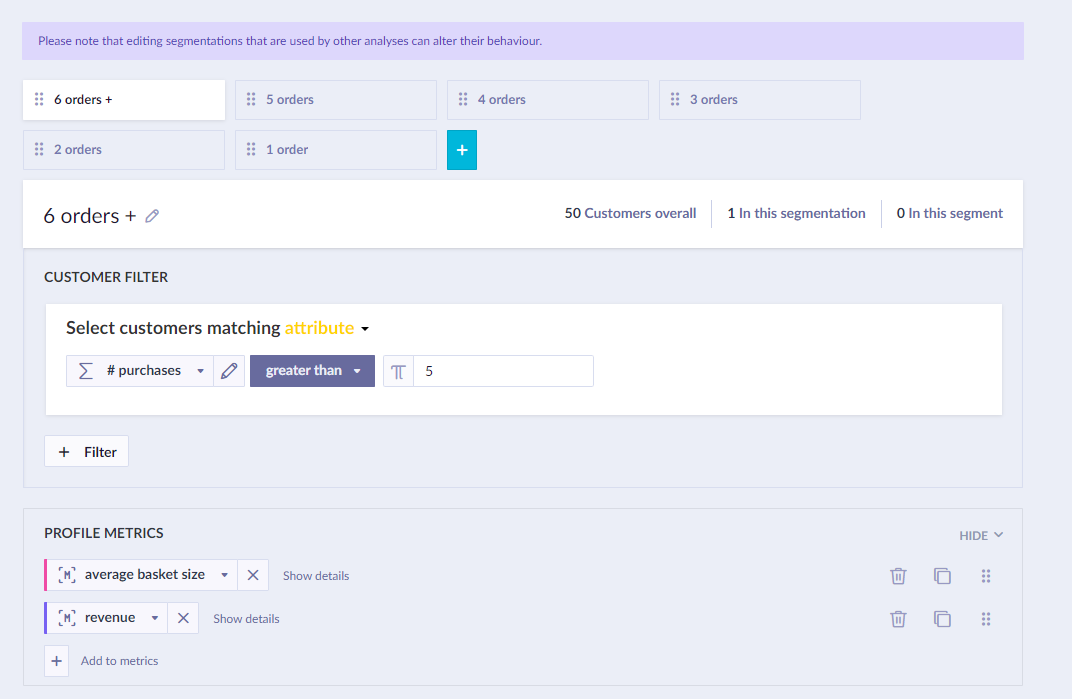
Create 6 segments based on the number of purchases made by the customer. Use the running aggregate created beforehand as displayed on the pictures below.
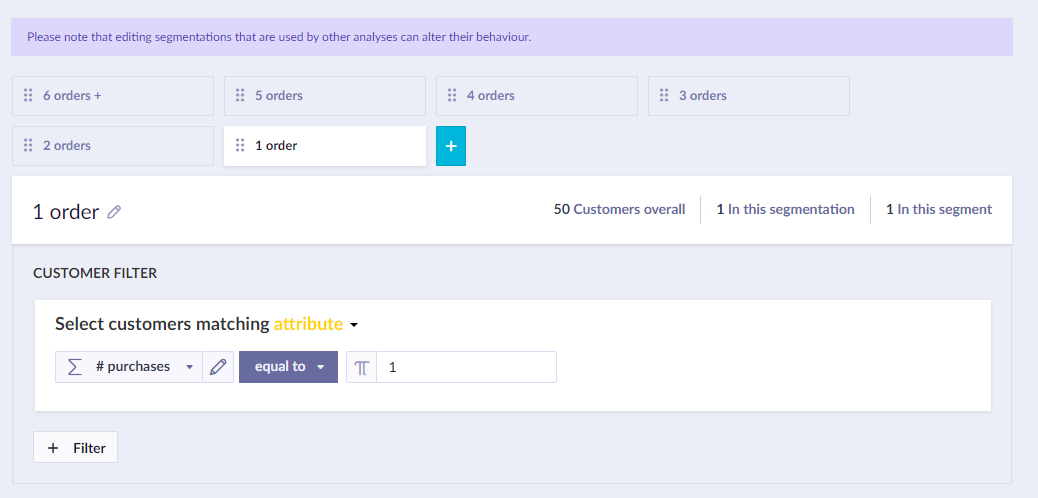
Start with the first one and work your way up to the sixth segment using the same principle.
Now, you may add metrics further improving the analysis from this segmentation.
Let's use two metrics: "average basket size" and "revenue" of the customer.
Add the first metric as shown in the picture below.
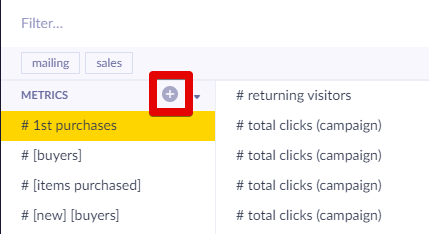
You will probably need to create it on your own by clicking on the "plus" button.
Now, name your metric, select its type as Formula and set the format to your currency.
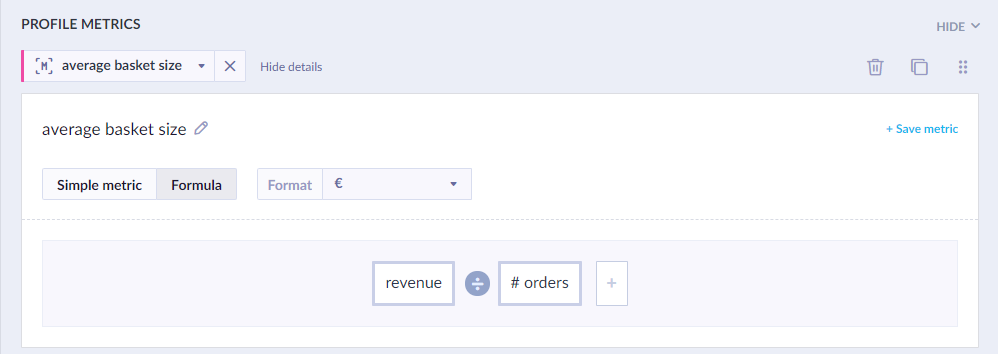
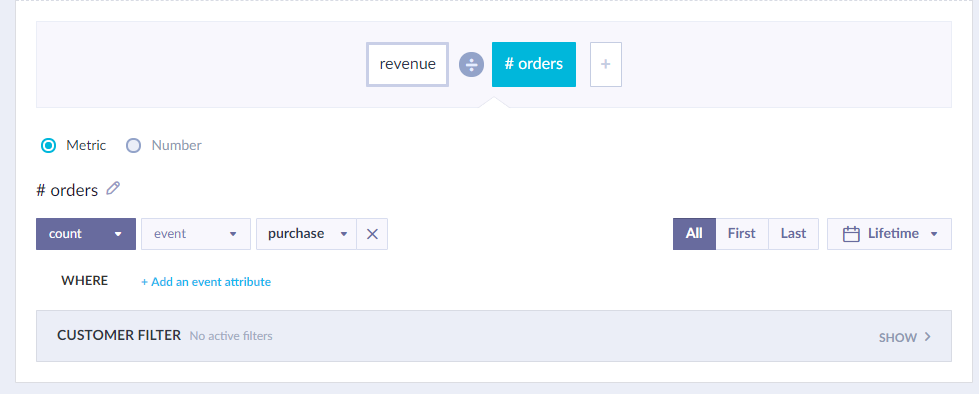
In order to create the formula, you will need to divide revenue and # orders. Here is how to construct the formula.
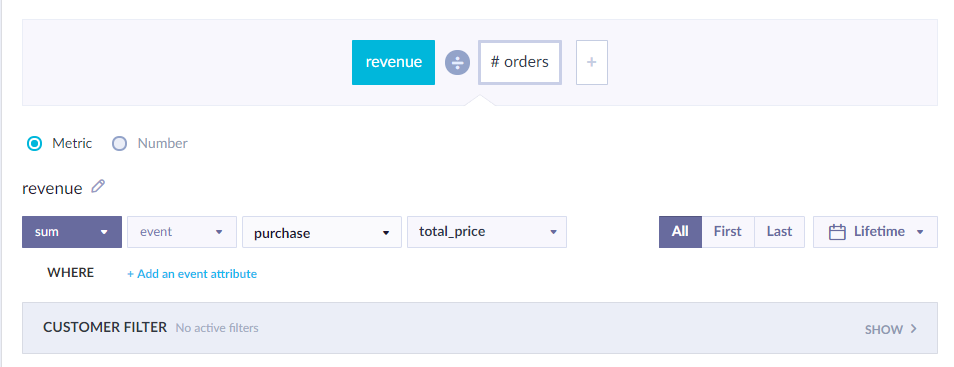
revenue
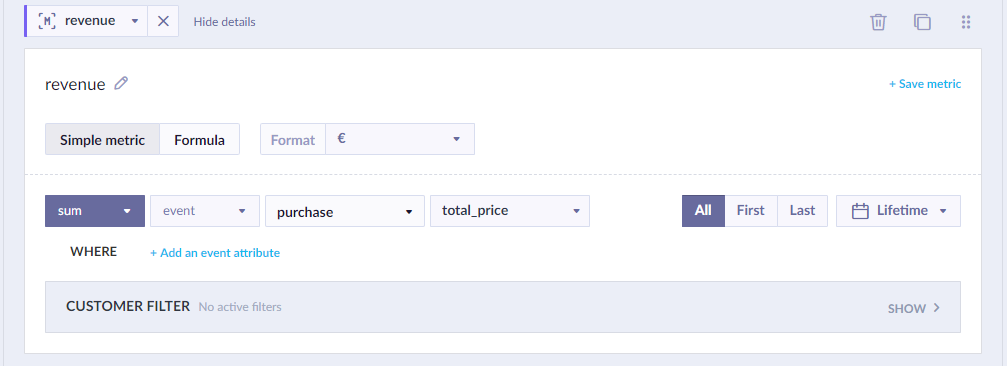
Now, using the same method, create a second metric, which will display the revenue of the customer.
Again, you will probably need to create it from scratch. However, after naming the metric, now instead of Formula select Simple metric. Then construct it as shown in the picture below.
After creating the second metric, you now have a full purchase frequency segmentation including 2 metrics and consisting of 6 segments.
Updated 2 days ago