

SQL reports
This guide introduces you to SQL reports.
SQL reports is an analytical tool that enables you to create, edit, or view a report using data from third-party data sources that are written in SQL query or visual mode. It allows you to select data from a database for which you created an integration in your project (for example, a Google BigQuery or MS SQL database) and create a report based on that data.
ImportantThis feature is currently available in the BETA version, but we are working on its improvement.
When to use SQL reports
- Display data from the third-party data sources in the SQL reporter by writing a custom SQL query.
- Use data from Engagement BigQuery, and make a report out of it through the SQL reports feature.
- Write a SQL query in a more flexible editor and then just display the results in Bloomreach.
How to create a SQL report
- Navigate to Analysis > SQL reports.
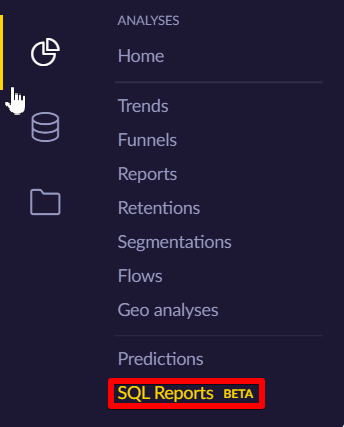
Navigate to SQL reports
- Click on the + or +New SQL report.
- You now see a new SQL editor. As a data source, choose one of your SQL integrations to use data from and click on the Load data model. Loading the data might take a few seconds.
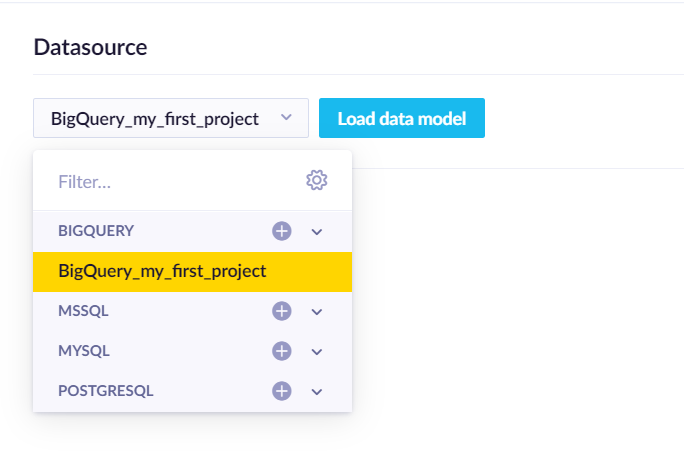
Select a data source in the SQL editor
- Choose either Visual mode or SQL mode according to your preferences.
- Don't forget to click on the Save button when done.
If you want to display your final results, you have two options to do so:
- In the SQL report library, directly click on the particular SQL report, and when it opens, you can view the results.
- Through the dashboard:
- Go to My dashboards from the side menu.
- Either edit an already existing dashboard or create a new one.
- Add SQL report node to your dashboard.
- Select the SQL report to display.
- After clicking the Save button, the final report results are added to the dashboard for viewing.
SQL report modes
Visual mode
Visual mode works the same way as standard reports. There are rows, columns, and metrics in order to create a report. It helps with a better visualization of raw data. You can summarize the data in a grid table or a chart. Learn more about how standard reports work.
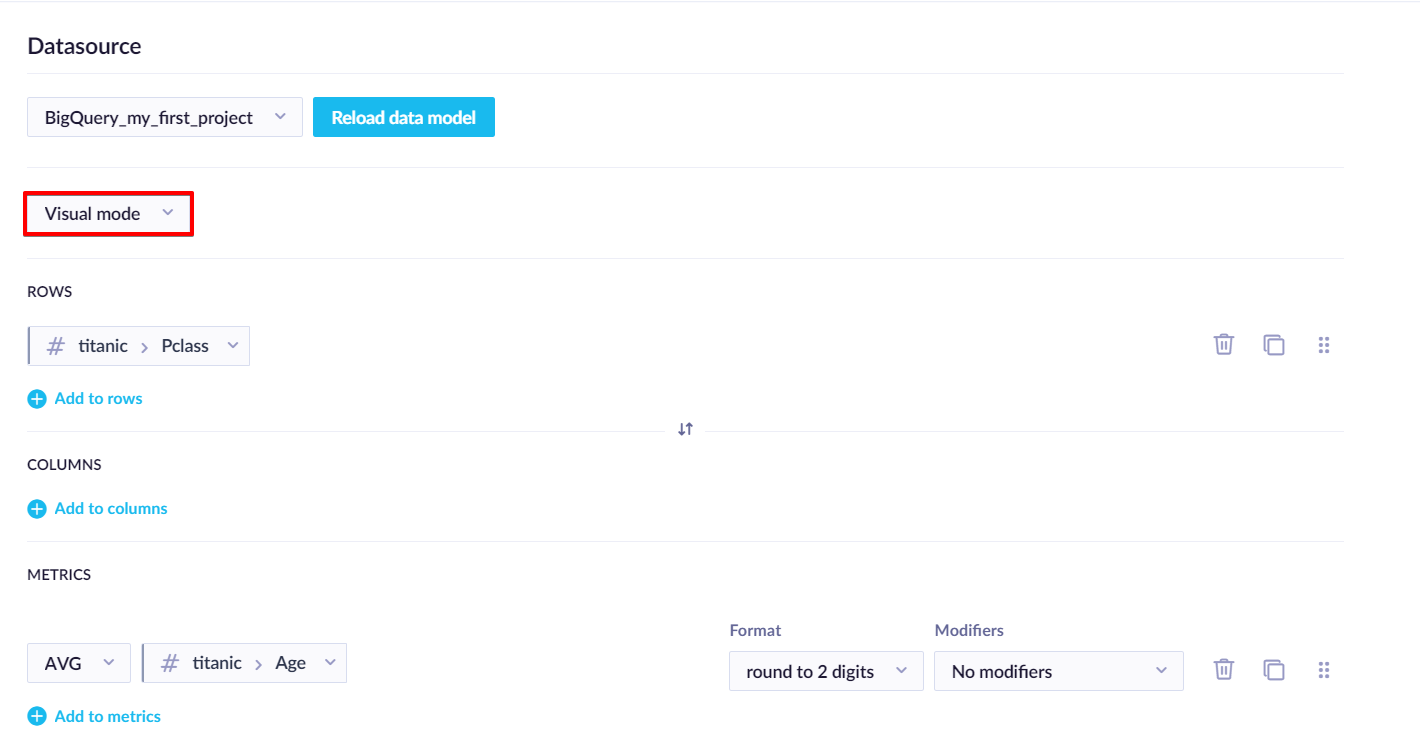
An example SQL report displayed in Visual mode
SQL mode
In SQL mode, there is an available side column with available tables to query on, loaded for selected data sources. After clicking on the table, all available columns for the current table are displayed, also with their column type (number, string, ...). You can paste the name of a column/table by clicking on the plus sign next to the name of the table/column (visible when hovering over it).
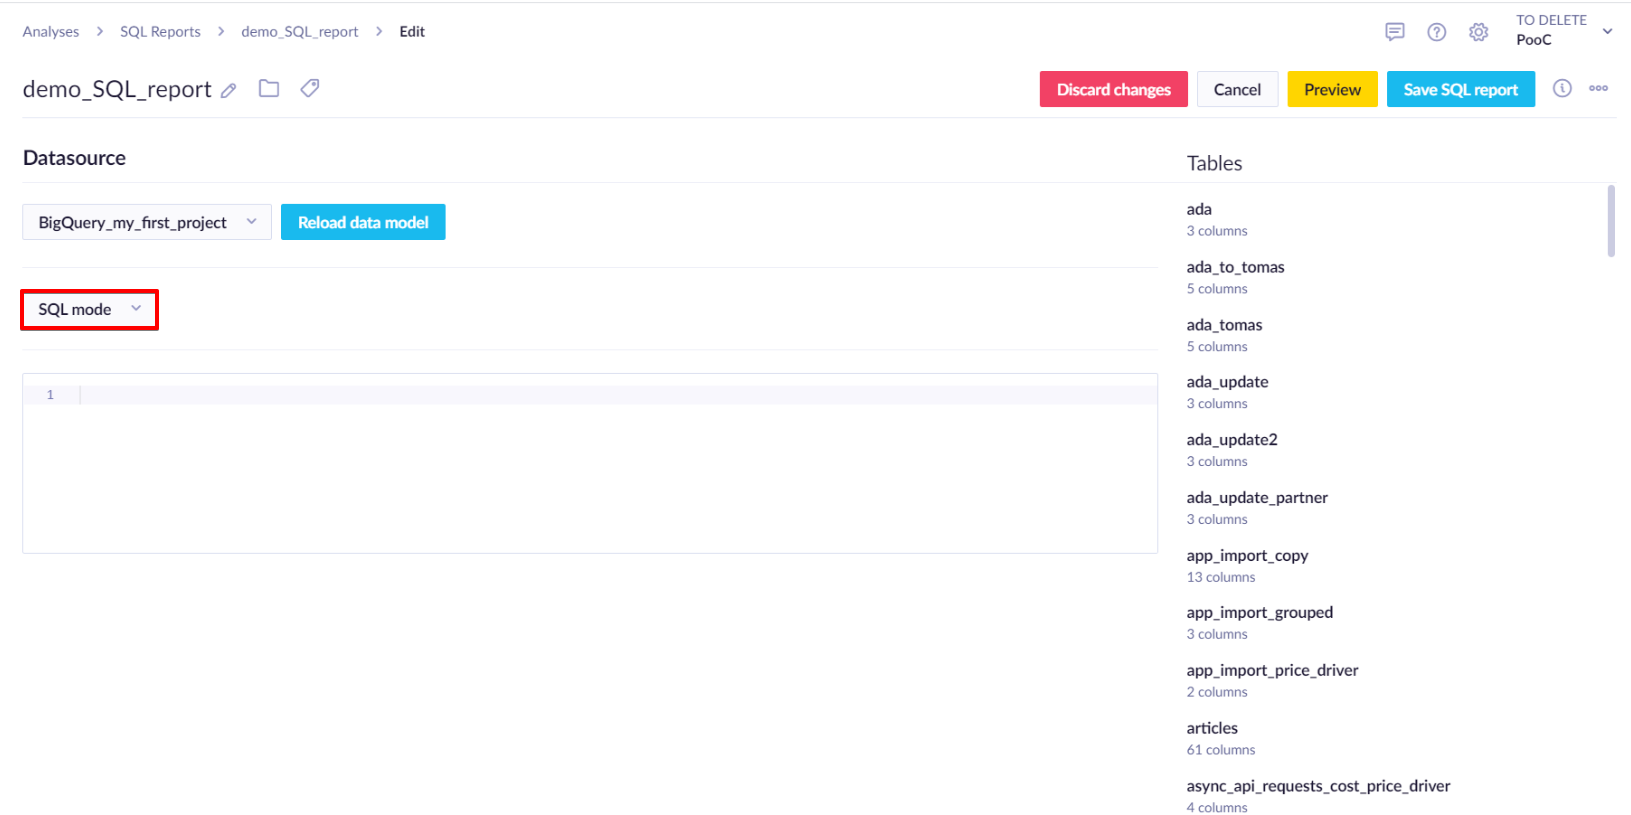
SQL mode with the table browser
Editing actions
In the upper right corner, there is a dot icon. After clicking on it, the bar menu will appear with those options for editing/adjusting the whole report:
| Action type | Description |
|---|---|
| Save as new | Edit an already existing report and save it as a new report. |
| Download CSV | Export option. |
| Add to Dashboard | Shortcut for adding the report to your dashboard. |
| Show usages | Shows places where the analysis has been used in your project. |
| Delete analysis | Erases the whole report. |
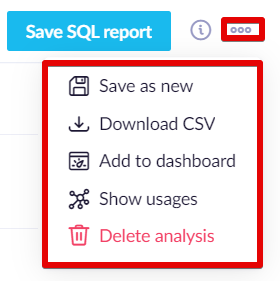
Editing actions available
Updated 2 days ago