

"Weekly Heat-map" analysis
What is a Weekly Heat-Map Analysis?
The Weekly Heat-Map Analysis is a visualization of data; useful to better understand customer behavior on-site. On the Y-axis you have time broken down by the Hour of the day and on the X-axis by the day of the week. Date part formatting sums up events across time as defined by the time filter; for example, if you have a 6 months long time filter; the Analysis will account for 6 months of purchases occurring at 1 am-1.59 am, 2 am-2.59 am, etc. on the Y-axis 6 months of purchases on Mondays, Tuesdays, etc. on the X-axis.
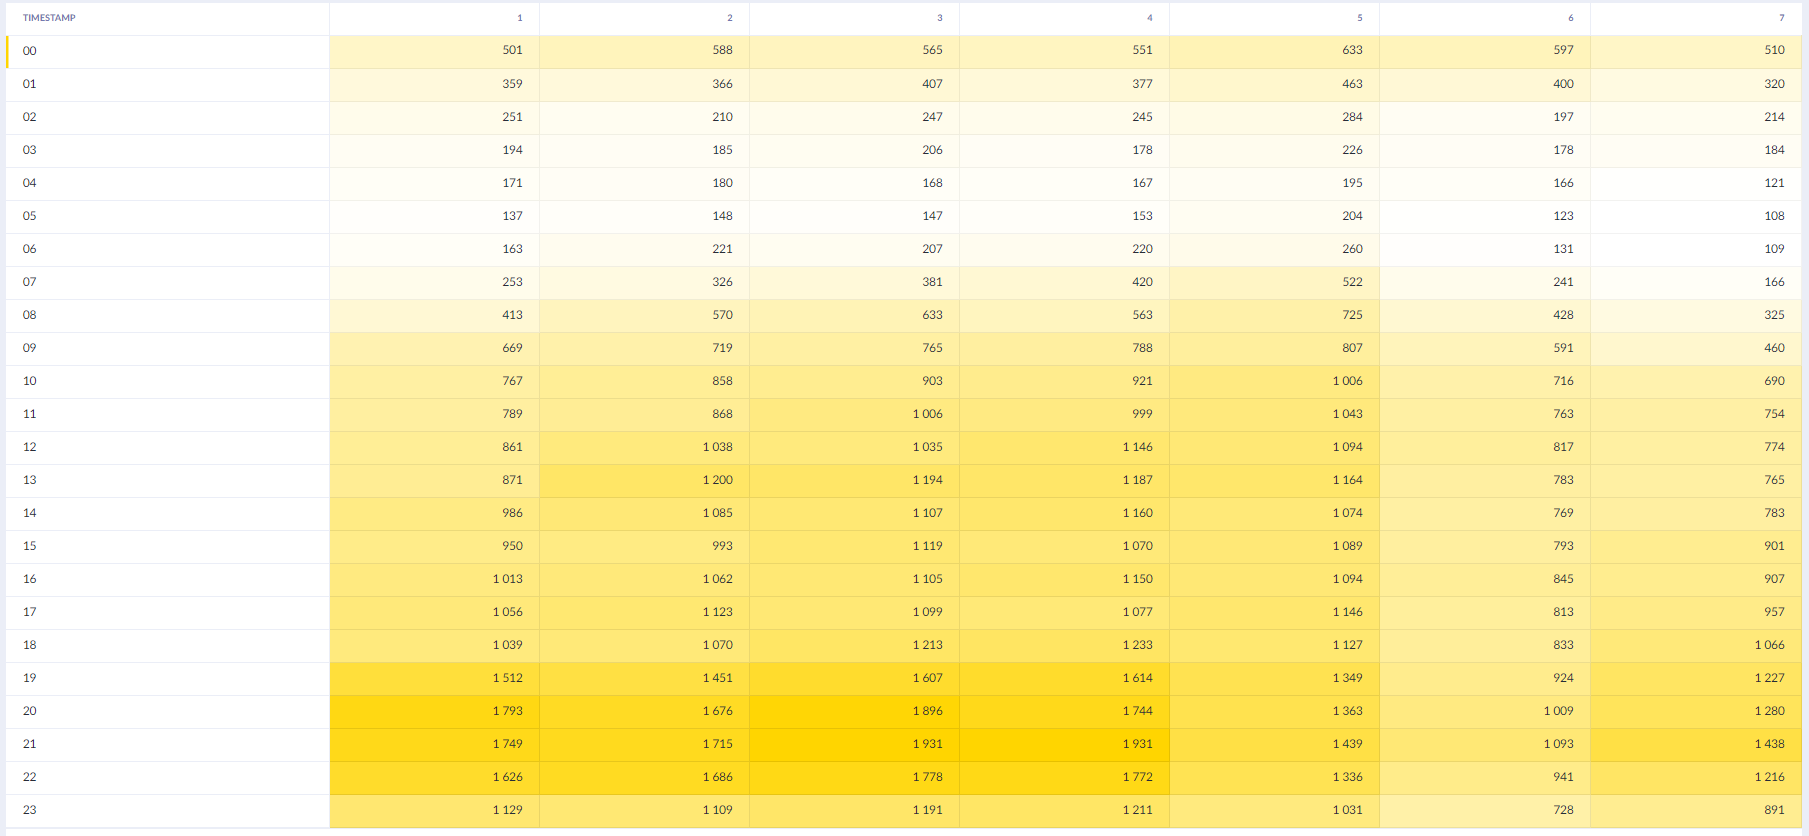
Timeframe: 6 Months; Metric: count.purchase; In this weekly heatmap analysis, we can see that hottest time period for buying is between 20h and 23h of the day from Monday through to Thursday.
Why you should use it
The Weekly Heat-Map Analysis shows you during which hours are your customers most active in terms of the metric you are studying.
- Examining Purchases through the Heat-Map Analysis is useful to determine when are your "hottest buying periods".
- Examining Session_starts through the Heat-Map Analysis is useful to determine when most customers arrive on your site.
Advised Solutions
- Drill down the analysis by Customers who "have an email" and this analysis will help you with the timing of Newsletter/Sales E-Mails/SMS send-outs during "hottest" time periods
- Drill down the analysis by Traffic that has arrived from your Facebook Organic/ Instagram and this analysis will help you with the Timing of your Social Media posts.
- Web Personalization for customers who are shopping through the night. "Night Shopping Mode"
- Web Personalization for customers who are buying during the "hottest" time periods
How to create a purchase weekly heat map using Bloomreach Reports
Open Analysis > create a Report; follow the visual guide and then hit preview.

Weekdays in word rather than numberIf you want your heat-map to list the weekdays in the first row in as words rather than numbers you can do this by having 7 different metrics. The first would be called Monday, and there would be an event filter where timestamp weekday matches equal to 1. Afterward, you would make similar metrics for the other 6 days.
Don't forget to subsequently delete the timestamp setting in the Columns setting.
How to create a session_start weekly heat-map using Bloomreach Reports
Copy the above Report as shown in the GIF below and replace the Metric of count.purchase [ALL] with count.session_start [ALL]
Note: You can also do this with session_ends, view_items, cart_updates, etc.

How to filter "Weekly Heat-map" Analysis by a Customer Audience
At the bottom of the Report there is a "Customer Filter" This filters the results only by customers who fulfill the filter logic.
In the image below, we would be looking at the purchases occurring to customers who have purchased at least twice. This way you can see the behavioral pattern of your more loyal customers only.

How to filter "Weekly Heat-map" Analysis by an Event Attribute
At the bottom of the Report there is a "Customer Filter" This filters the results only by customers who fulfill the filter logic.
In the below screenshot, the Metric is set as session_start; and we are filtering by "Paid Google" traffic. This way the heatmap only takes into account Paid Google Session_starts.

Updated 2 days ago