
Predictions templates
The predictions module provides the following pre-defined templates.
Purchase prediction
The purpose of Purchase prediction is to identify customers with the highest chance of making a purchase and adjust the marketing budget across different segments to increase overall marketing performance.
Steps to execute:
- Create a prediction model
- Evaluate the model’s performance
- Create segmentation based on the model
- Create an A/B test to test out different approaches for each segment
- Evaluate and run
If you have mapped the purchase event and corresponding status in Data Manager > Mapping, then you do not need to specify the event for this prediction. It will be done automatically.
Create a prediction model
- To create the prediction, go to Analyses > Predictions , click + New prediction, and select Purchase prediction.

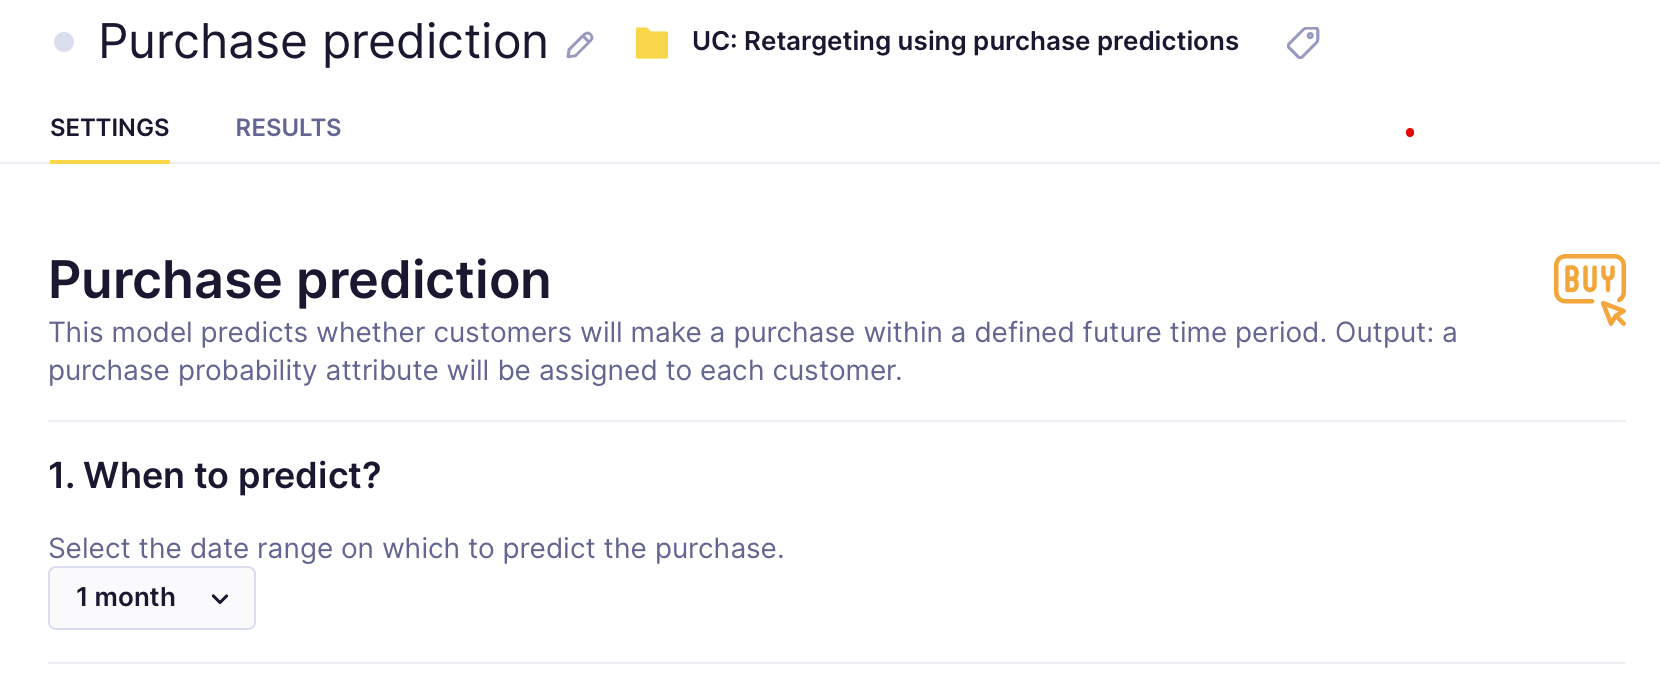
- Specify the time frame for which you want to predict future purchases
In the example below, we chose one month. This means that the algorithm will consider the last two months - the month before the last to generate features and the last month to generate the targets.
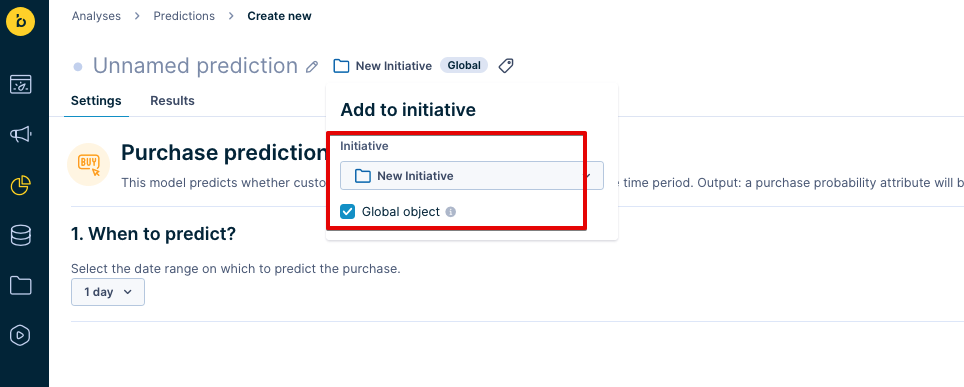
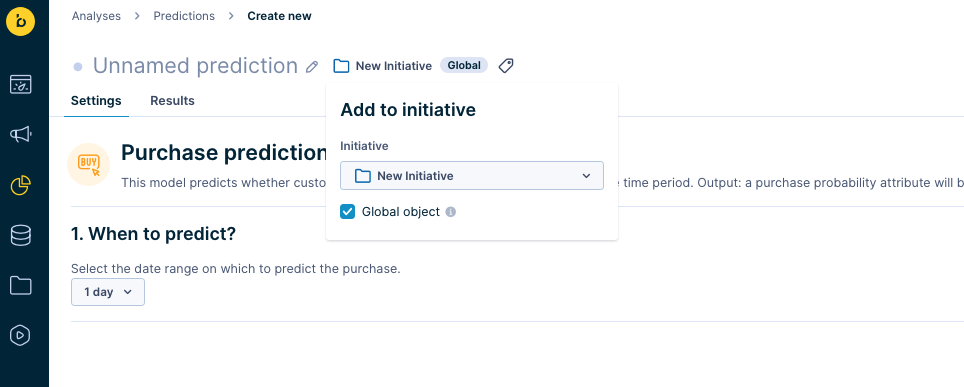
- If your prediction is part of an initiative, mark it as a global object to display in the customer profile. Click on the Initiative icon next to your prediction's name, and tick the Global object.
- Click Save and then Startto launch the calculation. You can monitor its progress in the Results tab.

The process usually takes between 20 minutes to a few hours, depending on how much data it needs to process in a given project.
Check the model’s performance
Before using a model, you always need to evaluate its performance. As explained in the Model quality evaluation section, you can evaluate based on multiple metrics. We suggest using AUC for this particular model. If the performance seems satisfactory, continue to the next step. If not, no strong predictions could be derived from the available training data. In such cases, try using a different time frame or a custom template where custom features can be chosen instead.

We also recommend that you go through the decision tree and check the result of the individual nodes. This can give you business insights into probabilities of different groups of customers taking certain actions and a way of verifying your model. If a particular result seems improbable, you probably fell into the overfitting trap and need to adjust the model.
Create segmentation based on the model
The result of Purchase prediction is stored for each customer in a customer property called the same as a prediction: in this case, Purchase prediction [1 month]. The prediction is recalculated with the most up-to-date data every time its value is requested (in the same way as aggregates or segmentation). The result is a value between 0 and 1 which expresses the probability that a customer will make a purchase next month.
To narrow down the data points, create a segmentation that will divide customers into several segments you can use later. Your chosen segments will vary according to your need. In the example below, we created the following segments:
- High probability
- Medium probability
- Low probability


If the customers are too unevenly distributed among the segments and would be useless for the campaign, you need to adjust the segmentation, so the segments are more even. To do so, you should set at least two thresholds to divide the customers, as above.
Creating a simple report is the best way to find thresholds. Rows will contain the prediction, and the grouping is set to none. The report has two metrics, both count of customers but one modified as ‘Column total %’ and the second as ‘Running total %.’

From the report table, we can identify the thresholds and, based on our preferences, choose either large segments or only a percentage of customers in the highest segment.

After saving the segmentation, we can continue to the next step.
Create an A/B test
After the last step, you know to which segment each customer belongs, but you do not know the most effective approach to the segments. To find out, create an A/B test, dividing customers into four groups:
- Control group
- Small spend
- Medium spend
- High spend
Every group will be connected to a specific retargeting audience using the retargeting node (its budget will be set in the ads manager). After every retargeting node, an add event node should be appended for evaluation purposes. For purchase prediction, it should consist of the following four properties:
Campaign_name- the name of the campaign current campaign (should be unique)Prediction_name- the name of the prediction that was usedPrediction_value- current predicted value for the customerVariant- A/B test variant

As a result, you will have 12 segments (3 prediction segments x 4 audiences). Next, you should evaluate what works best for each.
Evaluate and run for all customers
After running the scenario for several days, you can evaluate the following:
- Does the model have an impact on the effectiveness of the campaign? This should be done by comparing the performance of the prediction segments with the control group.
- Identify what works for each segment. You can do this by comparing the uplift in the performance of a particular part and the amount of money spent to achieve it.
For example, in the screenshot below, the model gave us insights into the behavior of different groups of customers and the amount that should be spent on them during the campaign. Firstly, few resources should be used for the High spend segment; the amount spent does not seem to have a significant influence as the group is easily activated from the onset. Secondly, most of the budget should be spent on the Medium spend segment because increasing the amount seems to increase the likelihood of purchase significantly. Lastly, the Low spent segment should not be invested because increased investment does not transform into more purchases.

To understand whether the difference between a particular variant and the control group is statistically significant, we recommend using our bayesian calculator.
Based on the evaluation, the final adjustment of the campaign can be made so that real-time predictions will drive the optimal budget planning for retargeting.
Churn prediction
The purpose of the “Churn prediction” is to proactively identify customers who are likely to churn (stop using your product) and to win them over before they do so. Specifically, the prediction determines whether a customer who bought something during a defined previous period is likely to purchase something in the defined future period as well. If a customer is unlikely to purchase in the defined future timeframe, they are deemed as having a high probability of churning.
Steps to execute:
- Create a prediction model
- Evaluate the model’s performance
- Create segmentation based on the model
- Create an A/B test to figure out what works best for every segment
- Evaluate and run
Create a prediction model
- To create the prediction, go to
Analyses>Predictions>+ New prediction >Churn prediction.

- After you selected the template, specify
- the time frame for which you want to predict future purchases
- an event that represents purchase in your project
In the example screenshot below, we chose one month and the purchase event. This means that the algorithm will consider the last two months - the month before the last to generate features and the last month to generate the targets.

- If your prediction is part of an initiative, mark it as a global object to display in the customer profile. Click on the Initiative icon next to your prediction's name, and tick the Global object
- Click Save and then Startto launch the calculation. You can monitor its progress in the Results tab.

The process usually takes between 20 minutes to a few hours, depending on how much data it needs to process in a given project.
Check its performance
Before using a model, you always need to evaluate its performance. As explained in the Model quality evaluation section, you can make your evaluation based on multiple metrics. We suggest using AUC for this particular model. If the performance seems satisfactory, continue to the next step. If not, no strong predictions could be derived from the available training data. In such cases, try using a different time frame or a custom template where custom features can be chosen instead.

We also recommend you go through the decision tree and check the result of the individual nodes. This can give you business insights into probabilities of different groups of customers taking certain actions and a way of verifying your model. If a certain result seems improbable, you probably fell into the overfitting trap and need to adjust the model.
The result of the Churn prediction is stored for each customer in a customer property called the same as a prediction: in this case, Churn prediction [1 month]. The prediction is recalculated with the most up-to-date data every time its value is requested (in the same way as aggregates or segmentation). The result is a value between 0 and 1 which expresses the probability that a customer will make a purchase next month.
Create an A/B test
After the last step, you know the probability of certain customers not making another purchase. The next step is to identify customers whom you consider as those with a high probability of churn. What is meant by a high probability of churn varies in each prediction depending on the distribution of this probability. Therefore, it is recommended that you check the distribution in a simple report where the prediction will be in the rows and the number of customers (usually count(customer)) as the metric.
Once you have chosen users you consider very likely to churn, you need to A/B test whether incentivizing them to make another purchase increases the likelihood of them doing so. To do this, you take the probable churners and divide them into two groups:
- Variant
- Control group
You will try to incentivize the Variant group to purchase while the control group will not be targeted with any campaigns. This will allow you to compare whether your purchase-incentivizing campaign had any effect.
An example below shows how the scenario will likely look once you are finished. In the example, the scenario only considers customers who were active (made a purchase) in the last 30 days and who have a very high churn probability (in this case, above 0,8). The A/B test splits the remaining customer into the Variant and Control groups. To evaluate the model's performance, we track the information for a sample of the customers (10k) with lower churn probability to compare the probability of churn in the future.

As a result, we can create segmentation with 3 segments that will help us to evaluate the campaign’s effectiveness.

Evaluate and run for all relevant customers
After running the scenario for several days, you can evaluate the following:
- Does the model have an impact on the effectiveness of the campaign?
- This should be done by comparing the control group with the customers in the lower churn probability group with the added prediction event.
- Does the incentive work?
- You can do this by comparing the Control group with the Variant.

To understand whether the difference in the A/B test between the variant and the control group is statistically significant, we recommend using our bayesian calculator.
Based on the evaluation, the final adjustment of the campaign can be made so that real-time predictions will win over and incentivize some of the previously probable churners to make a purchase.
In-session prediction
The purpose of the In-session prediction is to identify which customers are very likely to make a purchase during their ongoing session and to target them immediately with a campaign/weblayer to nudge them to make the purchase.
Steps to execute:
Create a prediction model
- Evaluate the model’s performance
- Create segmentation based on the model
- Create an A/B test to figure out what works best for every segment
- Evaluate and run
Create a prediction model
- To create the prediction, go to
Analyses>Predictions>+ New prediction >In-session prediction`.

- Specify the time frame for which you want to predict the future purchases and an event that represents purchase in your project.
In the example screenshot below, we chose one month and the purchase event. This means that the algorithm will consider the last two months - the month before the last to generate features and the last month to generate the targets.

- If your prediction is part of an initiative, mark it as a global object to display in the customer profile. Click on the Initiative icon next to your prediction's name, and tick the Global object.
- Click Save and then Startto launch the calculation. You can monitor its progress in the Results tab.

The process usually takes between 20 minutes to a few hours, depending on how much data it needs to process in a given project.
Check its performance
Before using a model, you always need to evaluate its performance. As explained in the Model quality evaluation section, you can make your evaluation based on multiple metrics. We suggest using AUC for this particular model. If the performance seems satisfactory, continue to the next step. If not, no strong predictions could be derived from the available training data. In such cases, try using a different time frame or a custom template where custom features can be chosen instead.

We also recommend you go through the decision tree and check the result of the individual nodes. This can give you business insights into probabilities of different groups of customers taking specific actions and a way of verifying your model. If a certain result seems improbable, you probably fell into the overfitting trap and need to adjust the model.
Create segmentation based on the model
The result of Purchase prediction is stored for each customer in a customer property called the same as a prediction: in this case, In-session prediction [1 month]. The prediction is recalculated with the most up-to-date data every time its value is requested (in the same way as aggregates or segmentation). The result is a value between 0 and 1 which expresses the probability that a customer will make a purchase next month.
To narrow the range into manageable buckets, create a segmentation that will divide customers into a number of segments you can use later. Your chosen segments will change according to what you need. In the example below, we created the following segments:
- High probability
- Medium probability
- Low probability

If the customers are too unevenly distributed among the segments and would be useless for the campaign, you need to adjust the segmentation, so the segments are more even. To do so, you should set at least two thresholds to divide the customers, as in the picture above.
The best way to find thresholds that will produce usable results is to create a simple report wherein the rows the prediction is picked and the grouping is set to none. The report has two metrics, both count of customers but one modified as ‘Column total %’ and the second as ‘Running total %’.

We can read the thresholds from the report table based on our preferences. We are trying to get equally large segments or having only some percentage of customers in the highest segment.

After saving the segmentation, we can continue to the next step.
Create an A/B test
After the last step, you know to which segment each customer belongs but do not know the most effective approach to each. To find out, create an A/B test, dividing customers into two groups:
- Variant
- Control group
You will show a weblayer/campaign to the Variant group, while the control group will not be targeted with anything. This will allow you to compare whether your purchase-incentivizing campaign had any effect.
There are multiple types of weblayers that you can use. Whichever you decide on, you should create 3 (or more) alternates of the same prediction - one for each segment, as in the screenshot below.

You can choose the segment for the weblayer in Settings > Audience > Customer filter. Then you specify the desired segment from the In-purchase prediction. In the screenshot below, we choose the high probability segment for this weblayer.

As a result, in this example, we would have six segments (3 prediction segments x 2 variants) based on which it will be possible to evaluate what works best for each segment.
You can be very creative about the type of weblayer which you choose. However, its message should be such that it will incentivize a quick purchase.

Evaluate and run for all relevant customers
After running the scenario for several days, you can evaluate the following:
- Does the model have an impact on the effectiveness of the campaign? This should be done by comparing the control group with the customers in the lower churn probability group with the added prediction even.
- What works for each segment? You can find this out by comparing the uplift in the performance among different probability segments of the Variant and the Control group. For example, in the example below, the high-probability segment does not need any special discounts because there is no uplift in the conversion. However, the discounts are achieving their purpose for the medium and low probability segments. You can calculate your profit margins to decide whether to use the discount for these segments.

To understand whether the difference in the A/B test between the variant and the control group is statistically significant, we recommend using our bayesian calculator.
Based on the evaluation, the final adjustment of the campaign can be made so that real-time predictions will decide whether a weblayer is displayed to a certain customer.
Optimal send time
The optimal send time is a prediction model that considers the past behavior of your customers and calculates the time, rounded to an hour when they are most likely to interact with your campaign. This allows you to automatically send out email campaigns to individual customers at a time when they are most likely to click or open your email.
Visit our dedicated Optimal send time article to learn more about this prediction template.
Updated 11 months ago