

Campaign performance
Campaign performance, part of the Performance dashboards, includes two dashboards: Scenario evaluation and Email campaign evaluation. These dashboards provide a comprehensive view of the revenue and engagement metrics for specific campaigns or scenarios. They help you track the performance of individual action nodes within your campaign.
Take a visual tour by watching our Campaign performance video section.
Scenario evaluation dashboard
Scenario evaluation dashboard provides a comprehensive overview of a scenario's performance, enabling you to assess its effectiveness and revenue generation. It measures key metrics such as
- Attributed revenue
- Conversions
- Customer engagement
Additionally, it evaluates engagement across various channels, including:
- SMS
- Browser push
- Mobile push
This dashboard offers actionable insights to optimize campaign strategies and enhance overall results.
Access the dashboard by navigating to Bloomreach and following these steps:
- Go to Campaigns > Scenarios, select a desired scenario, and click Scenario.
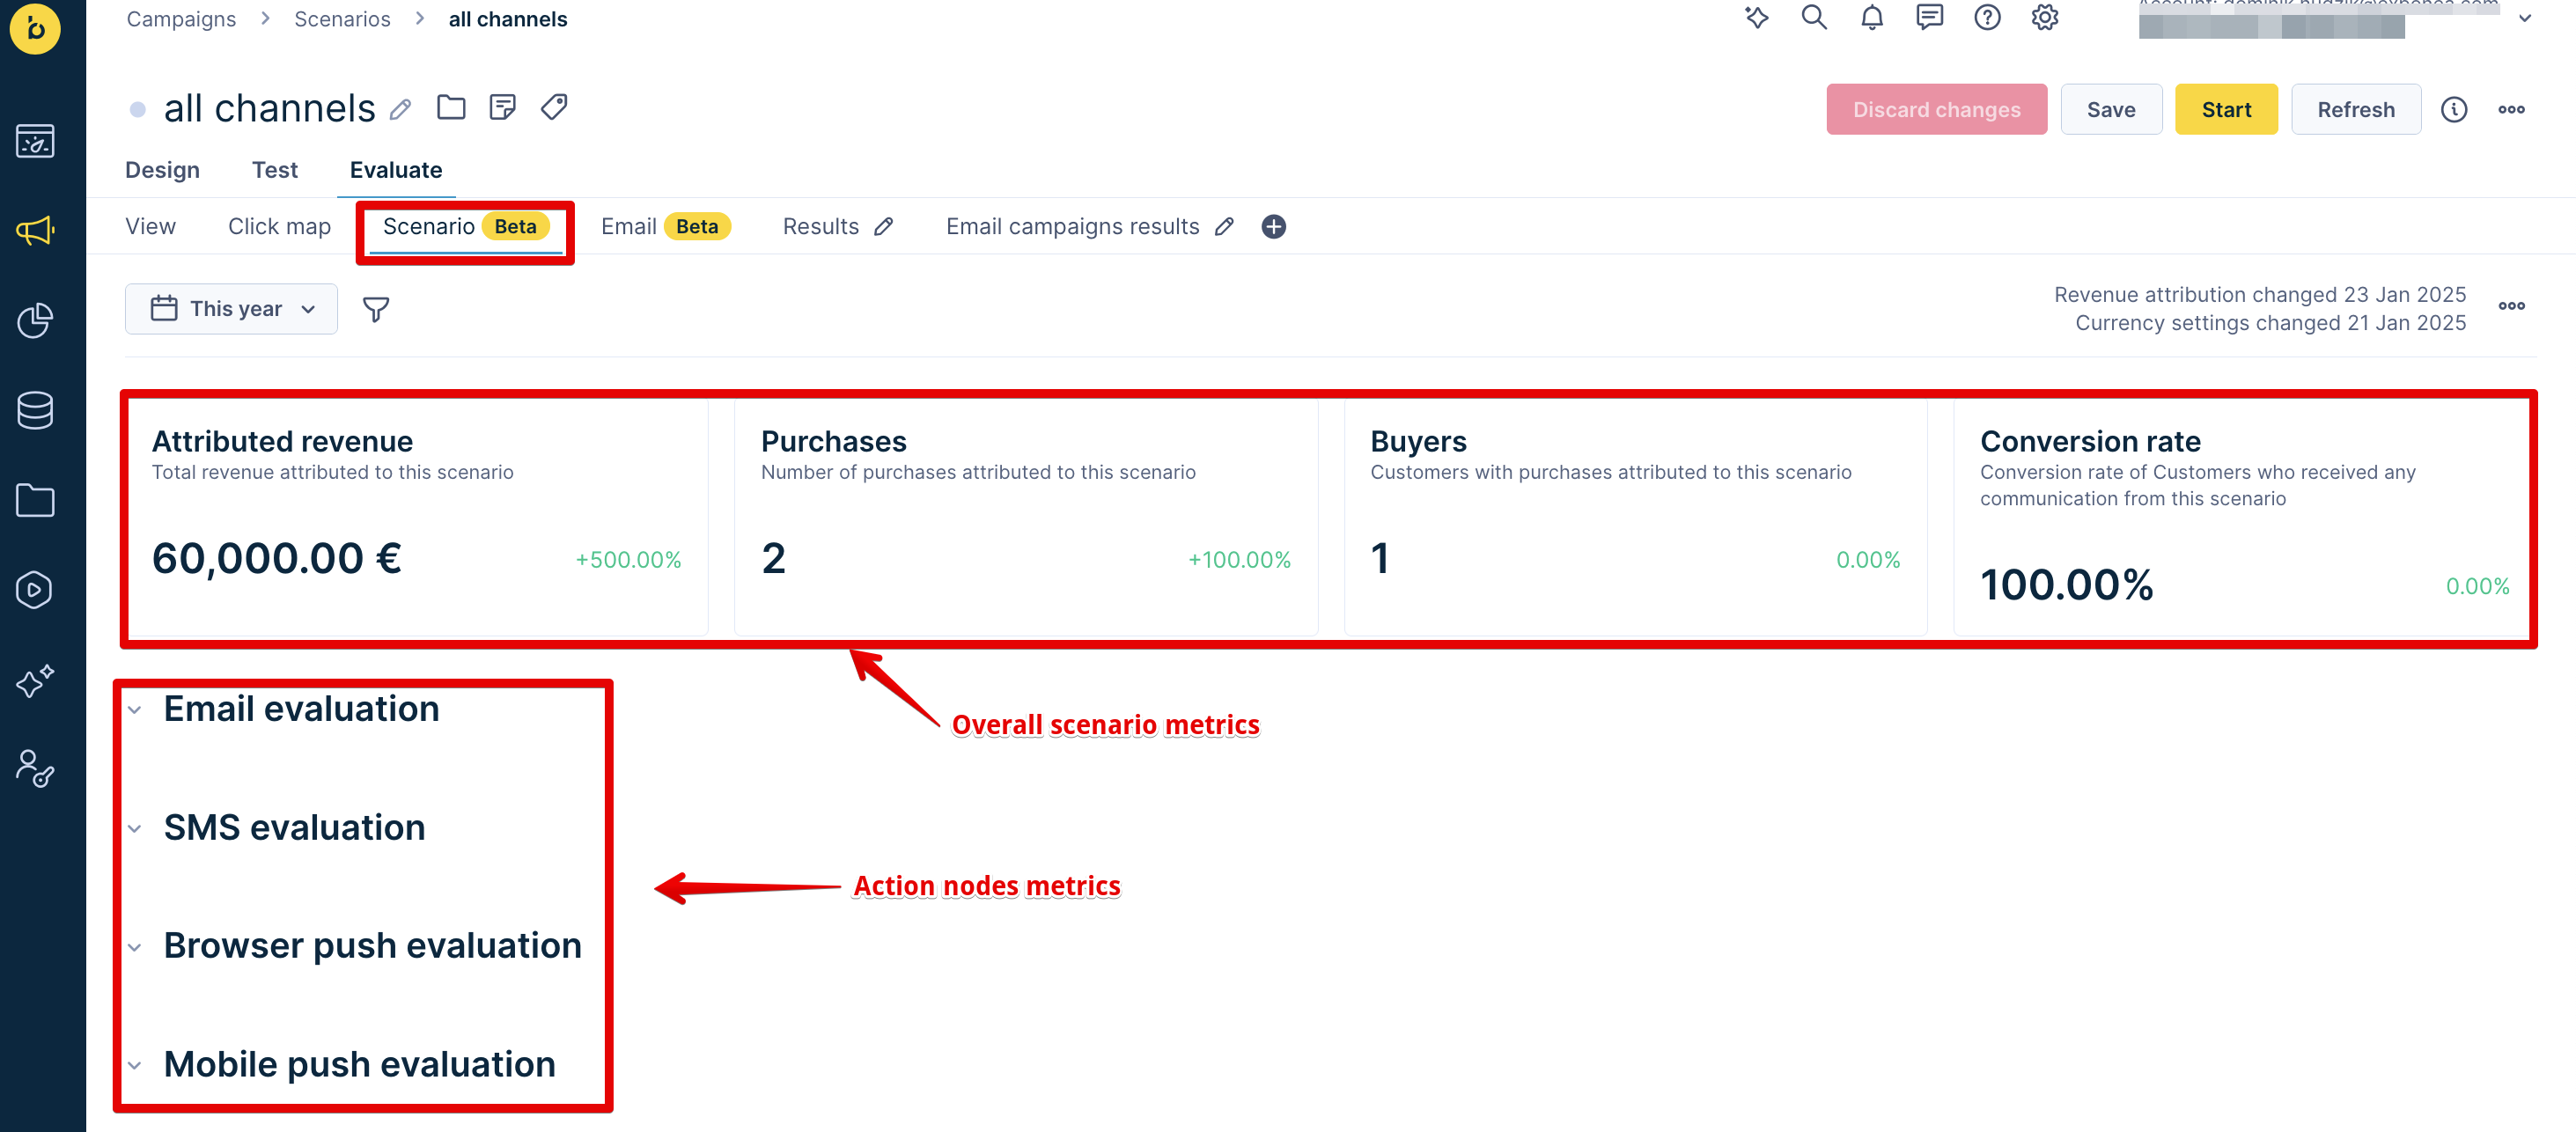
- The dashboard automatically displays insights from Bloomreach.
- You can view metrics that attribute revenue to the overall scenario or break it down by each action node (email, SMS, mobile push, browser push, or WhatsApp) for detailed analysis. The dashboard will only show action nodes that are used in the selected scenario.
- To customize the dashboard to fit your specific needs, learn how to modify it.
- Refer to the glossary for a better understanding of the metrics used within this dashboard.
Scenario evaluation dashboard examples
Using the metrics and definitions from the Scenario evaluation dashboard, you can gain insights on the following situations:
Revenue insights
During a Black Friday campaign, check the Attributed revenue to see the total sales generated. Examining Revenue by channel helps identify which (email, SMS, or browser push) was most effective.
Channel conversion rates
For a welcome series using email and SMS, track the Conversion rate to see how many recipients made a purchase. Comparing conversion rates across channels reveals which one performs better.
Touchpoint effectiveness
In an abandoned cart scenario with email reminders and a browser push notification, evaluate the results for each action. This includes comparing Open rates, Click rates, and Conversions to determine which touchpoint drives the most revenue.
WhatsApp campaign impact
During a WhatsApp re-engagement campaign, track Revenue from WhatsApp and the Conversion rate to assess the effectiveness of the messages. Analyzing the Conversion funnel from WhatsApp to purchase visualizes the customer journey after receiving a message.
Email campaign evaluation dashboard
Email campaign evaluation dashboard provides insights into the performance of an email campaign. It allows you to monitor key metrics such as
- Delivery rates
- Engagement
- Revenue
- Deliverability health
With this dashboard, you can also track the performance of individual elements within a campaign.
To access the dashboard, follow these steps:
- Go to Campaigns > Email campaigns, select a specific campaign, and click Email.
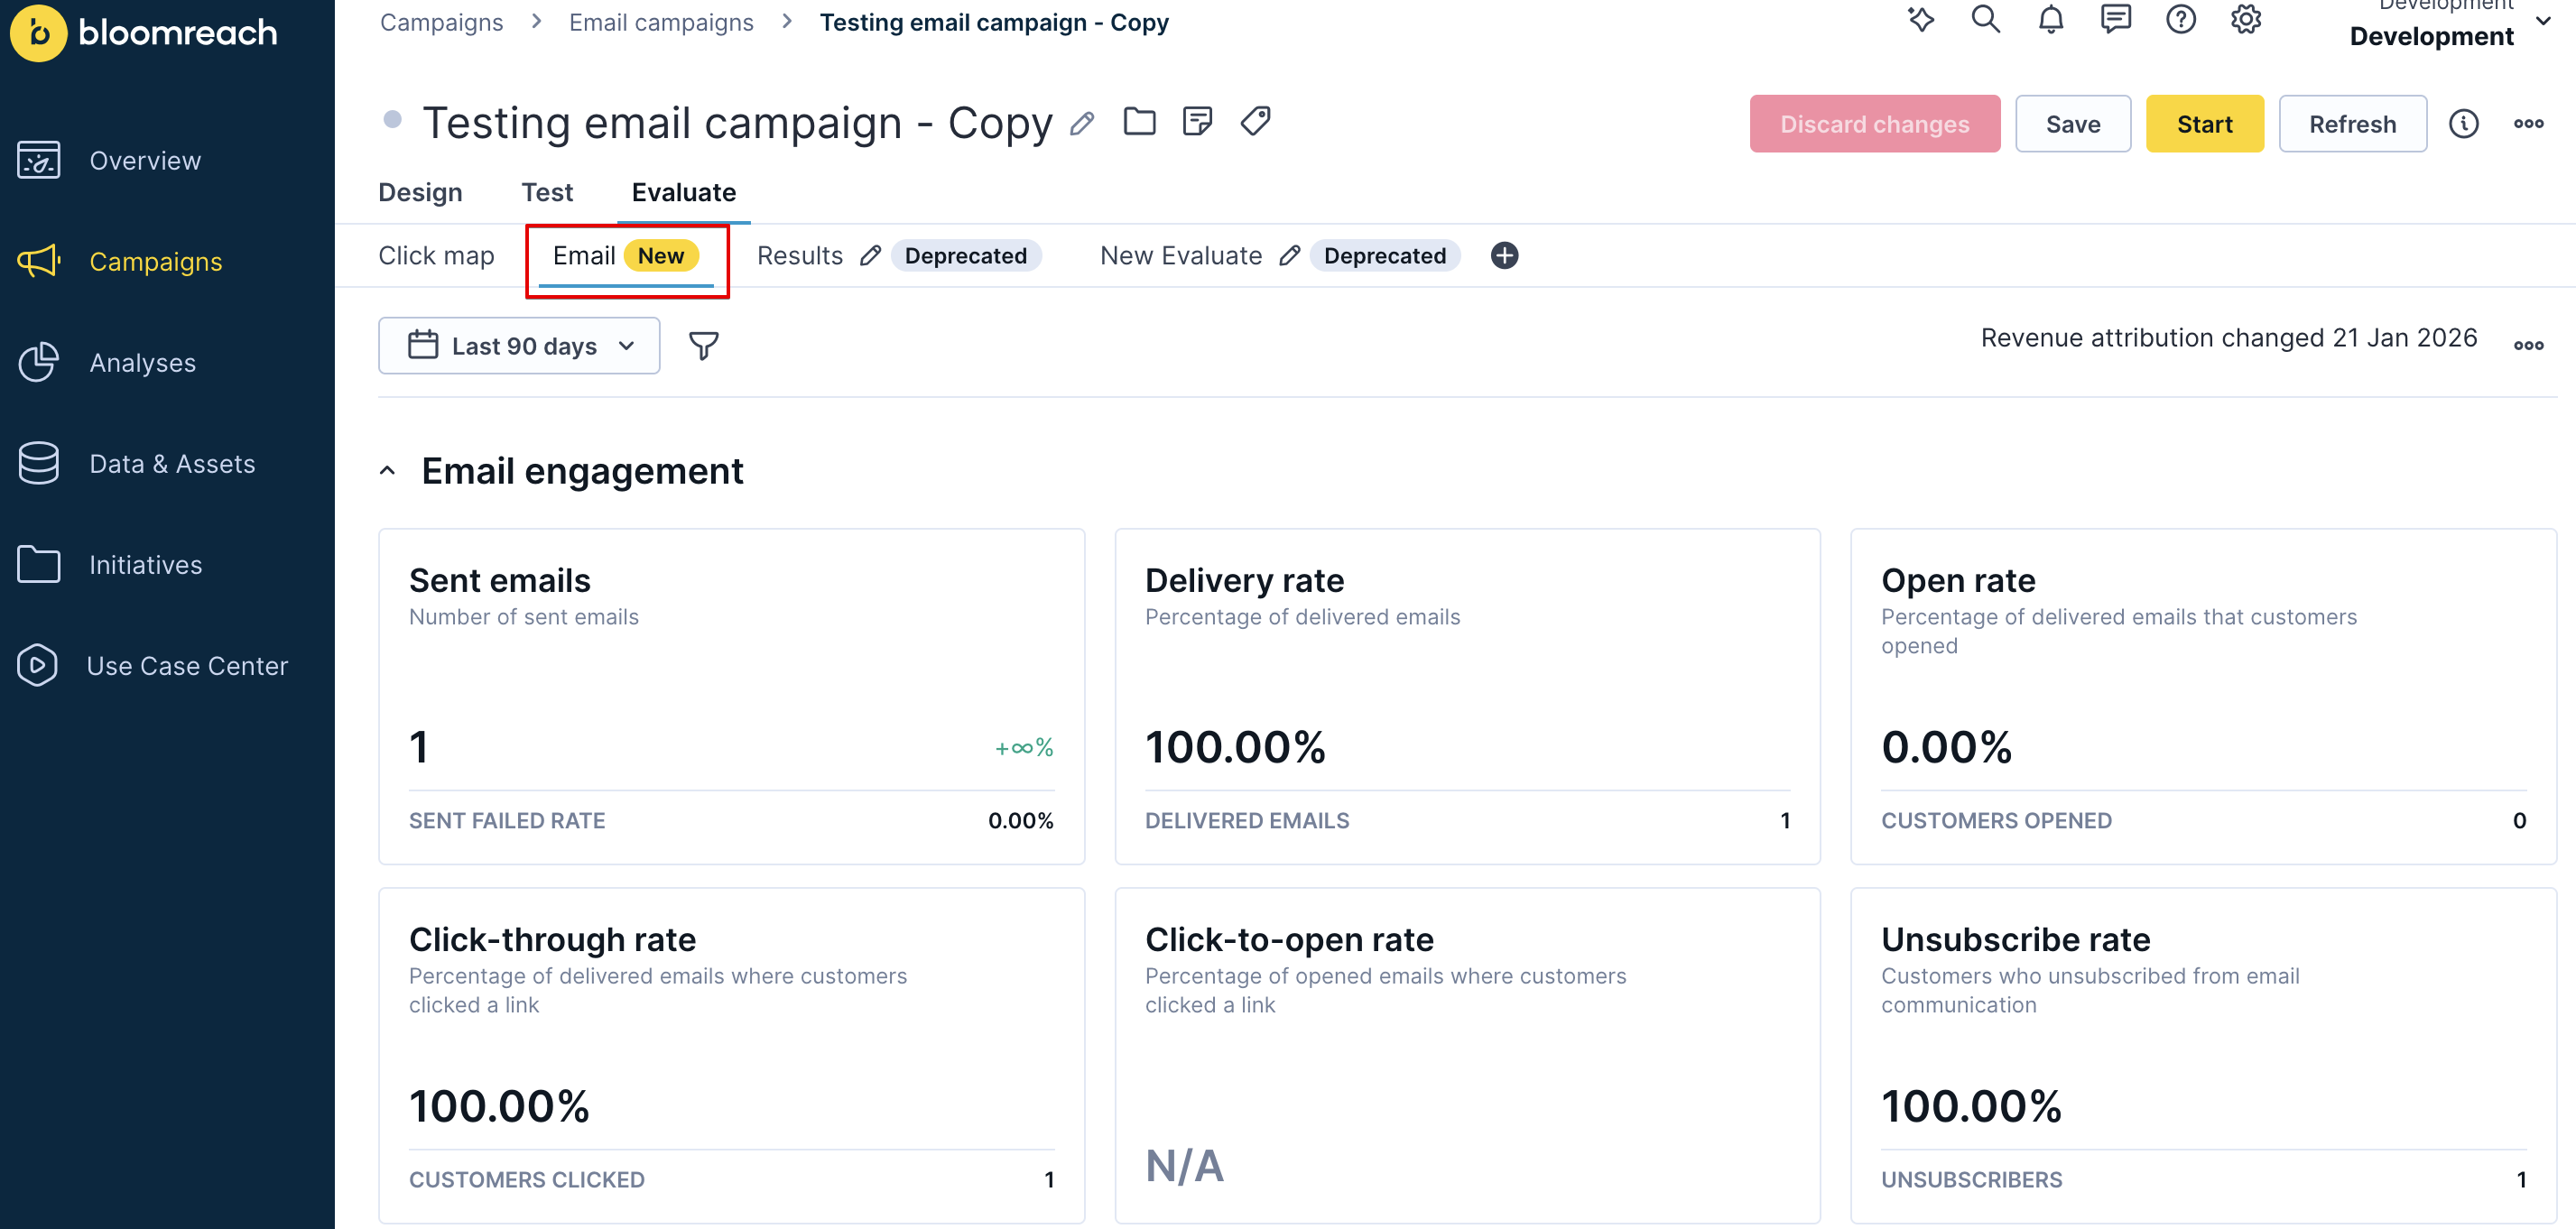
- The dashboard will display automatically generated insights from Bloomreach.
This evaluation combines metrics from Email revenue, Email engagement, and Email deliverability dashboards adding more specific views such as:
- Results per action name: shows all email campaign nodes within the selected scenario.
- Revenue per action name: shows the revenue generated by each action node in the selected campaign.
- Top clicked links: shows which links receive the most clicks in your email campaigns.
- Deliverability metrics by action name: Compares delivery performance across individual emails within the campaign.
Refer to the glossary for a better understanding of the metrics used within this dashboard.
- To customize the dashboard to fit your specific needs, learn how to modify it.
Why delivery rates sometimes exceed 100%
You might occasionally see delivery rates exceeding 100%. This happens because the metric relies on enqueued and delivered campaign statuses. If the expiration date for one of these statuses is set sooner, it can affect the calculation. This edge case can occur when enqueued events from different action nodes trigger almost simultaneously with no delivered status recorded between them. This reporting anomaly reflects the technical nature of how campaign events are processed.
Email campaign evaluation dashboard examples
The following use cases demonstrate how to use the Email campaign evaluation dashboard effectively.
Email delivery
After sending an email campaign, you want to determine whether it reached your customers. To quickly check for email delivery issues, you can monitor campaign performance through metrics such as Sent emails, Delivery rate, and Sent failed rate.
Audience engagement
You're curious how many people opened and clicked on links in your email. Use the Open rate and Click through rate to understand how your audience engaged with the content. Use the Top clicked links report to see which links receive the most clicks to understand what content drives engagement and optimize future emails.
Revenue impact
You want to assess how your email campaign has impacted your overall sales. Use the Revenue and Purchases metrics to track your campaign's financial contributions.
Action node performance
You're analyzing the effectiveness of different emails within a specific scenario. Use the Results per action name to see which email drove the most engagement and conversions.
Performance trends
You wish to review how your email campaign performed over time. Use the Volume and primary rates and Revenue breakdown over time to track key metrics and identify trends.
Email deliverability
You want to monitor your campaign's delivery health. Track key metrics such as Delivery rate, Soft bounce rate, Hard bounce rate, and Complaint rate. Use the Email volume and delivery rates report to review deliverability performance over time.
Identify provider-specific delivery issues
Check if specific mailbox providers are affecting your campaign's delivery. Use the Deliverability by top email domains report to see performance across Gmail, Yahoo, and Outlook. Below-benchmark metrics are highlighted. If all providers are affected, check Deliverability by sending IP and integration.
Compare action node deliverability performance
Compare which emails in your campaign achieved the best delivery rates. Use the Deliverability by action name and language report to compare delivery rate, open rate, click-through rate, and bounce rates across action nodes. Sort by any column to identify top performers.
Detect delivery slowdowns
Your emails are taking longer to reach recipients. Use the Emails by time to delivery reports to identify which providers are slowing delivery and adjust future sending strategies.
Diagnose bounce patterns
Your campaign shows increased bounces. Check the Soft bounced reasons and Hard bounced reasons reports to identify temporary provider issues, IP blocks, or invalid addresses.
Fix template errors
You see failed sends in your campaign. Check the Failed send reasons report to identify consent violations, frequency policy issues, or Jinja template errors.
Updated 4 months ago