

Retentions
This guide explains what retentions are, how the retention table and chart work, and how to create a retention analysis.
What are retentions?
Retentions are an analytical tool that visualizes repeated customer engagement with your business. They show how often and how soon customers return to perform specific actions, such as page visits or purchases.
When setting up a retention analysis, you define two events — an initial step and a returning step — and a time frame of interest. Bloomreach then condenses your customer data into a table, or you can choose to display the results as a chart.
How retentions work
Table structure
The retention table organizes your customer data into rows, columns, and cells.
| Element | Description |
|---|---|
| Rows | Represent time cohorts of customers, segmented by when they took the initial step for the first time. |
| Columns | Represent the time frame during which the customer returned to take the returning step. For example, column 0 represents customers who took the returning step on the same day, week, or month. |
| Cells | Display the percentage of customers who took the initial step in the time frame specified by the row and the returning step in the time frame specified by the column. |
To illustrate: suppose you want to understand how many customers revisit your website. You only want to count customers who already made a visit and came back afterward. In this case, both the initial step and the returning step would be the session_start event, which signals that a customer started browsing your website.
What remains is choosing the time period. This depends on the specifics of your business — fast fashion customers generally return sooner than customers of electronics stores. The example below uses a time frame of days.
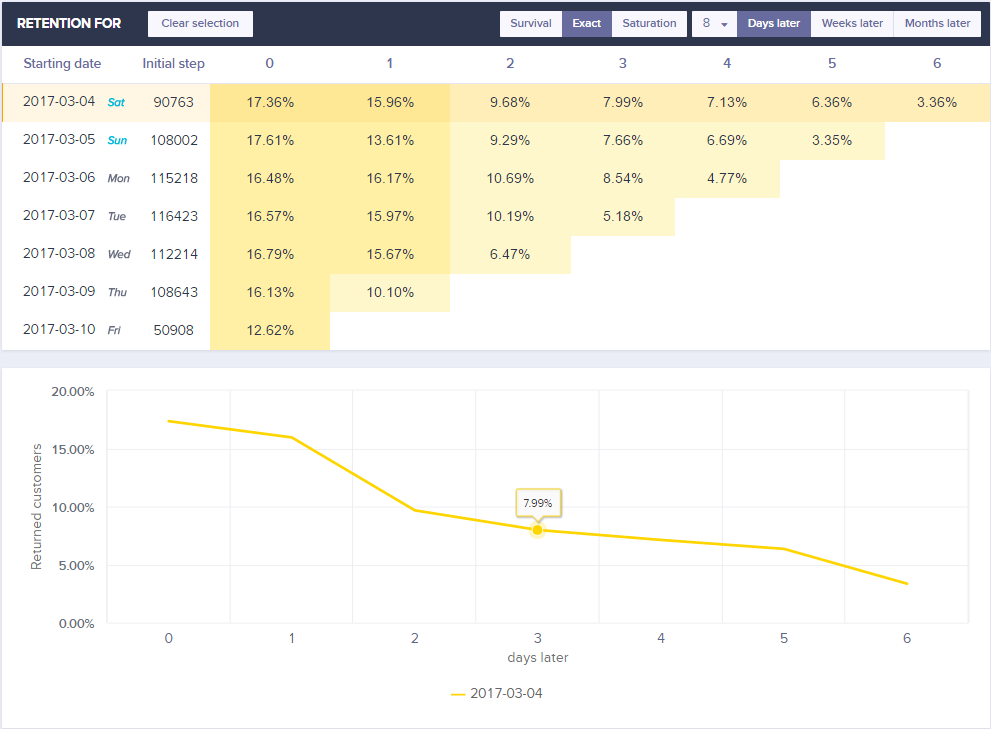
Example retention table tracking daily session_start revisits across customer cohorts.
Retention types
You can switch between three retention types in the table view.
| Retention type | Description |
|---|---|
| Survival | Percentage of customers who returned on the period shown in the column or after. |
| Exact | Percentage of customers who returned exactly on the period shown in the column. |
| Saturation | Percentage of customers who returned on the period shown in the column or before. |
Returning time period
The returning time period defines the interval used to calculate retention. Three options are available: days, weeks, or months.
Chart view
The chart appears after you click a row or column in the table. Use it to visualize retention over time or to compare retention across different time cohorts.
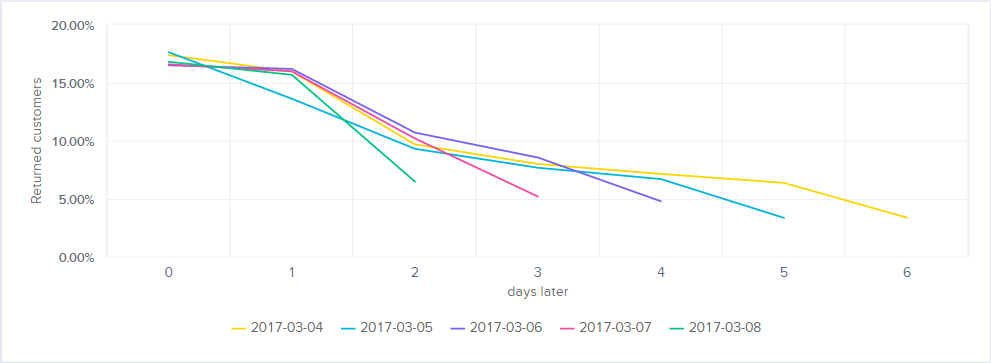
Chart view generated by clicking a row or column in the retention table.
Use retentions to understand your data
A well-configured retention analysis gives you crucial insights into customer loyalty. Common use cases include analyzing revisits, repurchases, and the time between a customer's first visit and first purchase.
A more advanced use case involves observing repurchase rates for specific customer subsets using the filter setting. For example, if you ran a discount campaign that attracted a large number of customers, you can measure its long-term impact by creating a repurchase retention analysis filtered by customers who came from that campaign.
NoteThe retention tool is straightforward to use, but the real challenge lies in asking the right questions. Put careful thought into your choice of initial step, returning step, time frame, and filters.
Create a retention analysis
1. Open the retention editor
- Navigate to Analyses > Retentions.
- Click the + sign next to Retentions in the drop-down menu.
- The retention analysis editor opens with a new, empty analysis.
2. Set the event steps
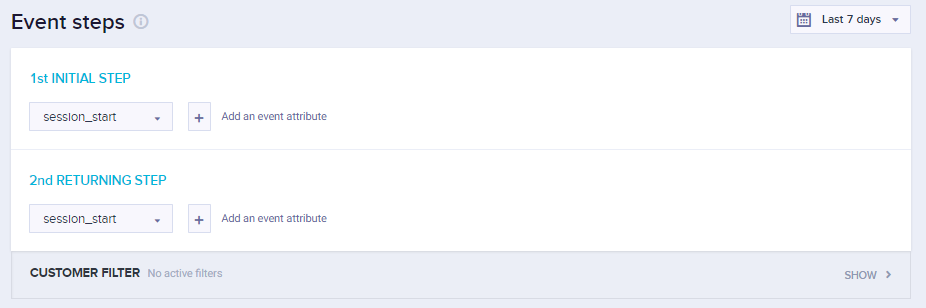
The Event steps panel where you select the initial and returning events for your analysis.
A retention analysis calculates how long it takes each customer to move from the 1st initial step to the 2nd returning step.
For example, to track the time between recurring sessions, use session_start for both the initial step and the returning step.
Complete the following for each step in the Event steps box:
- Click the Select an event drop-down menu.
- Choose the event you want to analyze.
- Click the + sign next to the drop-down menu to add an event attribute.
- Click Preview to generate and view the chart once both steps are filled out.
3. Configure the chart and filters
To learn more about date, customer, and event filters, see Filtering data.
Date filter
The date filter at the top right defines how far back the retention is calculated. The default value is 7 days.
Table view
By default, the retention is displayed as a table. The starting date shows when the initial step occurred. The numbers in the first row define the returning period when the returning step occurred. The value in each column represents the number of unique customers who performed the returning event in that period.
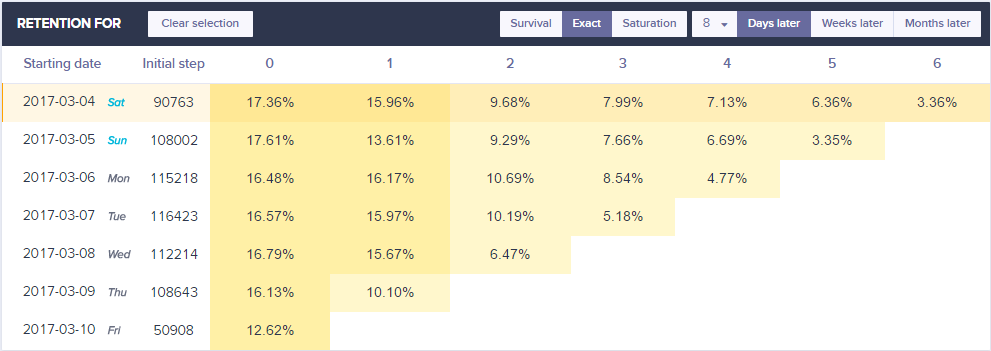
Default table view showing unique customers who completed the returning event per period.
Chart view
Click a row or column in the table to display the chart. The chart helps you visualize retention over time or compare retention across time cohorts.
Learn how to clone your retentions into another project or account.
Updated about 16 hours ago