

Flows
This guide describes how to use flow analysis to track customer paths across your website.
Flow analysis lets you track how customers move through your website — which pages they visit, in what order, and where they drop off. Use it to identify the most common paths from a specific starting point or toward a purchase.
Why use flows?
When customers leave your website after a frustrating experience, you lose revenue. Flows give you the data to understand why — and fix it.
Use flows to:
- Identify bottlenecks: Spot areas of friction that cause customers to abandon their carts or leave without purchasing, then use the data to improve the user experience.
- Highlight popular pages: See which pages attract the most traffic so you can optimize your website design and layout.
- Understand customer behavior: Learn what actions customers take and uncover their preferences as they browse.
For example, you can learn how customers navigate your website after clicking a banner ad or a link from a marketing campaign — and understand which events lead to a purchase or a session end.
Create a flow analysis
Create a new flow analysis
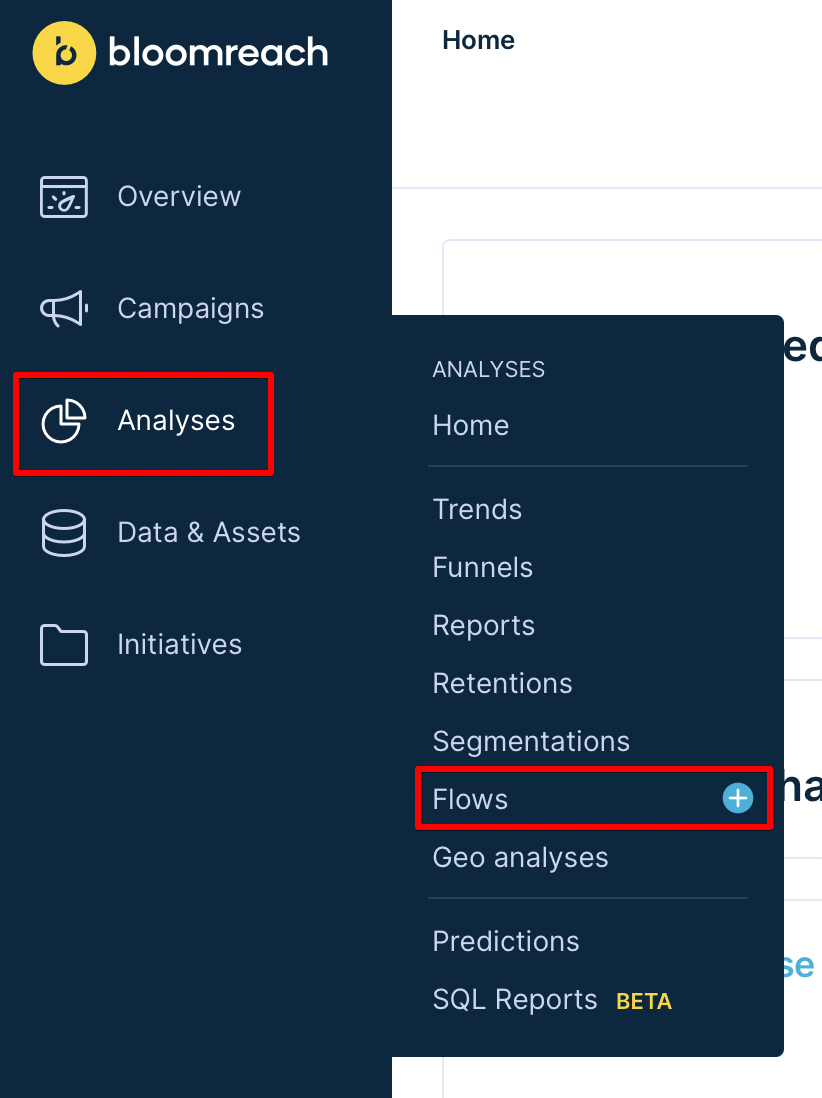
Navigate to Analyses > Flows to create a new flow analysis.
Go to Analyses > Flows.
- Click the plus sign next to Flows in the drop-down menu.
- The edit window opens with a new, empty flow definition.
Edit the flow definition
-
Click Select an event.
-
Choose the event you want to analyze.
-
Select whether this event is a source event or a target event by clicking Starts with or Leads to.
-
Click Preview to generate and view the chart.
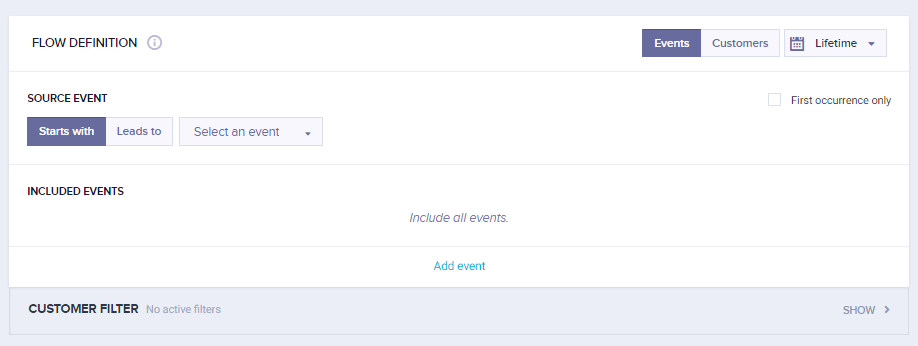
Select an event and choose whether it is a source or target event.
Edit the chart
-
Click a box in the chart to open the editing menu.
-
Choose Drill-down to split a path by its attributes into multiple flows. For example, a
page_visitevent can be split by individual web pages to show the flow for each one. -
Choose Hide to hide the selected path.
-
Click Preview to generate and view the updated chart.
-
Choose Extend to view the paths that emerge from an event. This option is only available for the last step and adds an additional step to the chart.
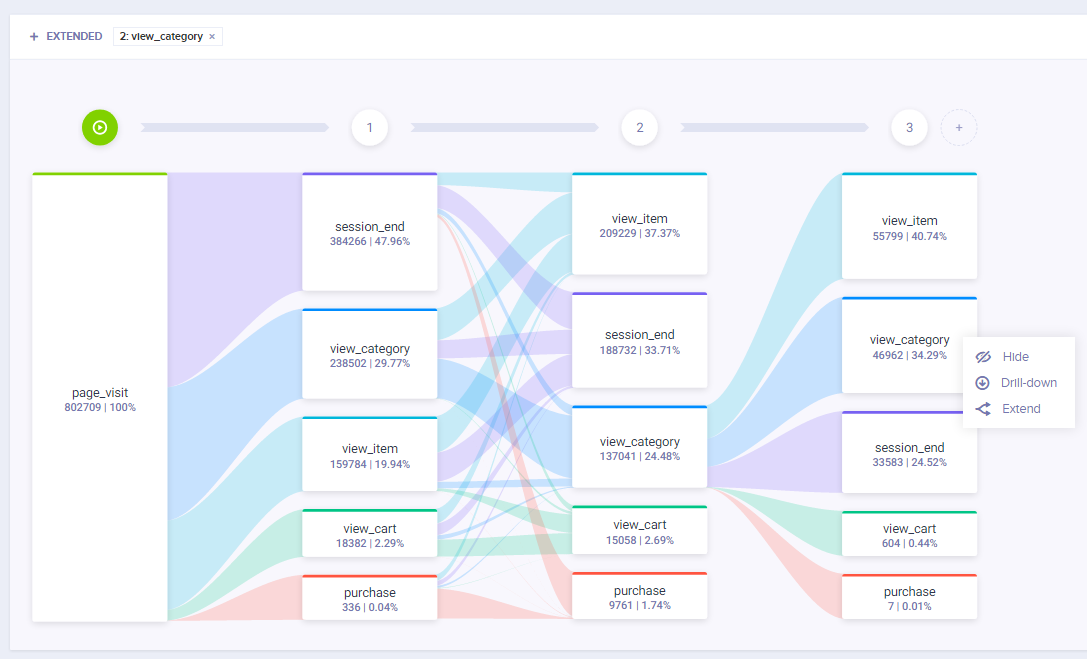
Customer behavior after visiting the homepage, with view_category extended to reveal the next step.
Configure flow settings
Filter data
You can filter flow data by date, customer, and event. Learn more in Filtering data.
Switch between events and customers
On the right side above the Event selector box, use the toggle to switch between:
- Events: Counts all events.
- Customers: Counts only the first occurrence of an event per customer per day.
Show first occurrences only
Select the First occurrences only checkbox to limit the analysis to the first occurrence of an event in a customer's history. By default, the analysis uses all events.
Include specific events
By default, the chart shows all events. To view paths between a specific set of events, click Add event in the Included events section of the Flow definition box.
What's next?
Learn how to clone your flow into another project.
Updated 17 days ago