

A/B testing
This article explains how to use an A/B test and describes its components, exemplifying through a set of Use Cases.
A/B testing compares two versions of either a webpage, email campaign, or an aspect in a scenario to evaluate which performs best. With the different variants shown to your customers, you can determine which version is the most effective with data-backed evidence.
Bloomreach offers A/B testing in:
A customer is assigned a variant that is shown to them instantly when reaching an A/B split node in a scenario or matching the conditions for displaying a weblayer/experiment/email campaign.
There are 2 types of A/B tests:
- Automatic winner/traffic distribution.
- Custom distribution.
These allow you to either let Bloomreach choose the more effective variant, which automatically runs for most of the audience, or manually specify the probability distribution for each variant.
A/B test types
Automatic winner distribution
Automatic winner distribution is available in scenarios and email campaigns.
Automatic winner distribution tests your A/B test variants on a small share of your target audience, determines which variant is more effective, and then automatically sends only the winning variant to the rest of the audience.
For example, you can quickly test different subject lines or CTA buttons in your email or any other communication channel, including SMS, retargeting, webhooks, and others.
The winning variant is chosen based on a metric and timeframe (usually hours) selected in the Winner determination. The metric can be conversion rate, click rate, open rate, or any custom metric (event). The winning variant is visible in the interface after the initial test.
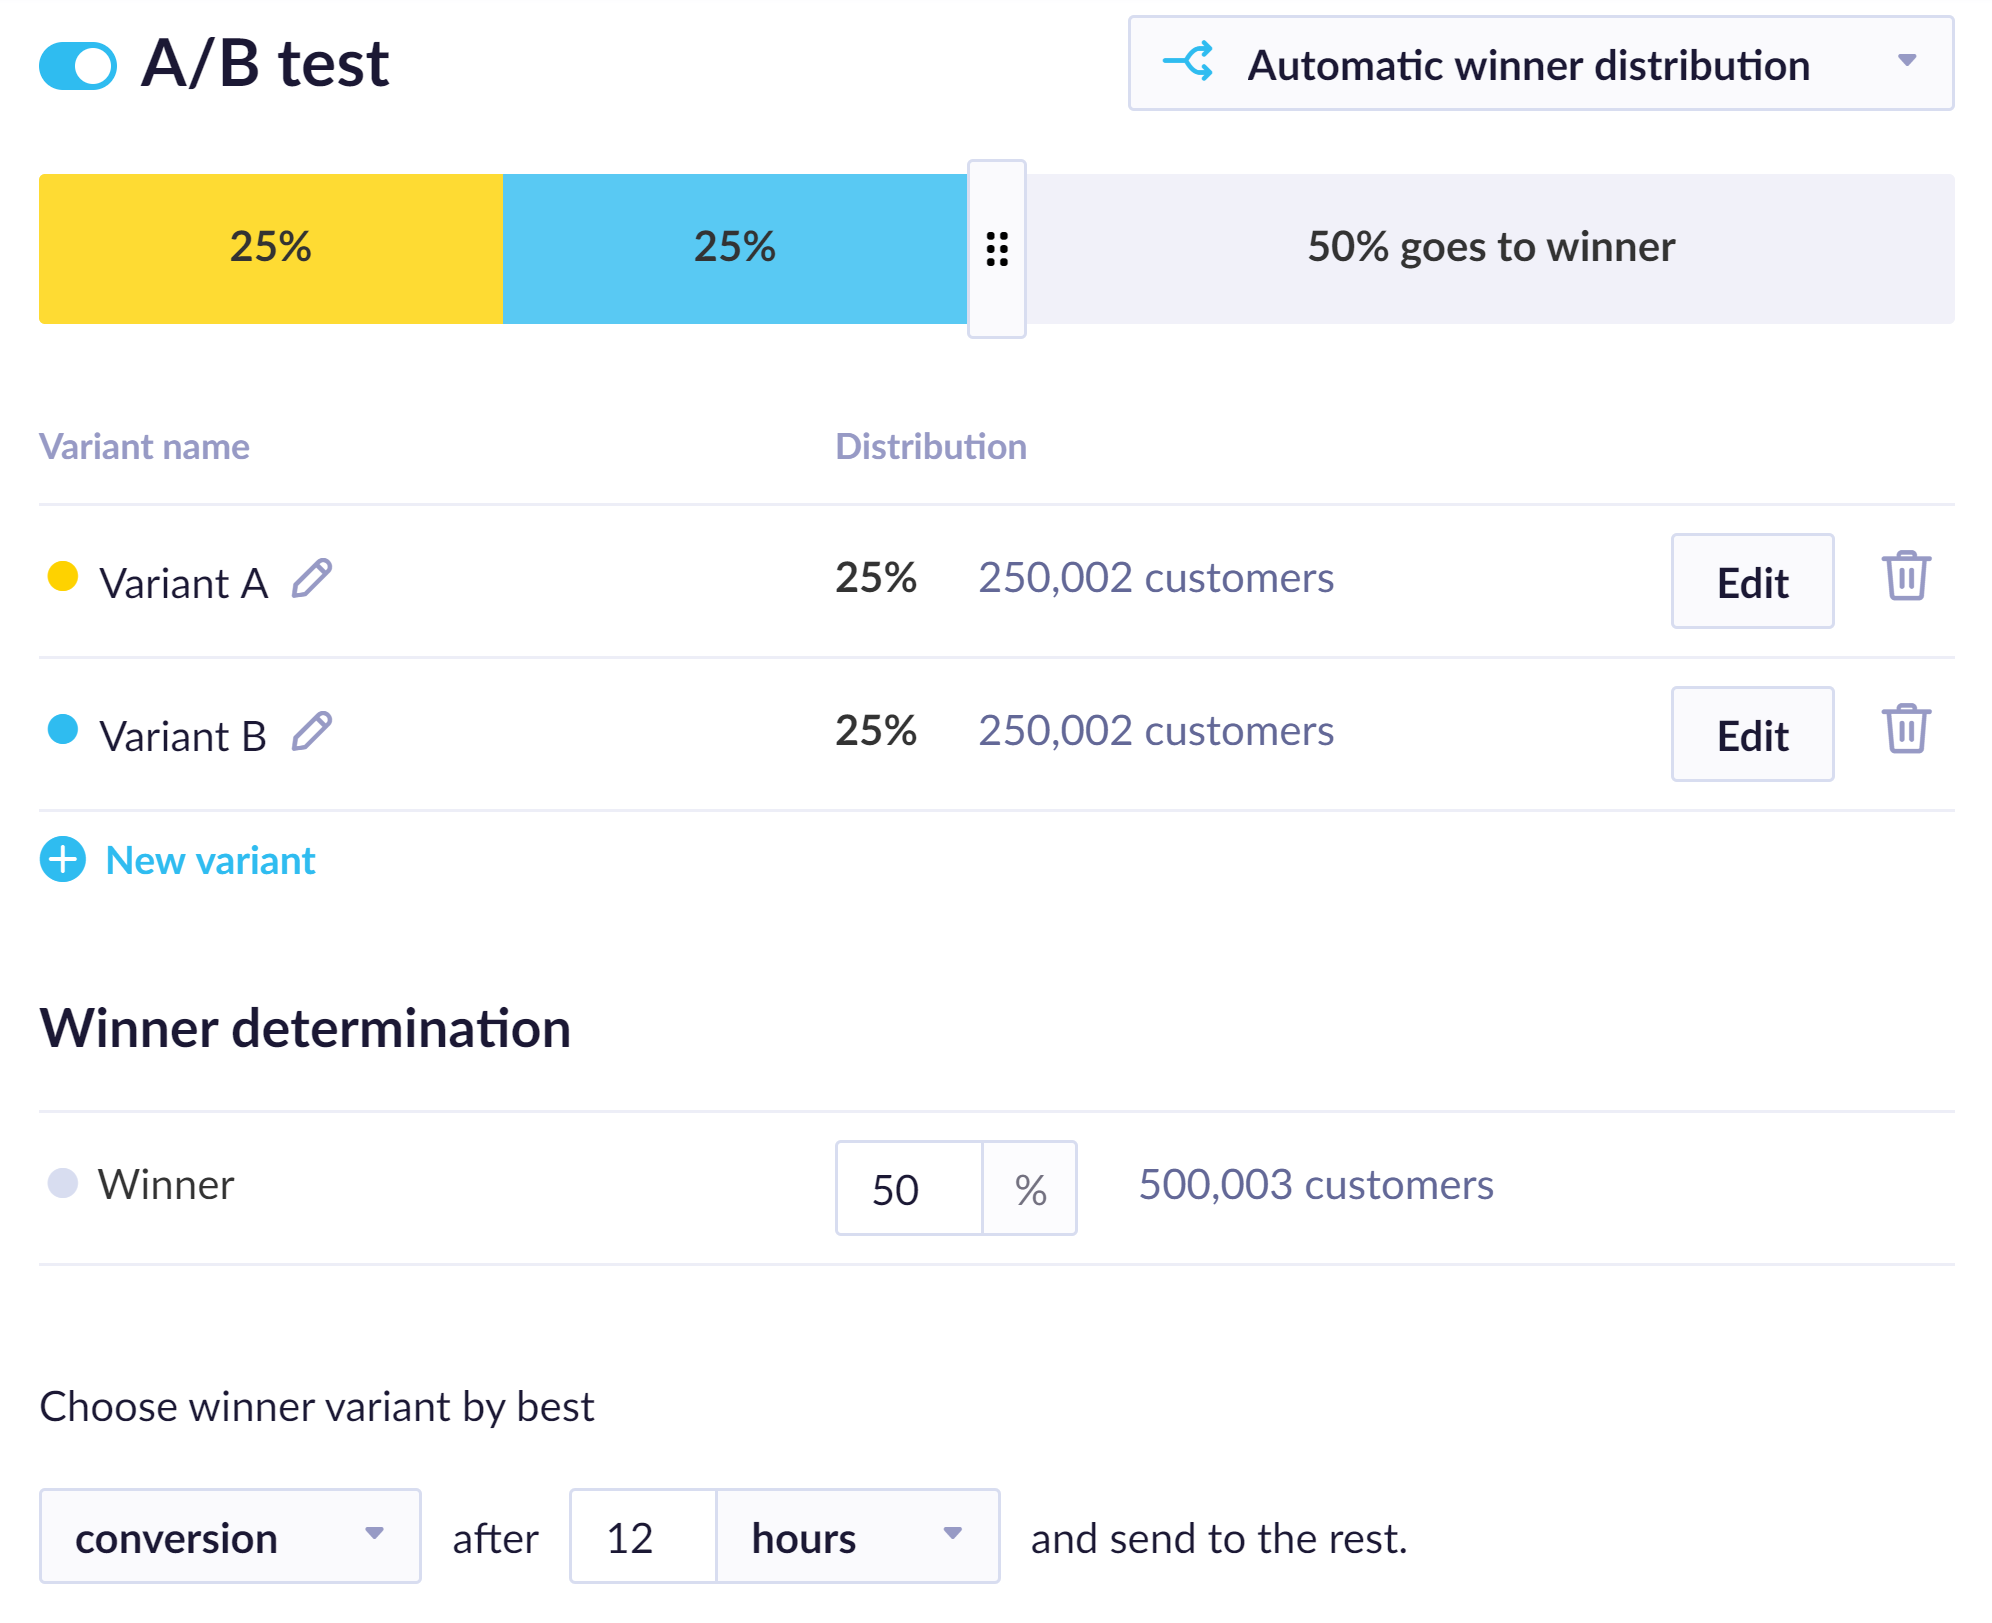
Automatic winner distribution settings
If an A/B test is set for, for example, 72 hours:
- A/B variants are sent immediately.
- The winning variant is sent to the rest after 72 hours based on the conversion/click rate/open rate/custom metric achieved during this period.
Calculate automatic winner distribution metrics
The following steps describe how the conversion metric is calculated:
- Filter only to customers who have A/B test events (only) from the evaluation phase of the given A/B test. Exclude customers who engaged with events from more than one variant due to merging.
- Within this group, identify purchase and campaign events that occur within 4 hours after they pass the A/B test scenario node.
- Evaluate the conversion rate metric as the number of purchases divided by the number of delivered emails from the current scenario.
- Perform this calculation for each variant individually.
- Find the variant with the highest metric to determine the winner. If multiple variants share the same conversion rate (even if it's 0), choose the winner at random.
The remaining 3metrics, click rate, open rate, and custom metrics, follow a similar calculation logic.
Multilingual variants in automatic winner distribution
When testing multilingual variants of your email campaign, the automatic winner distribution doesn't distinguish between them, and the performance of your email campaign as a whole is evaluated, regardless of its language version.
Automatic traffic distribution
Automatic traffic distribution is available in experiments and weblayers.
Automatic traffic distribution tests variants and a share of your users. It recognizes which variant achieves the goal better. Then, it shows the preferred variant for most of the audience. However, it continues to test the other variant on a small share of users. If it performs better, the distribution is automatically re-evaluated, and the other variant can become the preferred one.
Custom traffic distribution
Custom traffic distribution is available in scenarios, weblayers, experiments, and email campaigns.
Custom traffic distribution allows you to manually specify to what percentage of your total audience each variant is shown. If you want to evaluate the success of your A/B test, you can either go to an auto-evaluation dashboard or you can do it manually with the A/B test basic evaluation guide.
Prepare for an A/B test
Form clear hypotheses
Have a clear hypothesis before launching use cases, such as: “By highlighting the stock availability on the product detail page, we believe we'll improve the cart-to-detail ratio by 10%.”
Think about:
- What you're hoping to achieve.
- Why you're launching it:
- For this specific group of customers.
- Under these conditions.
- In this form.
This thinking process during the setup can also help you later when tweaking the use case for another A/B test if the test doesn't perform as expected.
Choose the A/B test running period
Determine how long the A/B test should run before launching it. An A/B test has to run for a particular period before you can look at the results, confidently make conclusions, and take action based on the data.
The test should also run for at least 1 (ideally 2) complete business cycle. A business cycle is weak in 95% of cases, and it is about capturing all kinds of customers, behaviors, traffic, and regular campaigns. Your start and stop times should start and stop at the same point in the business cycle. For example, running the test for two weeks and sending an exceptionally large or successful newsletter at this time skews the results.
We use Bayesian statistics to evaluate the impact of a use case.
Choose the A/B test ratio
Ideally, always start with a 50:50 test. Don't change the ratio until you are sure of the results. Iterate and change the variant over time rather than starting with too many Variants, as they would prolong the duration of the test.
If you use a split other than a 50:50 split between the Control Group and variant during evaluation, you need to segment the customers based on the number of merge events and evaluate the use case through those segments. Otherwise, the evaluation is unfair and skewed to the Variant with a higher percentage.
ImportantDon't change the A/B test ratio of a running campaign. If you need to change the ratio, set up a new campaign (new A/B split node, new weblayer, new experiment) and evaluate only the new campaign.
Customers already assigned to a variant remain in that variant, which can skew the evaluation. If you disable or remove a variant in a live A/B test, customers already assigned to that variant fall back to the Control Group, even if the Control Group is no longer part of the updated setup.
For example, imagine an AA test comparing two identical variants, A1 and A2, with a 20:80 split. After 2 weeks, the ratio changes to 80:20 for another 2 weeks. Although the sample sizes are nearly the same, heavy visitors and purchasers remain concentrated in variant A1, so the evaluation may incorrectly identify A1 as the winner.
Clean your customer base
Adjust conditions
You want your A/B test to be clean and random so that the results are relevant and reflect reality. To that end, we recommend cleaning your customer base of irrelevant customers before sending them to the A/B test.
If you build your A/B test in a scenario, ensure your conditions are defined before the A/B split node.
If sending an email, the email node automatically ensures that customers who don't have the email attribute or the appropriate consent do not receive the email. However, for the A/B test to be correct, you must also eliminate such people from the Control Group, so you need explicit conditions excluding customers without an email attribute or relevant consent from the A/B test.
Custom control group
The control group, by default, shows no variants. If any custom conditions are specified in the JavaScript code, it is important to create a custom control group with the same conditions, even if it does not appear in the actual weblayer. This is important because otherwise, the compared groups would not be homogenous, and the evaluation would be inaccurate.
To achieve this, check if your weblayer variant A contains any special JavaScript conditions. These conditions must be included in the Control Group as well.
Note"Viewcount" banners usually contain a condition that specifies the minimum of views an item must have recently had for the banner to be displayed (and tracked).
Evaluate an A/B test
Calculate statistical significance
Calculate the performance and statistical significance of your A/B test with our A/B Test Significance Calculator.
Check tracking
Ensure to create an evaluation dashboard for each use case before (or within a few days of) launching it. Come back to it after having launched the use case to:
- Check that everything is running and being tracked.
- Polish the dashboard.
You can include basic information about the use case in the dashboard. Documentation (along with processes) becomes increasingly essential for the smooth functioning of organizations as they grow larger. Such information can include:
- Brief description of the use case.
- Brief description of each variant.
- Date when the use case was launched.
- Date when anything about the use case changed (this should also make a new period of evaluation of the use case).
- Attribution window used within the dashboard.
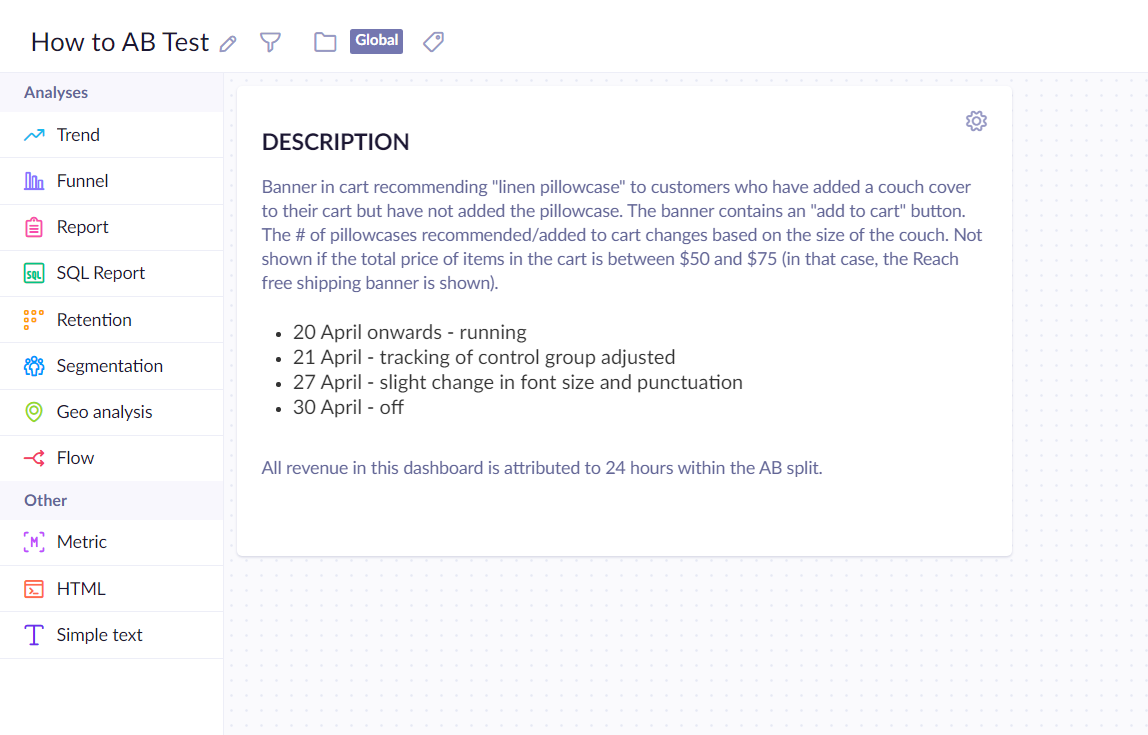
An example evaluation dashboard for an A/B test use case
Customers to filter out
In order to make sure that your use case provides you with valid information, you should filter out your employees, your agencies, Bloomreach, and outliers - customers with unusually high order value or frequency.
This should be done at the end of the evaluation, as the cut-off varies per project/use case and will not be known before launching it. You can draw the distribution of 3 purchases and their total amount, and decide what the cut-off should be based on this.
NoteAvoid filtering out every dashboard component. To do that, create a filter directly in the A/B test segmentation. If you have a set of filters that you always use to exclude customers from evaluations, create a global segmentation that includes all of these filters. This means adding one condition in each review's customer filter instead of all of them.
Halfway check
In some cases, your use case may be hurting the website. It can make such a negative impact that the results don't improve by the end of the predetermined testing period.
Let's say you need to wait for 20 days to get significance. However, after ten days, you should look at what's happening. Uplifts should be positive. If they are negative, use the Bayesian calculator to decide whether to stop the use case (if the results are really bad) or not.
At the end
After waiting for the predetermined period, you must see if your use case has achieved the hypothesized results. Using a Bayesian calculator, you get three numbers:
- The probability that the variant is better than the Control Group.
- Expected uplift if the variant is better.
- Expected loss if the variant is worse.
Based on those numbers (and our assistance), you need to decide whether to use the use case.
You should also check the conversion trend — it should be consistently higher for the variant (that is, not generally lower, with one significant spike that an unrelated circumstance may have caused). Keep in mind that the pattern is highly random for the first days of the week, meaning no conclusions can be derived from it.
You should check how the variant influences the new or existing users. It may be hurting the existing user base. If you find this to be the case, you may want to run this variant only on new users (since the start of the test).
If the results aren't good enough to implement the use case, but you still see a point in it - you believe the use case resolves a business problem that is still relevant - you need to tweak it and start relaunching the use case.
Do you understand why the test didn't ‘confirm’ your hypothesis? Diving deeper into the data might show that it did work for a specific segment, at a particular time, or under specific conditions (that is, only the first impression of a banner) and give you a new hypothesis to test. You can find lessons to be learned that lead to a better-informed test and (customer) insights that are valuable for you. Finding and communicating these insights can still make the test worth it.
Multiple variant A/B tests
Multiple variants (not multivariate) are suited best for pretesting (choosing the best variant), followed by testing the best-performing variant with the Control Group. Remember that multiple variant A/B tests likely take longer to gain significance than simple A/B tests.
When testing multiple variants against a Control Group, you need to compare all the variants that are better than the Control Group against the Control Group itself to see the probability that they are better.
If you have more such variants, you need to compare them with each other and pick the winner based on the implementation cost and the uplift it brings.
NoteThe second-best variant is almost as good as the first one, but it costs half the price of the winning variant, so you pick the second variant in most cases.
Auto-evaluation dashboard
A/B tests also contain an auto-evaluation dashboard. In the report, there are events within the evaluation window, and in the uplifts they are compared to the average performance of all variants from the sample.
Technical notes about A/B tests
- A customer is assigned the same variant when going through the same A/B split in the scenario.
- In weblayers, each customer is assigned the variant in the event “a/b test” and has the same variant in subsequent visits.
- It is possible for a customer to be assigned to more variants if they visit the website from different browsers or devices. In that case, the system doesn't know it is the same customer until they are identified (through a login, for example), and hence can assign different variants on a visit.
- For correct A/B test evaluation, all groups should be identical in conditions except for the variant.
- Weblayers offer automatic A/B testing, which allows preference of the best-performing variant based on the chosen goal.
For details on event attributes, read the System events article.
Use cases for A/B testing
Time of sending
Identifying the best day and time to send campaigns can significantly boost your open rates. When tested, it can increase open rates by up to 20%. If you’re sending at 7 AM each morning, so are many other brands. What happens when we send it at lunchtime or after the working day? For each brand, the ideal send time is going to vary. However, it is a very impactful element to test.
With Bloomreach, you can personalize email send times for every customer with just one click. You can optimize predictions based on open rates or click-through rates according to your goals.
Ideal frequency
The number of messages that you are sending to customers is also important. In Bloomreach, you can easily set up frequency management policies that determine how many messages a customer from a particular segment can get. By doing so, you can avoid spamming and overwhelming your customers. Test various frequency policies and see what works best for your brand. Remember, less is sometimes more!
Improve open email rates
The factors that impact open rates are pretty limited, so they are an excellent place to start. In essence, there are just four things to test with regard to open rates:
- Subject lines.
- Pre-headers.
- Sender name.
- Time of sending.
Subject lines
A good subject line can increase opens by as much as 15% to 30%. The role of the subject line is crucial. It’s about grabbing recipients’ attention in a jam-packed inbox with many other brands crying out, “Open me.” For this reason, subject lines aren't subtle. In addition to grabbing attention, it needs to communicate the number 1 stand-out reason your customers should open this email.
Pre-headers
Because we all mostly view emails on our mobile devices, the pre-header has become a very important part of email anatomy. In our inbox view, it sits under the subject line and acts almost like a secondary subject line. It can have two distinct purposes.
1. It can boost the impact of the subject line with an additional supporting message.
Subject Line: “Footwear lovers, get ready.”
Pre-header: “We’ve added over 100 gorgeous new shoes!”
2. It can add a secondary reason to open the email.
Subject Line: “Footwear lovers, get ready.”
Pre-header: “Plus, check out these statement dresses!”
If you have more than one content piece in the email, the second option can capture the interest of more recipients (which drives more opens).
Sender Name:
Slight amends to the sender's name (not the email address) can be significant. The sender's name is your normal brand name. However, specific brand name variants can drive up open rates when tested. You need to make sure we don’t confuse recipients, but variants of the sender name worth testing include:
“Brand X – New in”
“Brand X – Exclusives”
“Brand X – The Big Sale”
“Brand X – The Style Edit”
Improve content
Beyond optimizing open rates, a good testing plan also moves toward the campaign's content. Here, there are many more factors to test. However, it is possible to increase click activity by 25% when you learn how to present your content. Some of the most impactful tests are:
- Buttons (CTAs) versus no buttons.
- Links versus buttons.
- “Shop new” versus other CTA vocabulary.
- Price versus no price.
- Stylized banners versus product photography.
- Images with supporting text versus images only.
- More products versus fewer products.
- Recommendations versus no recommendations.
- Using abandoned cart items in your newsletter versus not using them.
- Browsed item category “New in” versus no browsed item category content.
- Clearance items versus no clearance items.
Improve conversion rates
Here are some ideas you can try to improve your conversion rates.
- Landing on the product page versus landing on the category page (please note the actual product clicked needs to be at the top left of the category view page).
- Adding delivery options on the product pages versus not adding delivery options on the product pages.
- Category pages sorted by new in.
- Category pages sorted by best sellers.
A/B testing best practices
- Make sure you’re following best practices regarding email deliverability. There won’t be much to test if your emails don’t reach the inbox.
- Test one email element at a time. Testing subject lines and pre-headers simultaneously makes it difficult to know which element had the most impact.
- However, it is possible to develop several testing concepts for one test element. For example, you can test several subject lines at once or CTA language in one test.
- Be careful with winning subject lines, pre-headers, and even sender names in the long run. Overuse of these tends to erode performance over time.
- When setting up your A/B testing in Bloomreach, you need to set the functionality to focus on one metric only to identify the most successful campaign. So, for subject lines, that needs to be open rates. For campaign content ideas, the click-through rate is most likely to be the highest. However, it could also be conversion rates. When testing "price shown versus price not shown", the price shown generated fewer clicks but higher conversions. However, testing results vary for each brand. Test for your results to ensure the best outcome.
- You need to allow a window of time to allow the test recipients to open and engage in the email before deploying the most successful campaign to the holdout group. The longer the window of time, the better the odds are that the campaign deployed is the best-performing one. Our recommendation is a 4-hour wait.
- To gain confidence in testing and its benefits, start with simple tests before doing more ambitious ones. The tests for opens are a great place to start.
- Plan your content tests for your content team to arrive at the test variants you want to run.
Updated 23 days ago