

Aggregated campaign dashboard
The aggregated campaigns dashboard gives you an overview of key email campaign performance metrics—specifically open rate and click rate—without linking any actions to individual customer records. This helps you measure campaign effectiveness while staying compliant with data privacy regulations like GDPR and ePrivacy.
How it works
When enabled, the platform starts aggregating open and click actions for each email campaign in a separate storage that isn't linked to any customer identifiers or events. This means you get campaign-level insights without creating any direct connection to customer data.
Set up the dashboard
Enable tracking consent category
Ask your Customer Success Manager to enable the Tracking Consent Category feature at the account level. Enabling this requires instance manager rights held by the Bloomreach team. For more details, see Configuration of tracking consent.
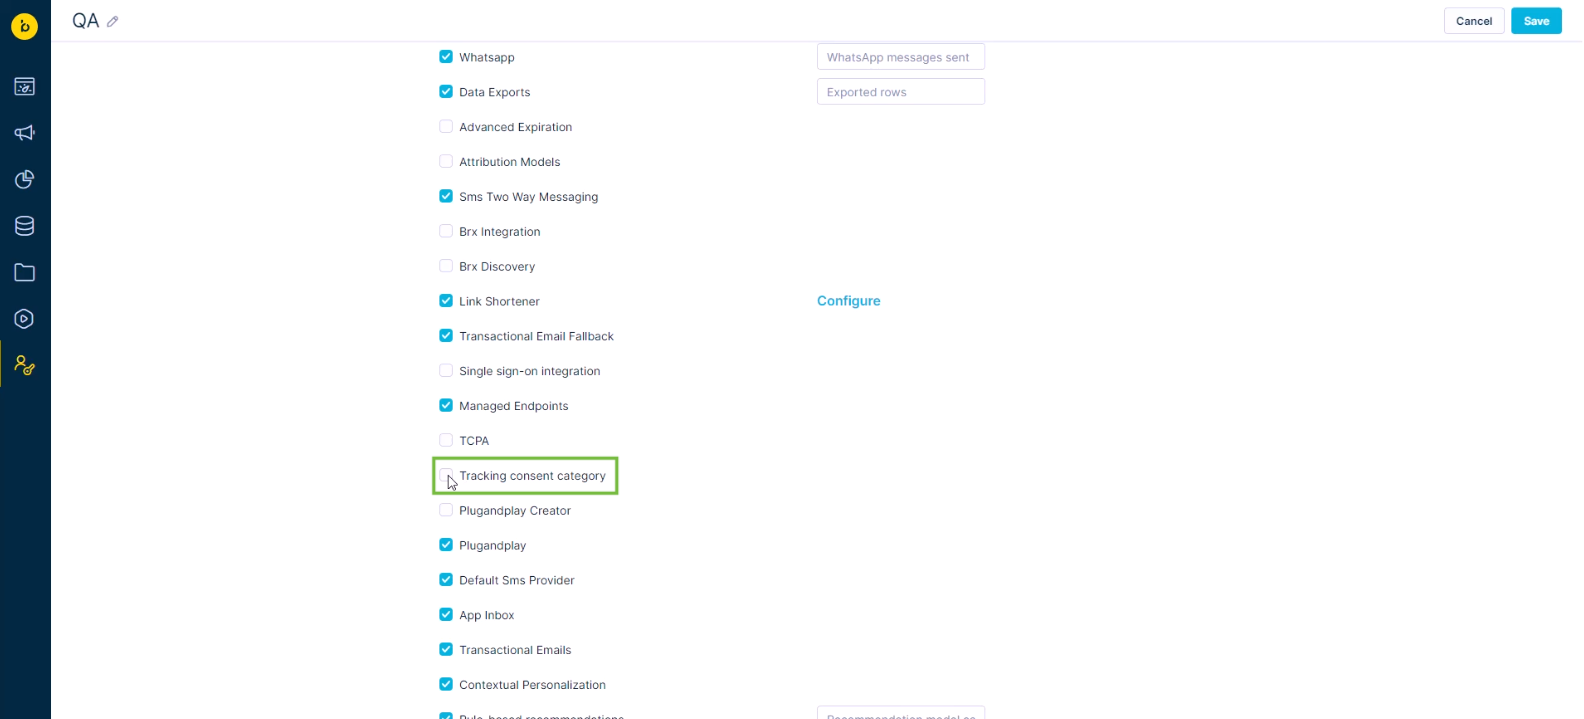
Tracking consent category setting.
Enable the dashboard
For each project you want to use this feature in, go to Project settings > Campaigns > Evaluate > Aggregated campaign dashboard and turn it on.
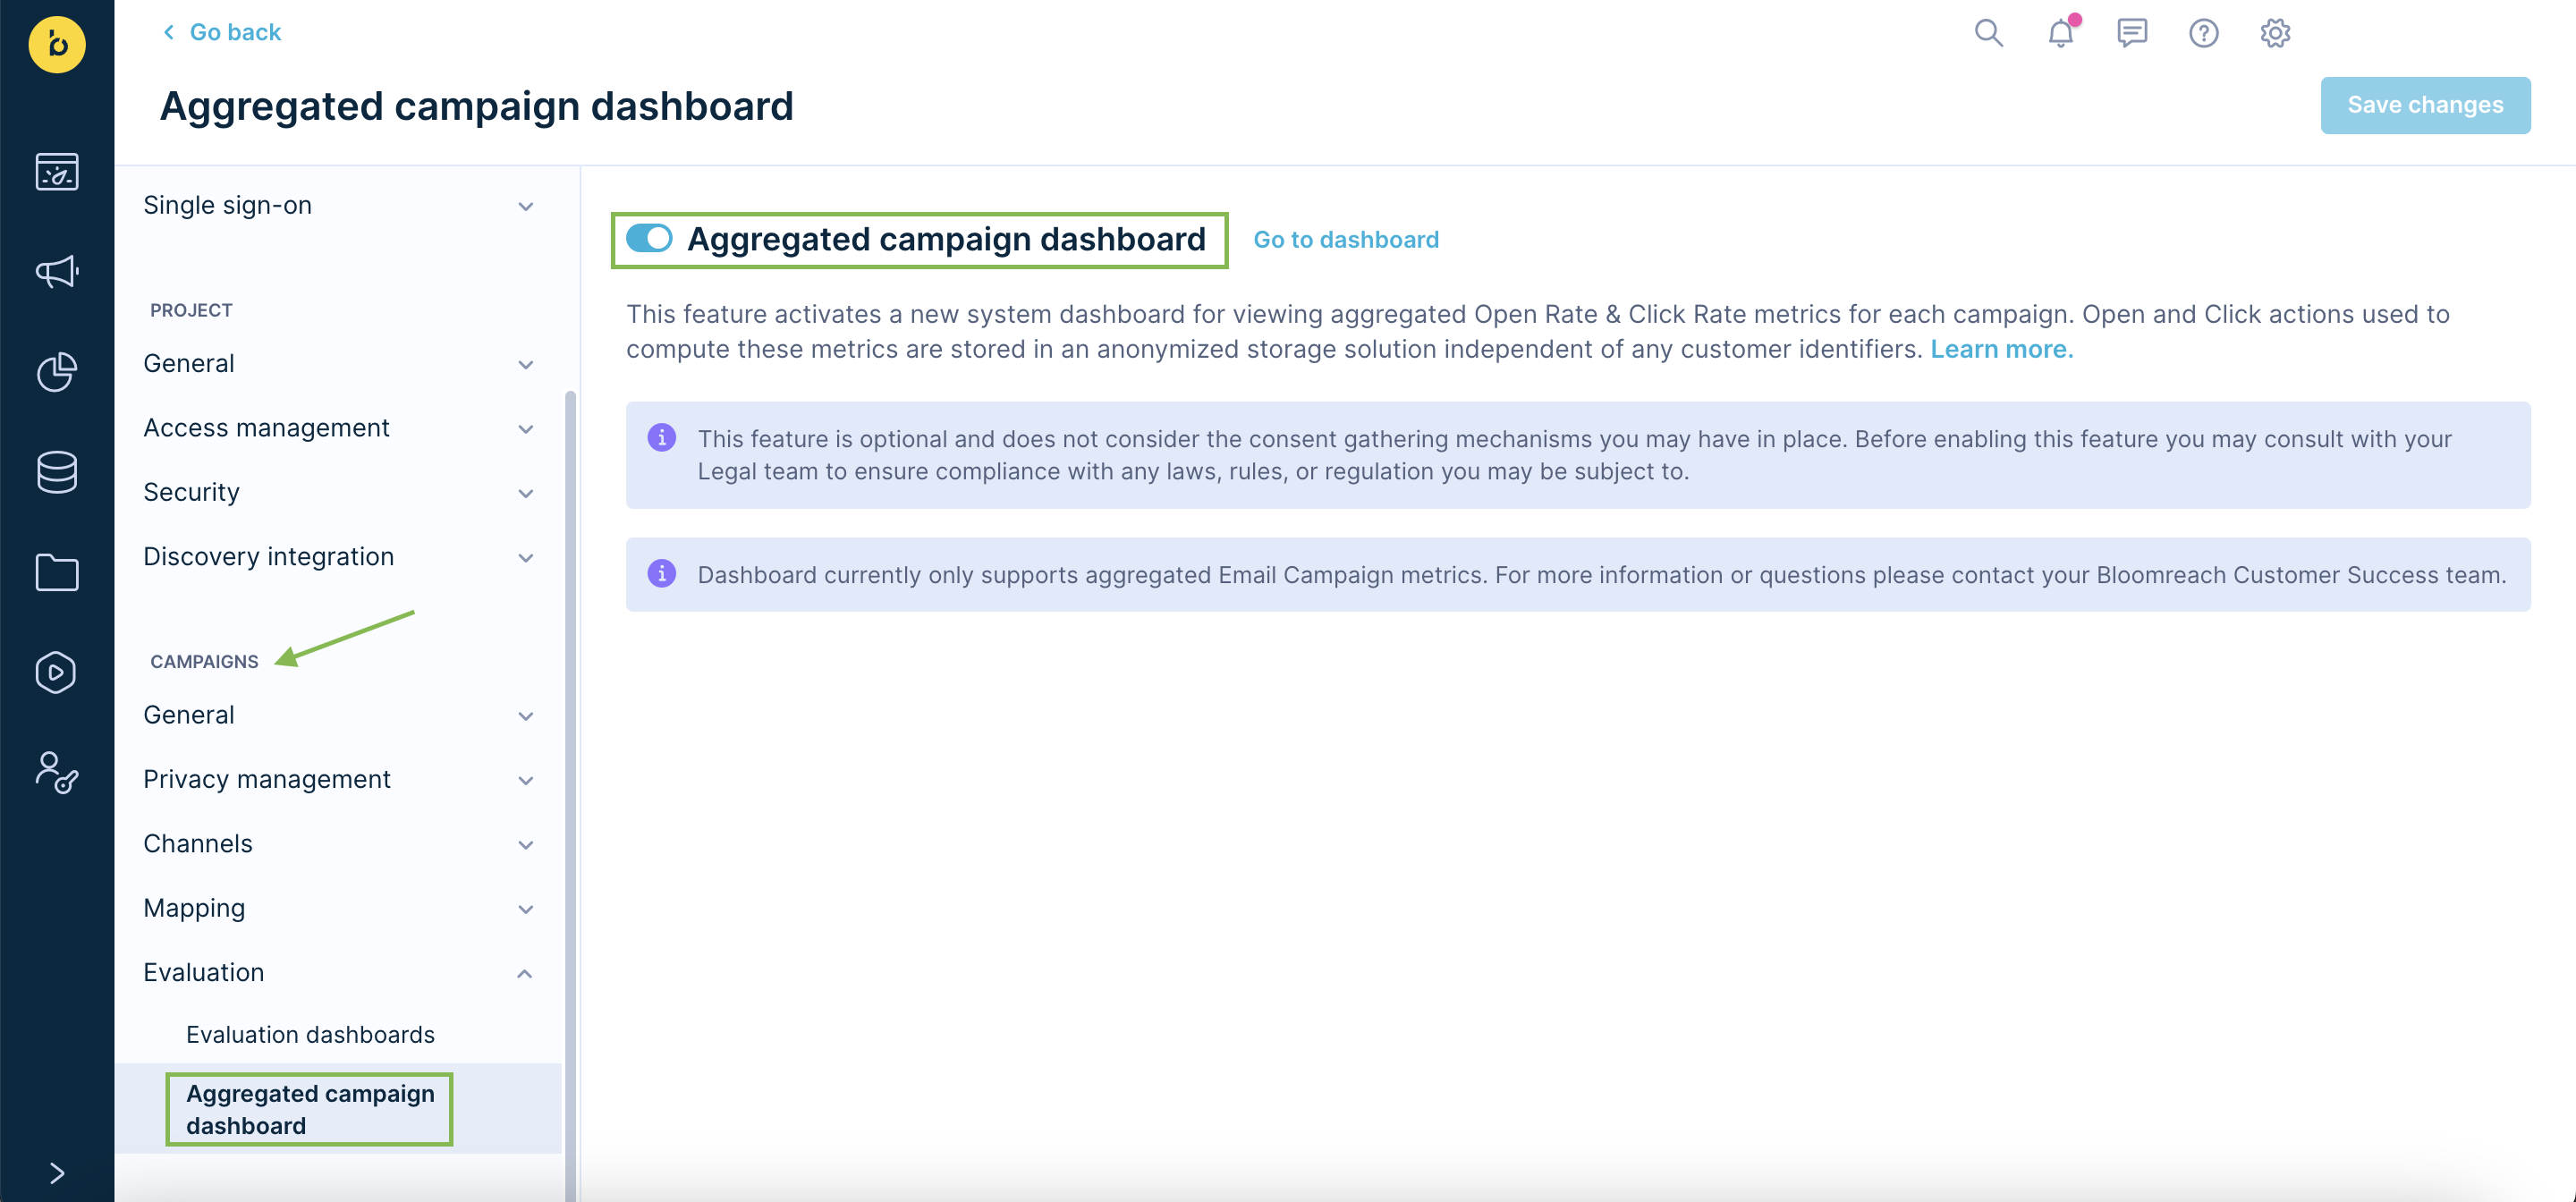
Enable the aggregated campaign dashboard in project settings.
NoteRead the terms of use and consult your Legal and Privacy teams before enabling this dashboard.
Once enabled, the platform starts aggregating open and click actions for email campaigns going forward. It doesn't collect data retroactively for campaigns sent before activation.
Use the dashboard
The dashboard appears as a new section under Dashboards > Bloomreach dashboards. It's a predefined, out-of-the-box dashboard—it can't be edited or shared.
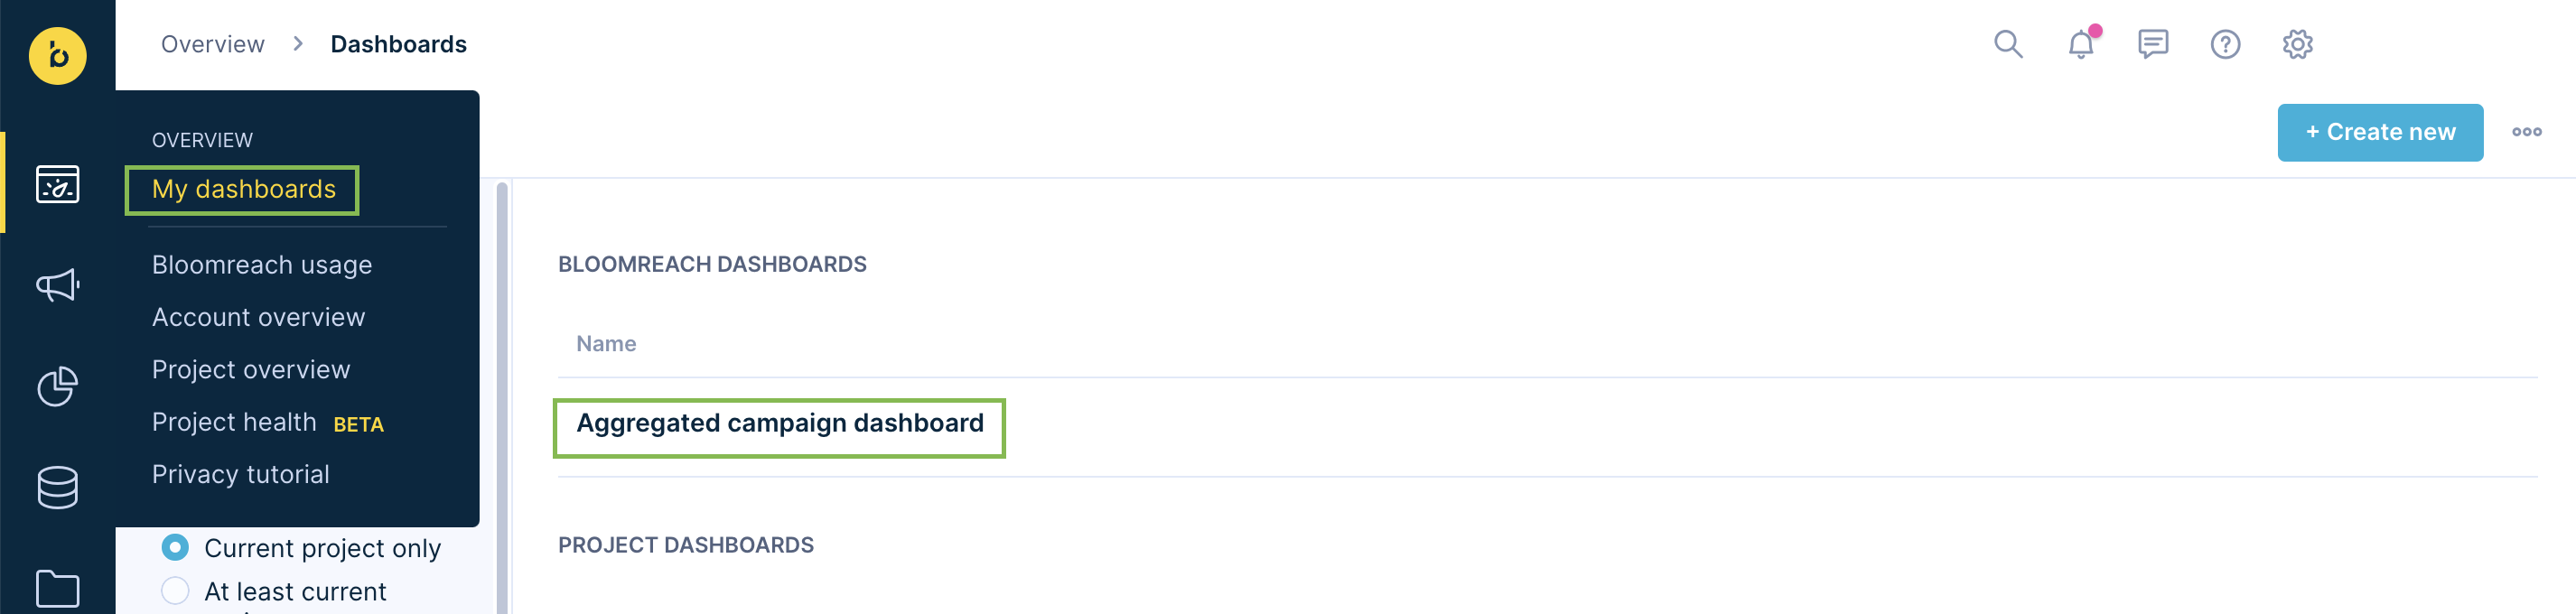
Aggregated campaigns dashboard.
Filter by time period
Filter campaigns by preset time period: 3, 6, 9, 12, or 24 months.
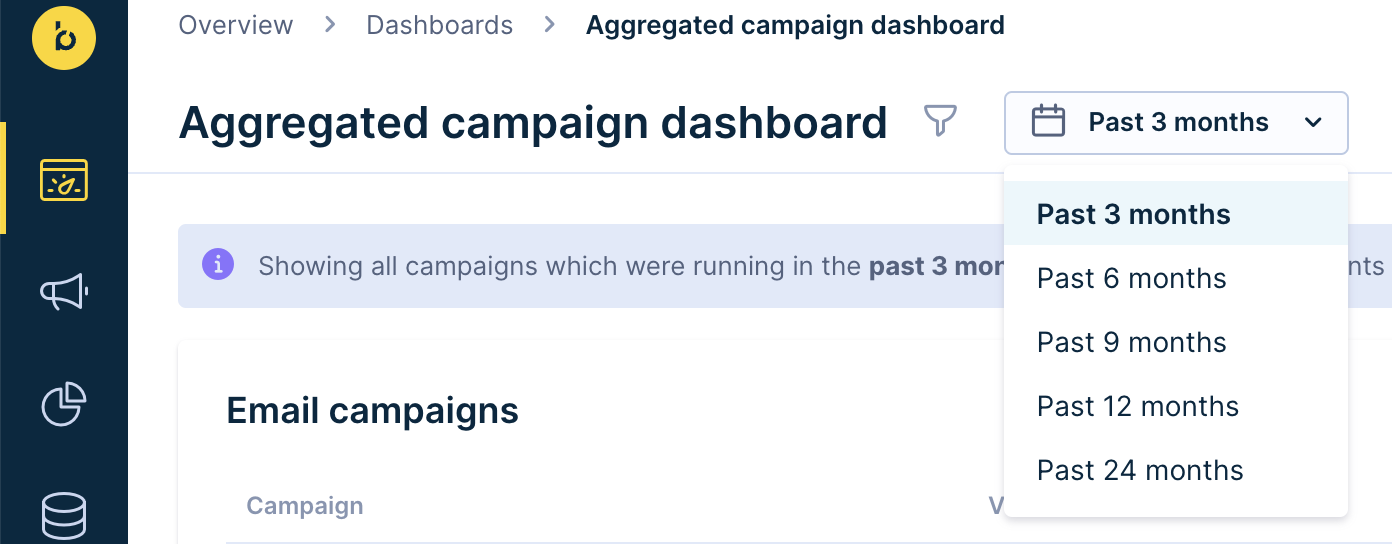
Filter campaigns by time period.
Compare campaigns
Use the dashboard view filter to narrow down specific campaigns and compare 2 or more side by side—for example, for a year-over-year analysis of Black Friday campaigns.
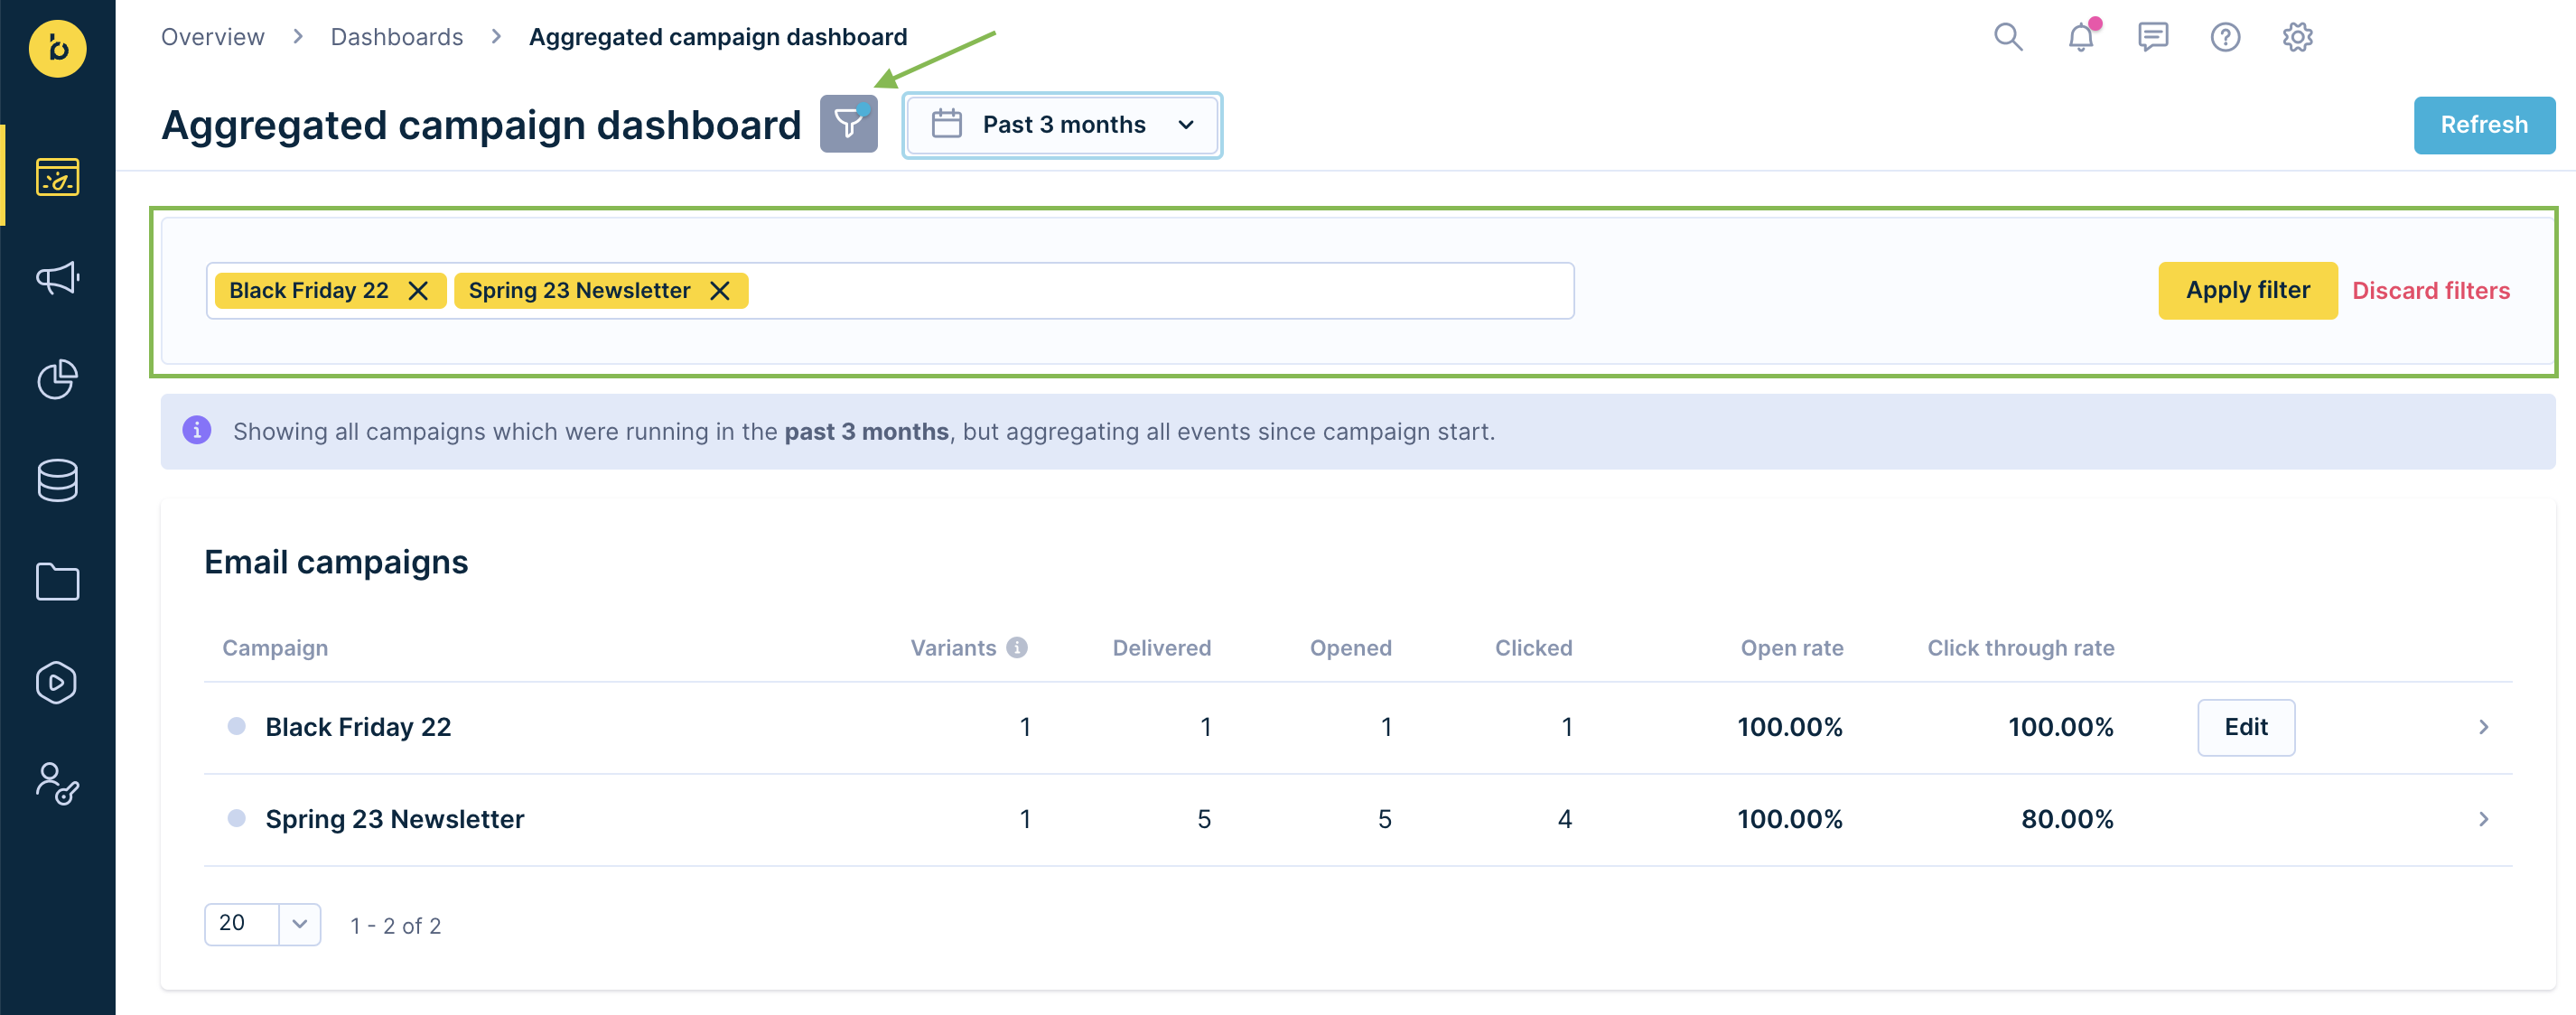
Use the view filter to compare specific campaigns.
View metrics per variant
Expand each campaign to see open and click rate metrics broken down by variant.
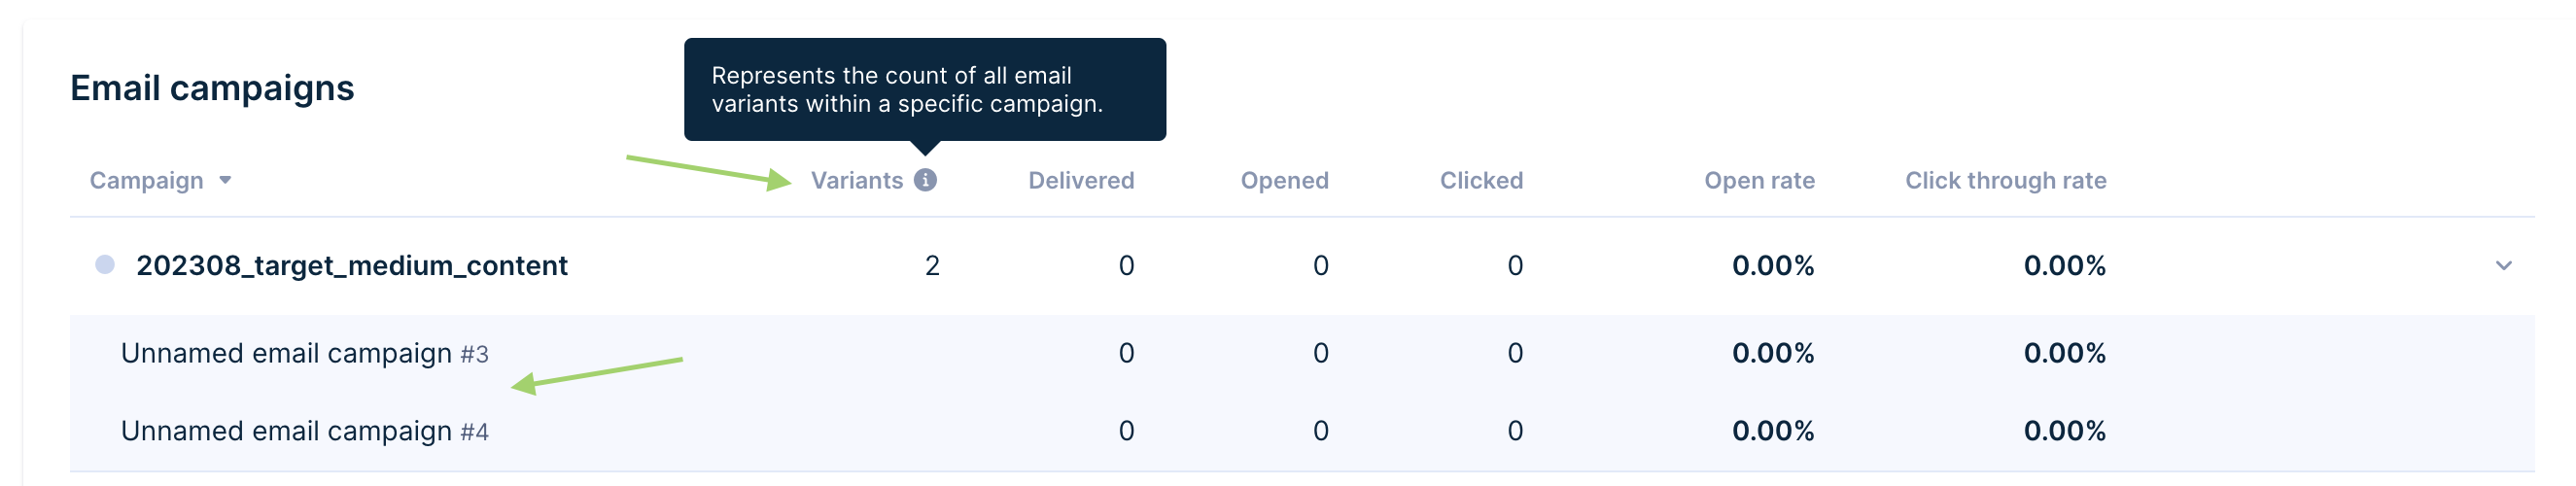
Expand a campaign to view metrics per variant.
Identify active campaigns and navigate to them
Active campaigns show a green icon next to their name. Click Edit on any row to go directly to that campaign.
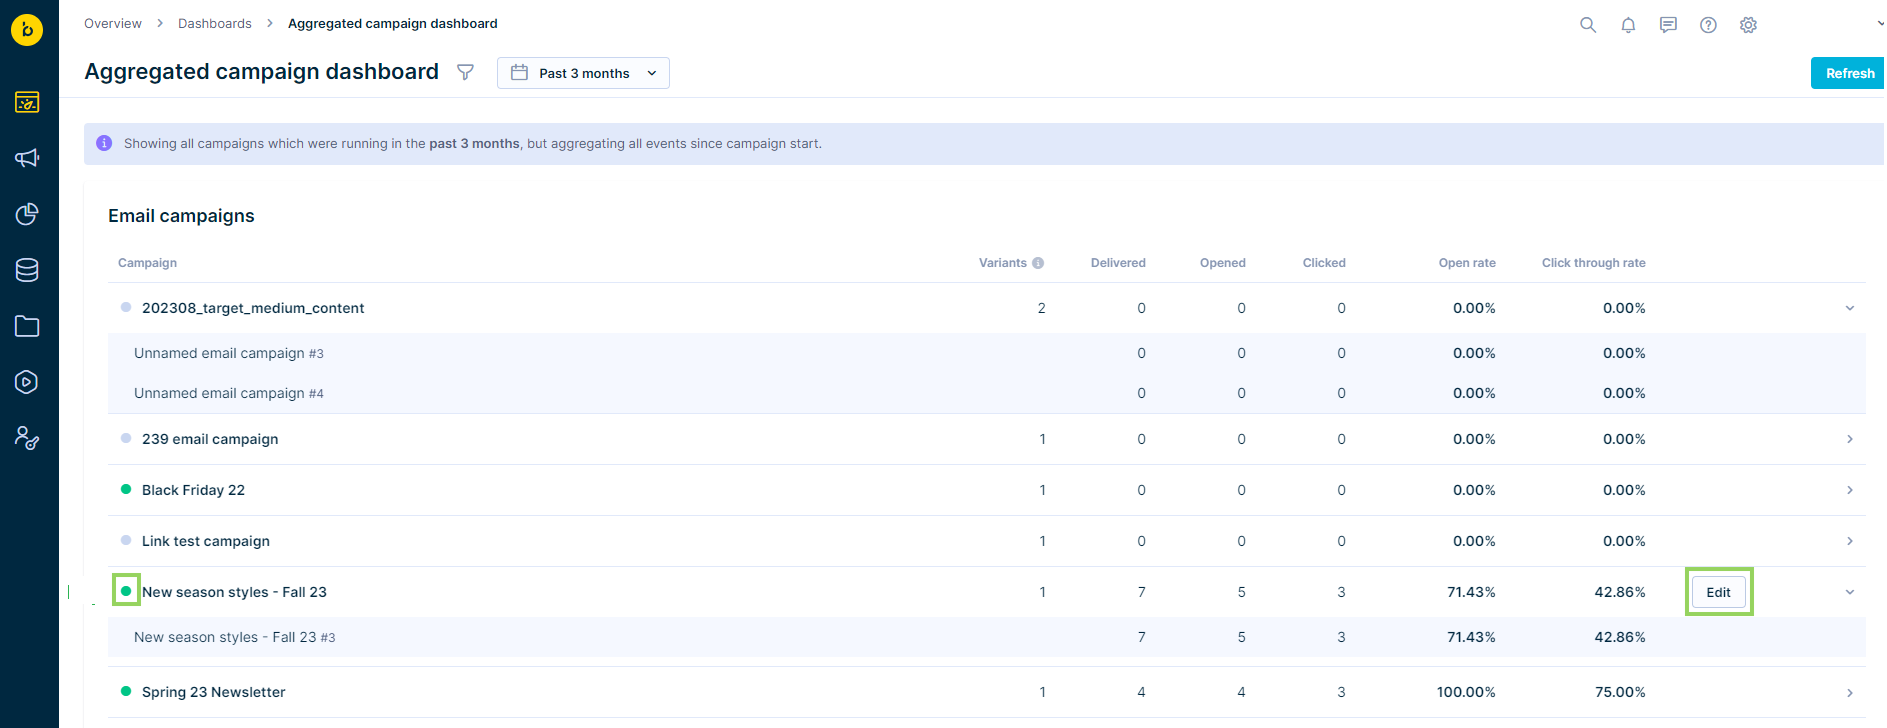
Active campaigns show a green icon. Click Edit to open a campaign directly.
Use cases
- Get a high-level view of all running email campaigns showing open rate and click rate without tracking or linking actions to customer records.
- Compare open and click rate metrics for 2 or more campaigns year-over-year—for example, engagement across 2 Black Friday campaigns.
- Avoid storing events longer than necessary when you only need long-term metrics. The dashboard retains data for up to 2 years from the last tracked action, keeping event storage under control.
Limitations
- The dashboard only supports email campaigns.
- Aggregated metrics are always calculated by summing all unique open and click actions tracked against the email node over the entire duration of a campaign.
- The dashboard can't be edited or shared.
- Aggregated data is only used to power this dashboard and isn't accessible anywhere else in the platform.
- Data collection starts from the point of activation. Open and click data from campaigns sent before activation isn't collected retroactively.
- Data isn't pushed to or accessible within EBQ.
Discrepancies in the number of events
There may be discrepancies in the exact number of events displayed in the app and in the aggregated metrics dashboards. Such discrepancies may occur due to:
- Deletion or expiration of events.
- Usage of tracking consent in the app (data is discarded while evaluating tracking consent conditions).
- Brevo (formerly Sendinblue) duplicate sendings to various endpoints.
For this reason, the data in these dashboards should be considered informative rather than definitive. The discrepancies don't influence your contracted usage or billing.
Updated 3 months ago