

A/B test basic evaluation
When you run an A/B test in Bloomreach, the platform automatically splits your audience and tracks each variant's performance. This guide shows you how to build a report that measures performance across seven key metrics and how to determine whether your results are statistically significant enough to act on.
The guide uses a weblayer campaign as an example, but the same approach applies to experiments, emails, and recommendations.
Prerequisites
Before you start, make sure you have:
- Basic navigation skills in the platform.
- Purchase event tracking set up in your project.
- The right campaign event tracked —
showfor weblayers and experiments,campaign > deliveredfor emails.
Evaluation metrics
| Metric | Description |
|---|---|
| Reach | Unique customers who saw the banner at least once. |
| Unique interactions | Customers who clicked the banner at least once. |
| Buyers | Customers with at least one purchase after being targeted, within the attribution time frame. |
| Unique conversion rate | Buyers ÷ Reach × 100 |
| Average Order Value (AOV) | Average total_price per purchase event. |
| Revenue per Visitor (RPV) | Revenue ÷ Reach |
| Revenue | Total revenue generated within the attribution time frame, starting when the customer was targeted. |
How the evaluation works
The evaluation has three parts, each built in sequence:
- Segmentation: Divides customers into three groups — Variant A, Control group, and Mixed.
- Expression: Calculates the time between a purchase and the last time the customer saw the weblayer.
- Report: Combines the segmentation and expression to display the seven metrics.
The report measures purchase behavior within 24 hours of a customer seeing the weblayer and compares it to the control group over the same period.
Create segmentations
The segmentation splits customers into three groups for comparison:
- Variant A: Customers who were shown the weblayer.
- Control group: Customers who didn't see anything.
- Mixed: Customers who saw the weblayer but also fell into the control group. See the FAQ to understand why this happens.
- Go to Analyses > Segmentations and create a new segmentation.
- Create the first segment and name it Mixed. Set the conditions to include customers who match both the variant and the control group funnel conditions.
- Copy the Mixed segment twice.
- In one copy, delete the control group funnel condition. Name it Variant A.
- In the other copy, delete the variant funnel condition. Name it Control group.
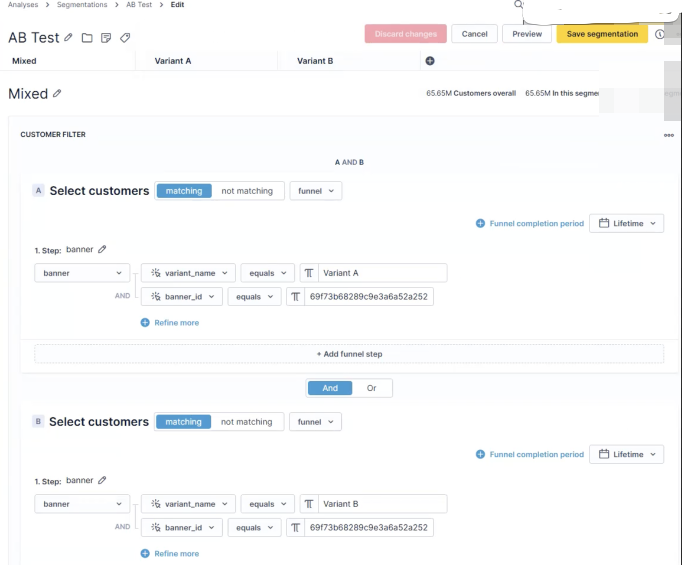
ImportantKeep the Mixed segment first (on the left). The segmentation logic depends on this order.
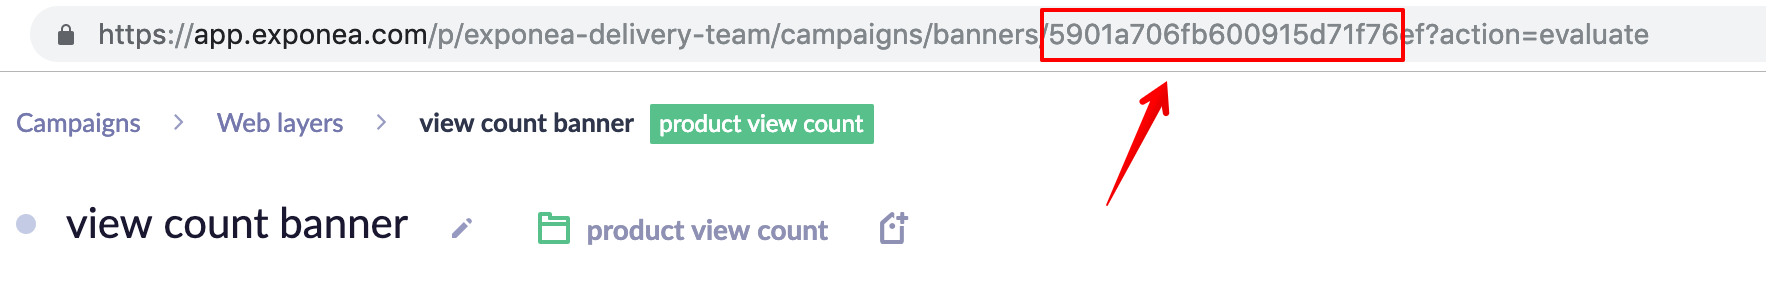
Find banner ID
Open your weblayer and copy the ID from the URL. Use the banner_id in your segment conditions — not the banner_name. If multiple campaigns share the same name, the analysis breaks. IDs are always unique.
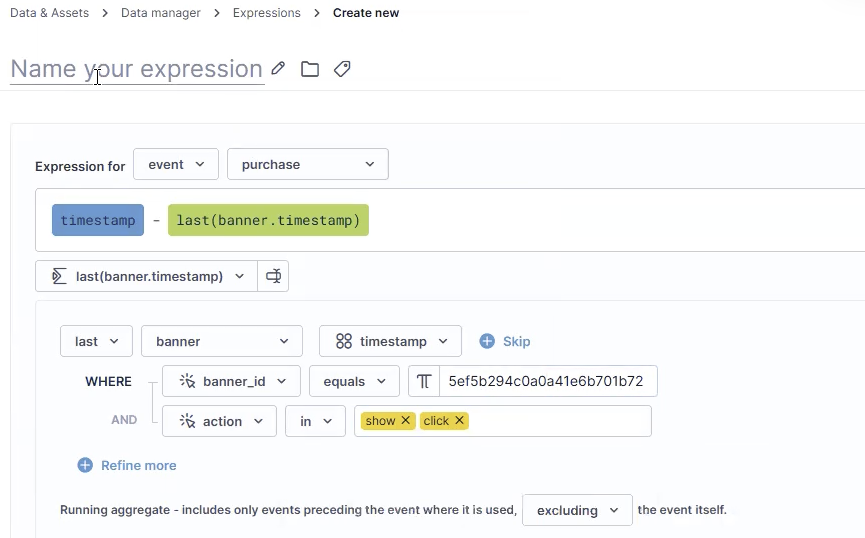
Create an expression
This expression calculates the time difference, in seconds, between each purchase and the last time the customer saw the weblayer. It's what makes the attribution window work in the report.
- Go to Data & Assets > Data manager > Definitions and create a new expression.
- Set the expression to apply to the
purchaseevent. - Add the
timestampattribute. - Add the
-arithmetic operator. - Click + Add attribute and create a running aggregate. Set it to return the
timestampof the lastbannerevent, filtered to your weblayer'sbanner_id, with action set toshoworclick. - Save the expression.
Create a report
The report brings together your segmentation, expression, and seven metrics into a single view.
-
Go to Analyses and create a new report.
-
In Rows, add your segmentation.
-
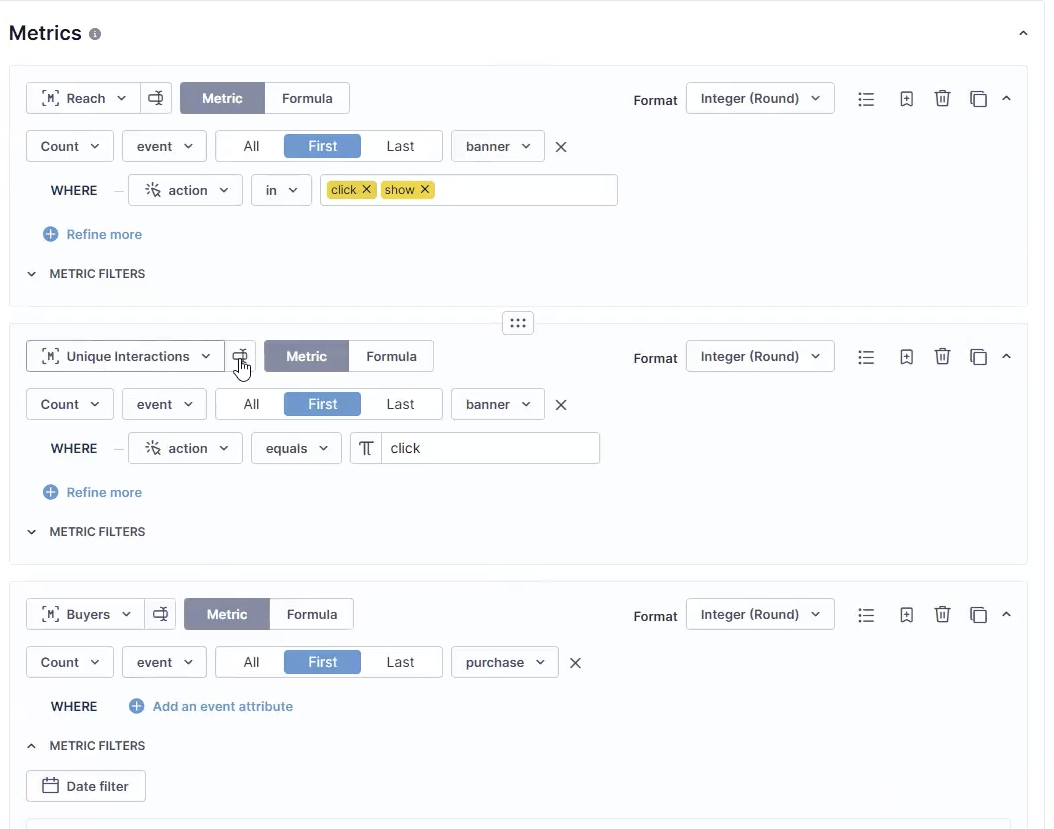
Create the Reach metric. Count the first occurrences of the
bannerevent withactionattribute set toclickandshow.
- Create the Unique Interactions metric. Count the first occurrences of the
bannerevent whereactionequalsclick.
- Create the Buyers metric. Count unique customers with a
purchaseevent. Each customer is counted once, regardless of how many purchases they made. To save time, duplicate the Reach metric and edit it.
-
Create the Unique conversion rate metric. Copy the Buyers metric and apply this formula:
(buyers / reach) × 100. Format it as a percentage.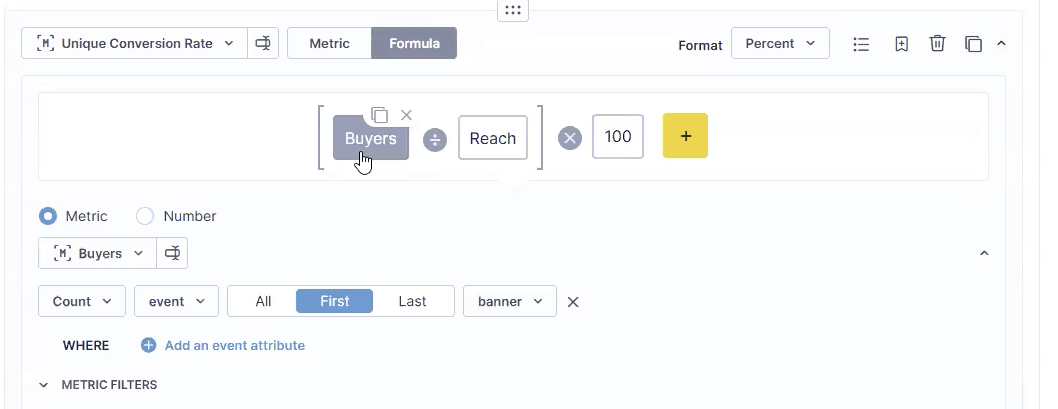
-
Create the Revenue metric. Set the event to
sumpurchaseand the attribute tototal_price. In Format, add the currency attribute if your project tracks it. -
Create the AOV metric. Set the event to
avgpurchaseand the attribute tototal_price -
Copy Revenue to create the RPV metric. Set the formula to:
revenue (sum_event_total_price) / reach (event_banner_first). -
In the Customer filter, exclude the Mixed segment.
-
In the Event filter, add a filter for the
bannerevent and specify your weblayer'sbanner_id. This filter applies to all banner metrics in the report. -
Add a second condition to the event filter for the
purchaseevent. Use your expression and set the condition to less than86400— that's 24 hours in seconds. This scopes attribution to purchases made within 24 hours of seeing the weblayer.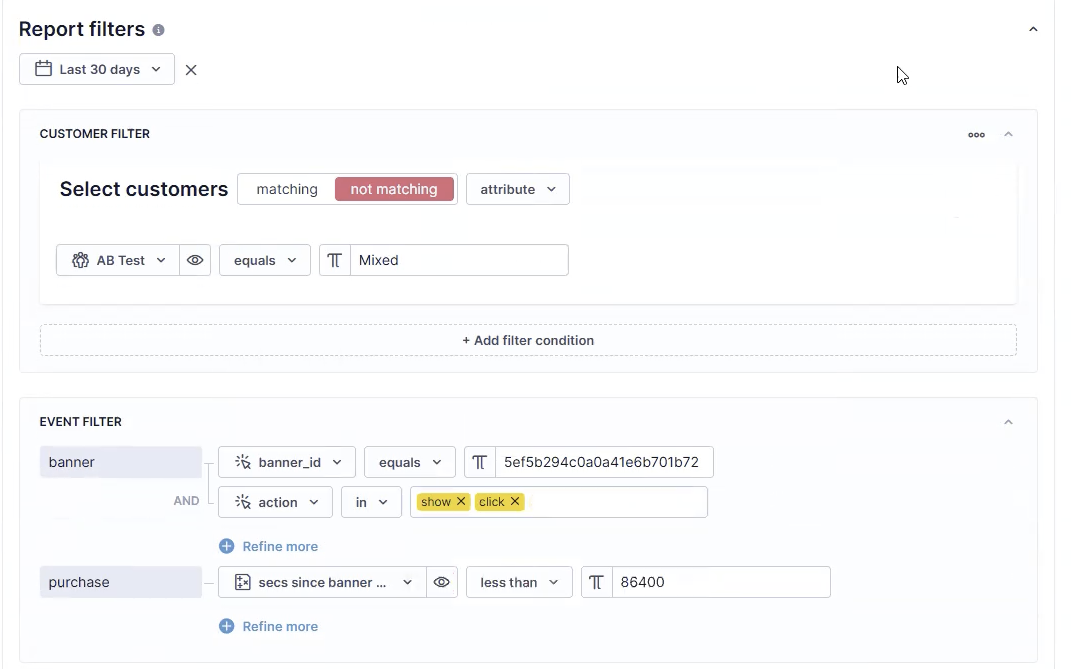
-
Click Preview to check the results. Use the six-dot icon to drag and reorder metric columns.
Report structure
| Rows | Your segmentation (Variant A, Control group, Mixed) |
| Columns | None |
| Metrics | Reach, unique interactions, buyers, unique conversion rate, AOV, RPV, revenue |
| Customer filter | Excludes the Mixed group from the evaluation. |
| Event filter | Scopes metrics to your weblayer and sets the attribution window. |
NoteTo calculate absolute revenue uplift — the revenue difference between Variant A and the control group — use this formula:
(RPV Variant A − RPV Control group) × Reach Variant A
Interpret your results
Compare Variant A against the Control group across all seven metrics. A few patterns to know before you draw conclusions:
Unique conversion rate and RPV can point in different directions. A variant can show a higher unique conversion rate but lower RPV — meaning it converted more people but for smaller purchases. RPV is the more reliable indicator of business impact. Base your decision on RPV rather than unique conversion rate alone.
A small absolute difference can still matter. Even a fraction of a percentage point in unique conversion rate translates to meaningful revenue at scale. Use the A/B test significance calculator to check whether the difference is large enough to be reliable given your audience size.
Wait for sufficient sample size before deciding. If your reach counts are low, a result that looks conclusive may be noise. A confidence level of 95% or above is the threshold for acting on a result.
Evaluate statistical significance
The report shows raw numbers — reach, buyers, and revenue per variant. Before acting on the results, check whether the difference between your variants is statistically significant.
Use the A/B test significance calculator to determine whether your results are reliable. Enter the audience size and conversion count for each variant. The calculator shows the confidence level and which variant performed better.
For in-platform analysis, use the Compare conversions tool in Funnels. It runs a Chi-Square test on your funnel data and shows statistical confidence between variants. See Compare conversions for details.
FAQ
Why does the Mixed segment exist?
When a customer first sees your campaign, the app assigns them to either the variant or the control group. That assignment sticks. If they come back on the same device, they stay in the same group.
The issue arises when a customer switches devices or uses an incognito window. The app sees a new cookie and treats them as a new customer, potentially assigning them to a different group. When they log in — say, during checkout — the app recognizes them and merges the two profiles.
If those two sessions landed them in different groups, you can't reliably attribute their behavior to either one. They go into the Mixed segment and get excluded from the evaluation.
Why don't I see my expression or aggregate in the attribute list?
You need to create the expression or aggregate in Data & Assets > Data manager > Definitions first, then come back to the report to select it. If you built it elsewhere in the app, it won't appear in the list.
Updated 17 days ago