Segmentations
Segmentation is a powerful technique that allows you to divide customers into smaller groups based on common characteristics or activities. These could include demographics, interests, purchasing behaviors, or any other factors that can help you understand how these groups differ from each other.
If you want to segment events, read our article about event segmentation.
Watch this video to get an overview of the basic features of segmentations. The text covers everything.
Interactive tour
Learn how to use real-time data to build hyper-targeted segments, and use them for reports, campaigns, and personalization with an interactive tour.
E05 16 steps, 3 minutes
Why should you use Segmentations?
Segmentation is essential for e-commerce businesses looking to gain a competitive edge.
Segmenting allows you to
- better understand the needs and preferences of different groups, helping you tailor products and services to meet the specific needs of each group
- identify trends and patterns among different groups of customers, driving data-based decisions about how to market and sell your products
- explore potential opportunities for growth and expansion, such as by identifying untapped markets or by developing new products and services
By grouping your customer base, you can create personalized marketing campaigns, optimize your product offerings, and drive better results. With the right segmentation strategy, you can outshine the competition!
Group customers based on any metric: their generated revenue, engagement, activity in your business, or funnels they have completed. Visualize segments, see movements between segments in time, calculate aggregated data (e.g., total revenue for different segments), or target customers through scenarios; segmentations have unlimited potential! You can also use saved segmentations from other analyses to compare the performance of different groups, e.g. in A/B testing.
How to Create a Segmentation
1. Create a new Segmentation

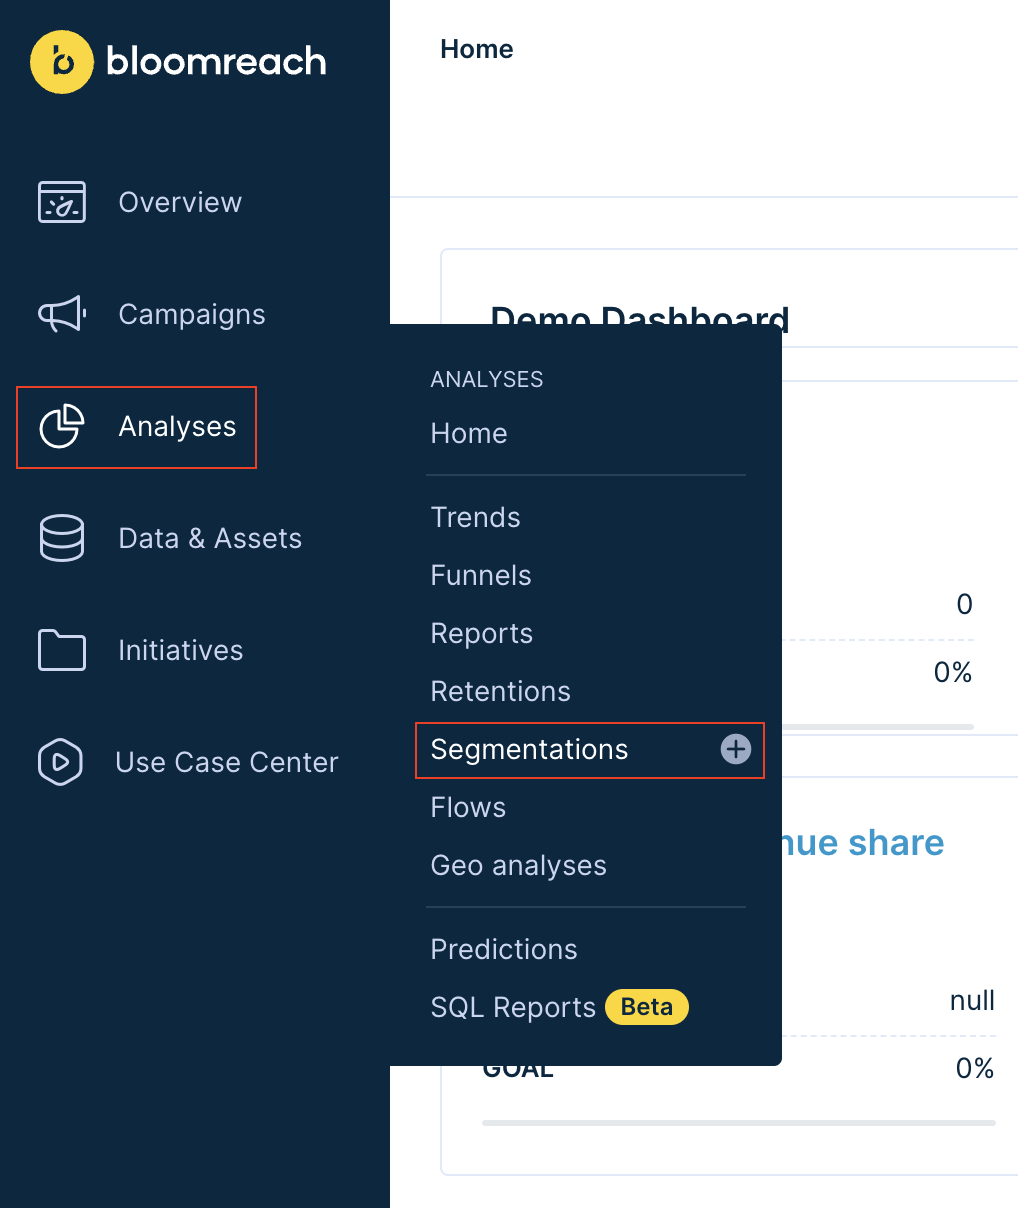
a. Navigate to Analyses -> Segmentations.
b. Click on the + sign next to the Segmentations item in the drop-down menu.
c. You will now see the edit window with a new, empty funnel step.
2. Navigate the Segmentation Editor

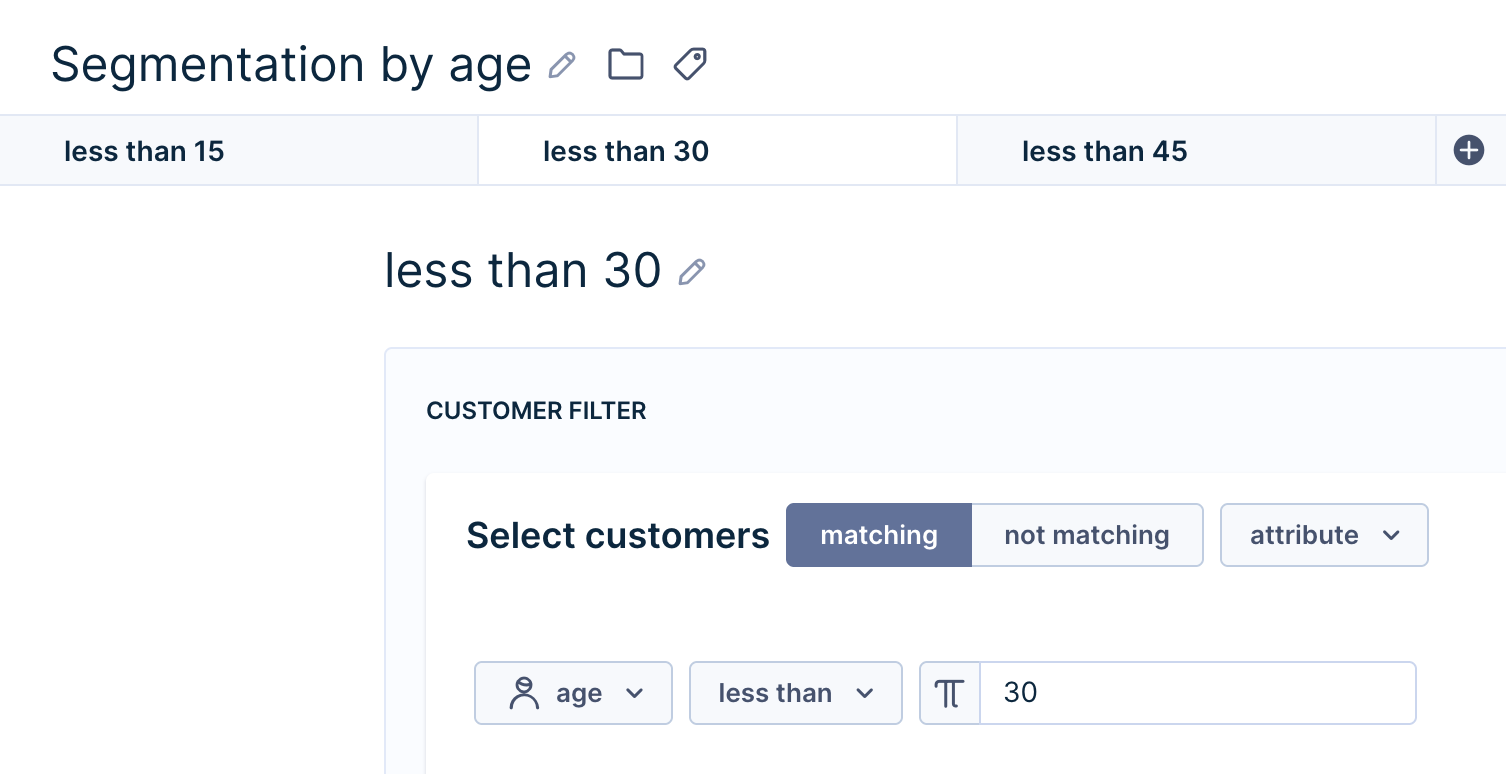
Analogous to a web browser, the Segmentation Editor consists of a bar with tabs at the top and their Customer Filter contents below.
a. Create a new segment by clicking on the blue + sign next to the tabs.
b. Edit an existing segment by clicking on a tab.
c. Hover your mouse pointer over a tab to reveal a copy sign and x sign.
d. Click on the copy sign to duplicate the segment.
e. Click on the x sign to delete the segment.
f. Define each segment by using the customer filters.
3. How to use segmentations in Bloomreach Engagement
Order of the segment tabs matters
Each customer can only belong to one segment within a segmentation. If they fulfill conditions of more, they will be placed in the first applicable segment, starting from the left. So, in the example below, a customer aged 14 would be placed only in the first segment on the left ("less than 15"), even though they technically satisfy the conditions of all segments. Similarly, if we moved the "less than 30" segment to the first place on the left, the customer would fall into this segment.

The segmentation will become a customer attribute
Once we save the segmentation above, this will create a new customer attribute called Segmentation by age with 3 possible values: less than 15, less than 30, and less than 45. This attribute will have no value for customers that don't belong to any of these segments. The segmentation will be visible in the list of customer attributes in the customer profile and when working with analyses, filters, etc.
Other Settings
Date Filters
Date filters allow you to specify the start and end dates for which the segment is created. Customers change segments over time, and this feature allows you to observe their movement. You can observe the changes in the segmentation movements panel.
To learn more about Date, Customer, and Event filters, read our Filtering data article.
Profile metrics
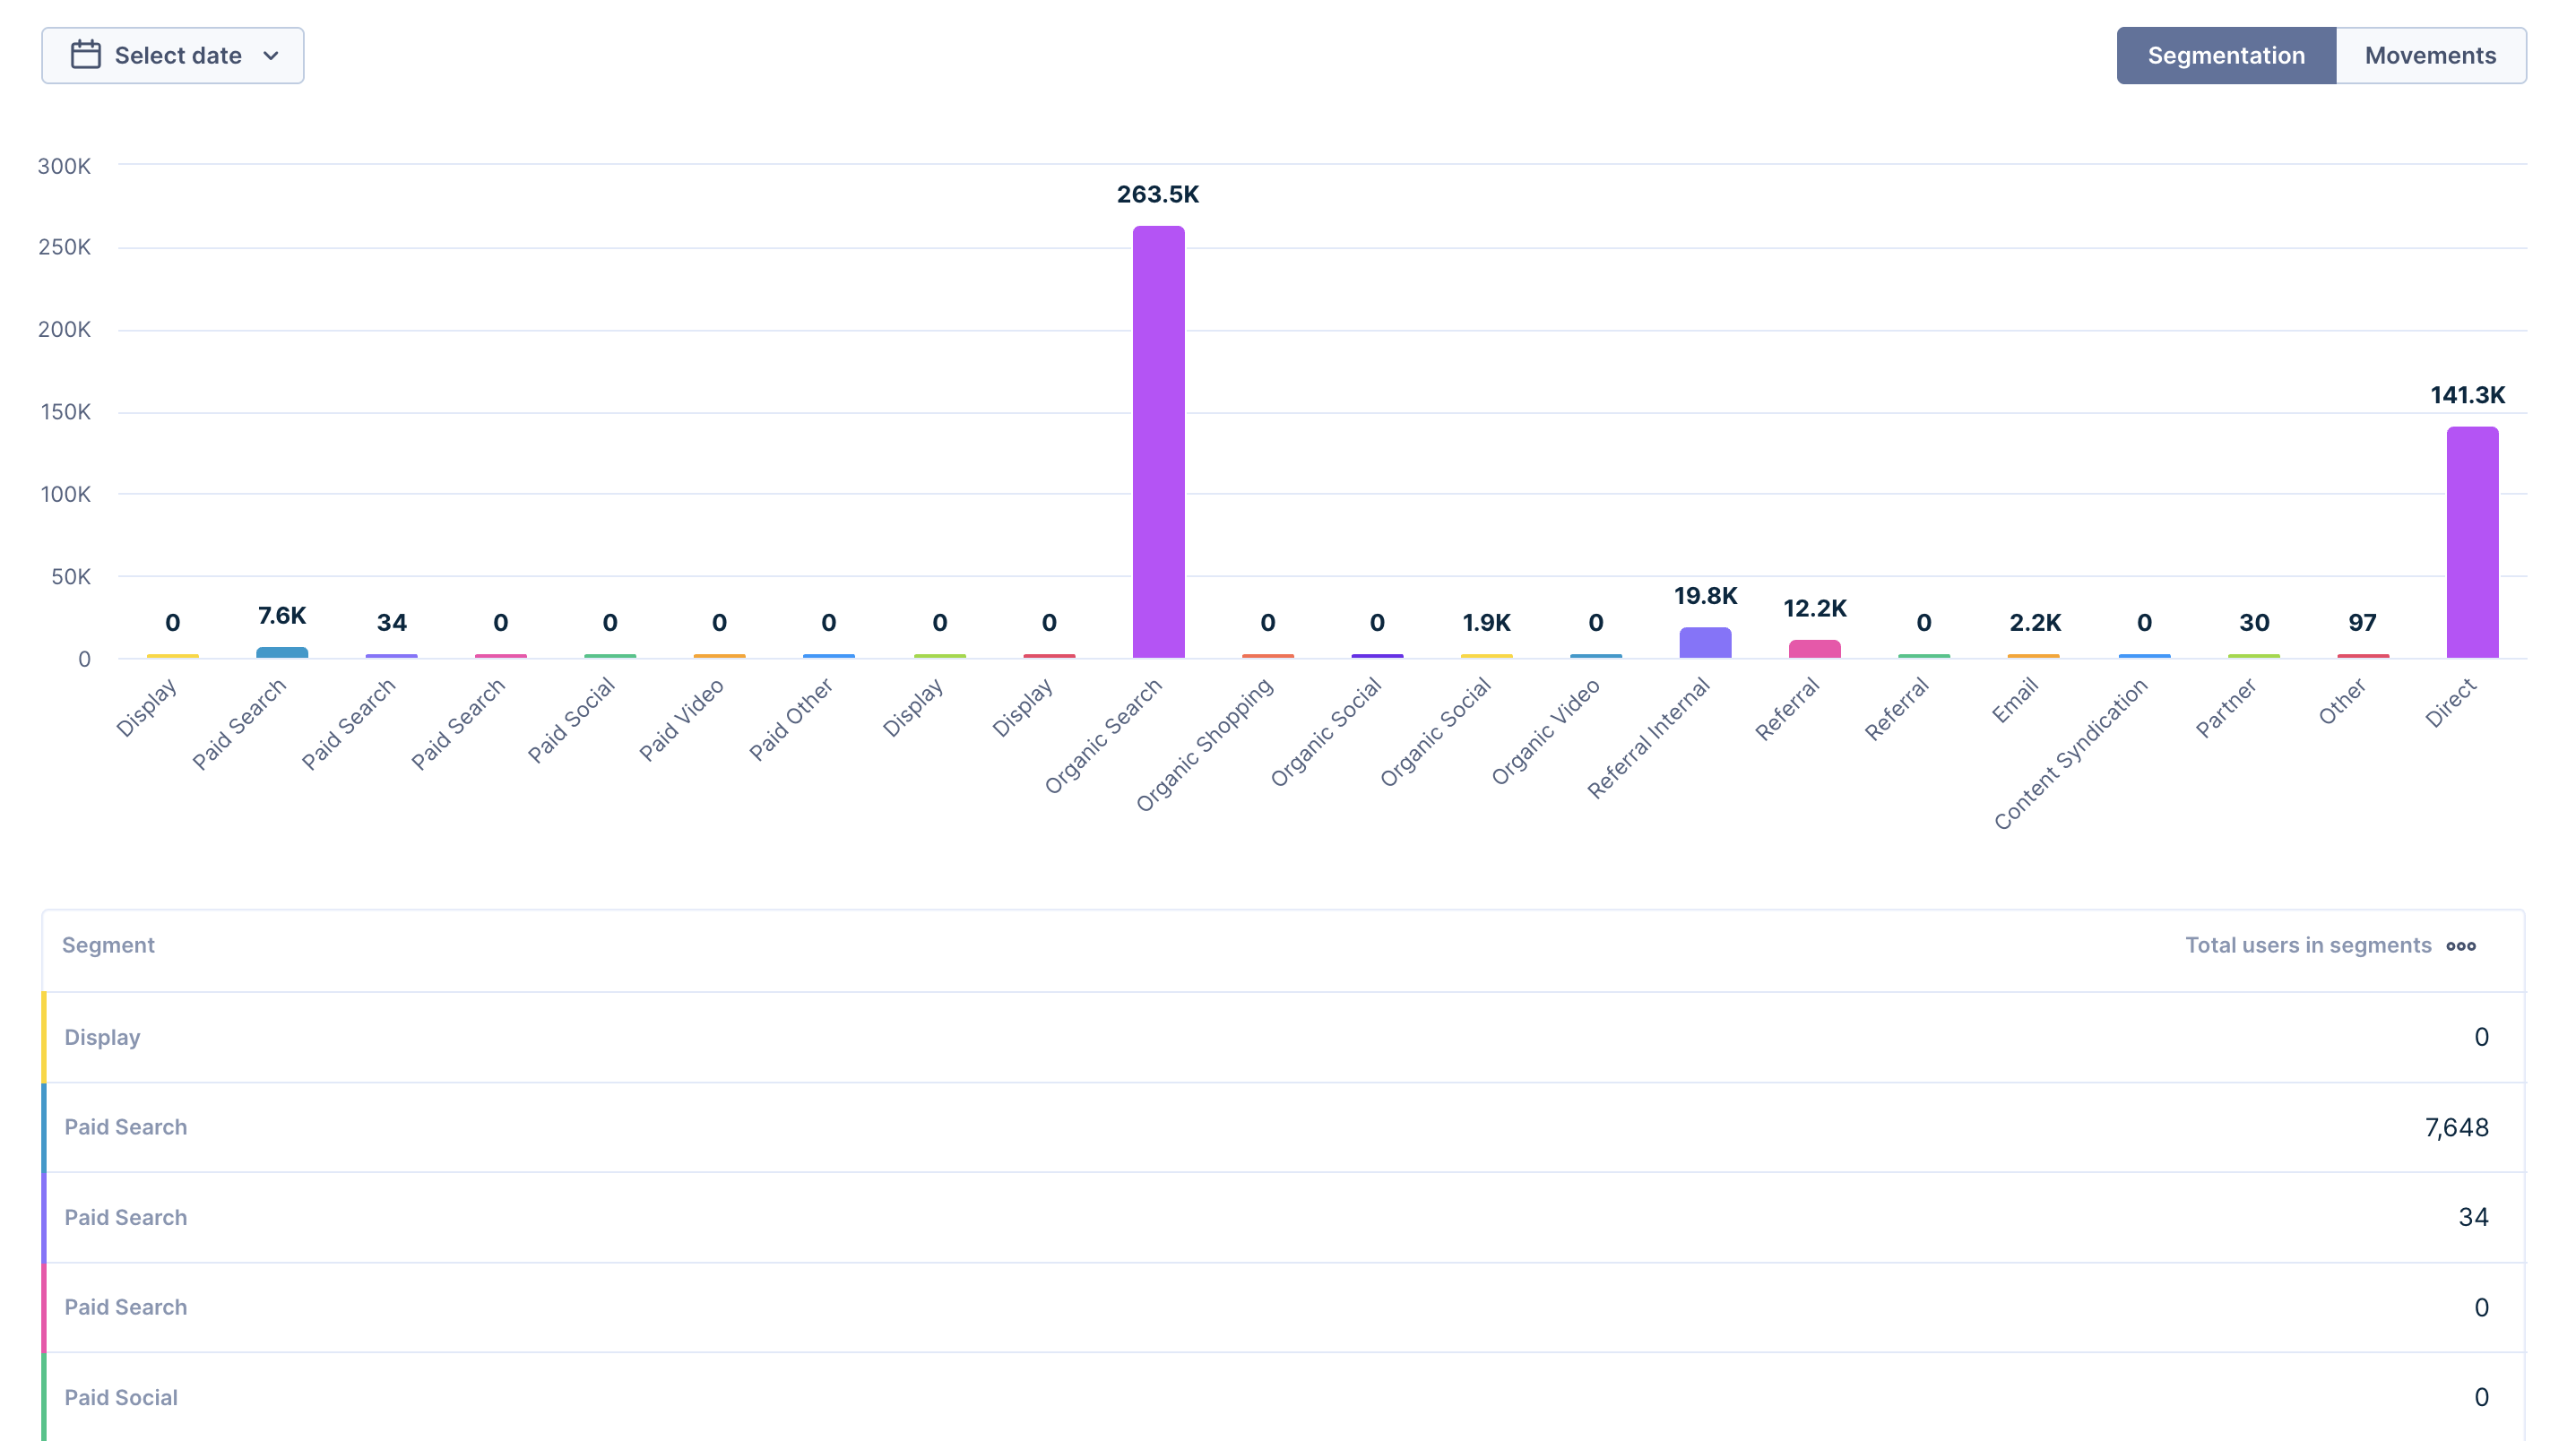
By default, your segmentation schema shows the number of customers for each segment in the table below the chart. Adding profile metrics will allow you to view other metrics in this table, such as the Average Purchase Item Price or Average Order Value.

Click on a segment in segmentation map or segment distribution charts to perform actions as:
- Show customers in the segment
- Send a campaign to a given segment
- Use for prediction (experimental)
2D and 3D Visualizations of your Segmentation Schema
Click on a metric and assign them to either the X or Y axis to create a 2D visualization of the segmentation schema. Another name for this visualization is segmentation map.
Assign the volume of a metric to the Z axis to control the sizes of the bubbles.
Movements
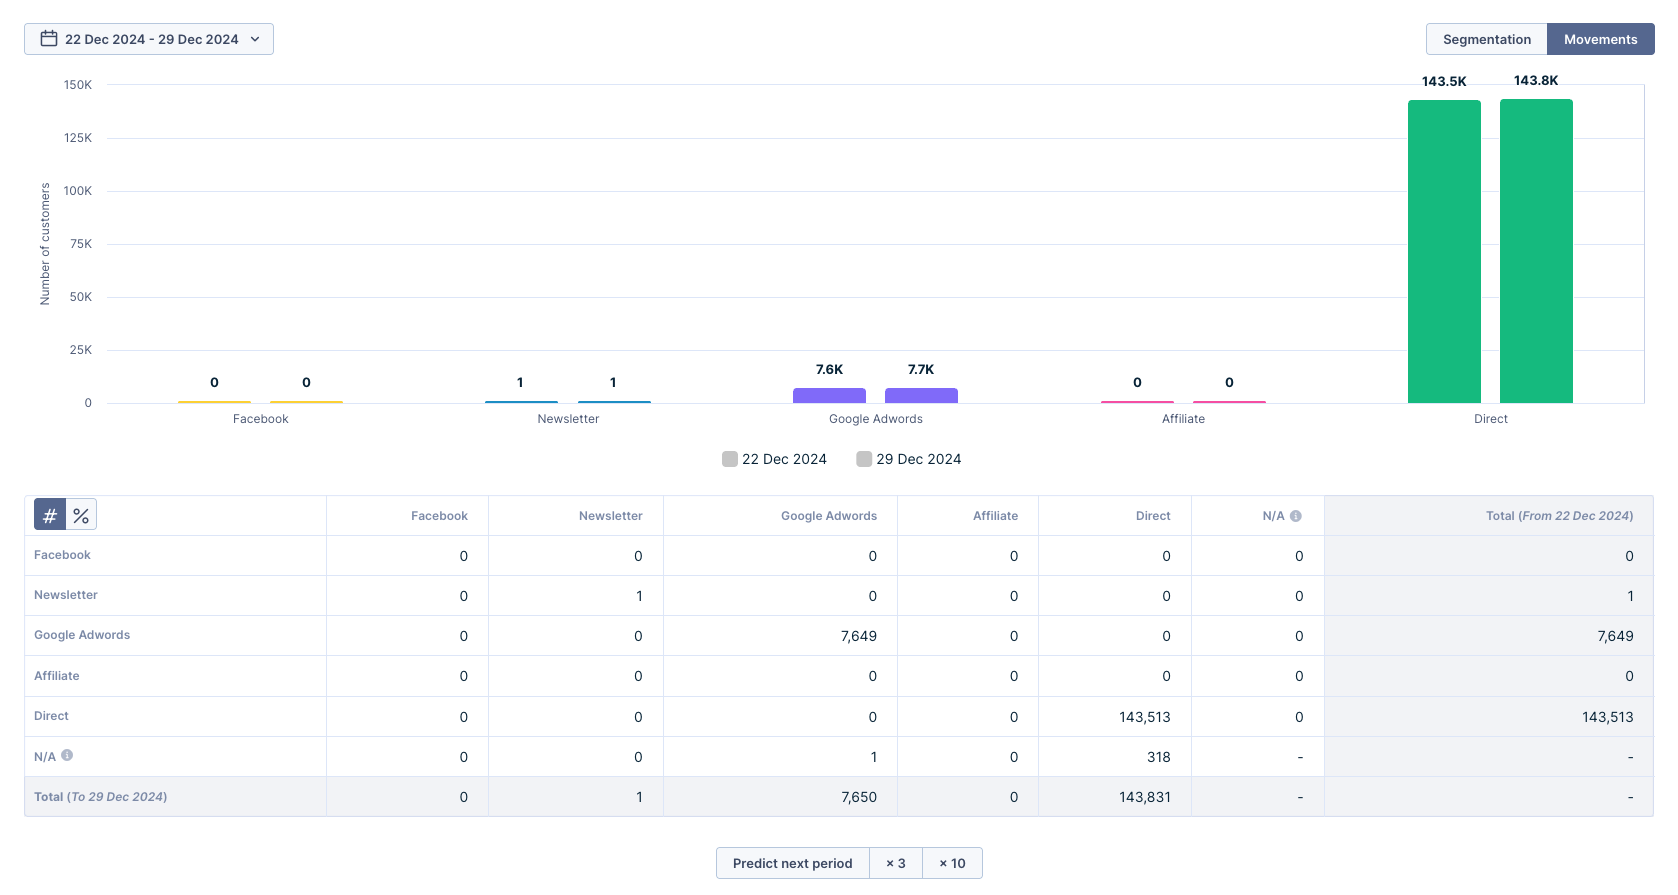
The attributes of customer events, particularly aggregates, can change over time and cause customers to move from one segment to another. The From -> To table feature displays these movements.
Your segments' start and end dates will be the baseline period. Bloomreach Engagement will calculate the number of customers in the previous period of these segments and will predict the trend for the next period. Every time you edit the movement, e.g. by changing the start and end date, the segmentation will be recalculated using the current definition.

Movements require event-based conditions. Therefore, the movement feature for segmentation with customer properties will not work.
Use Case examples
There are many specific Use Cases that can benefit from the use of segmentations in e-commerce analytics.
Some examples include:
- identifying the most valuable customer segments based on their purchase history which allows you to focus your marketing efforts on retaining and acquiring more customers from key segments. Visit the technique of segmenting customers based on the recency, frequency, and monetary value of their purchase in our RFM Segmentation Use Case.
- developing targeted marketing campaigns that resonate with specific segments of your customer base thanks to information about their interests and preferences
- timing your marketing efforts efficiently by identifying usual purchasing patterns. Understand how to deploy the Use Case in our Time Between Purchases article.
- optimizing product offerings by identifying gaps and developing new products to meet the needs of specific segments
Updated 24 days ago
Learn how to clone your segmentation into another project that you have access to in our Cloning article or try creating a segmentation in our Purchase Frequency Segmentation Use Case!
