
Analyses
This guide walks you through Analyses — a set of tools for understanding your customer data.
Analyses is a set of built-in tools that lets you explore, segment, and visualize your customer data. Use it to understand how customers behave, spot patterns over time, and present your findings in formats that are easy to read and share. To filter and interact with data across your analyses, see Parameters.
Access analyses
To access Analyses, open the main menu and select Analyses.
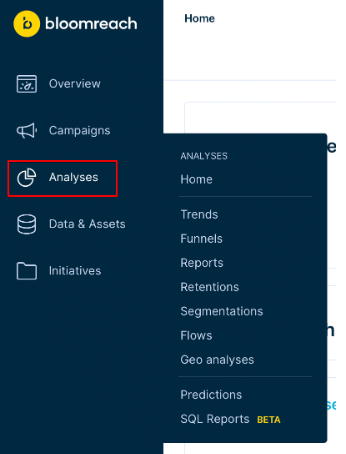
The Analyses section in the main menu.
Available analyses
The table below outlines each available tool, what it does, and when to use it. To learn more about a specific tool, visit its dedicated page in the subsections.
| Tool | What it does | When to use it |
|---|---|---|
| Dashboards and Custom evaluation dashboards | Displays key metrics and trends. | Present your most important data in one place. |
| Trends | Plots the occurrence of a given event on a timeline. | Visualize the frequency of events. |
| Funnels | Plots the number of customers progressing through a sequence of events. | Observe a customer's step-by-step journey toward a specific outcome. |
| Reports | Summarizes your data in a grid table using a custom metric. | Compare metrics across different segments or time frames in a structured table view. |
| Retentions | Shows a timeline of when an event occurs after an anchor event. | Measure the rate at which customers return after a specific action, such as a first purchase or sign-up. |
| Segmentations | Displays a chart of specified customer subgroups. | Group customers based on their attributes and behavior. |
| Flows | Displays a diagram of possible customer journeys. | Understand how customers navigate your website. |
| Geo analyses | Displays a map of locations where a given event occurred. | Explore the geographical distribution of your customer base. |
| Predictions | Evaluates customer behavior using artificial intelligence. | Predict how customers are likely to behave. |
| SQL reports | Queries external data sources using SQL or a visual query builder, and displays results alongside your Bloomreach data. | Show results when your report relies on external data. |
Analytics and reporting template library
The analytics template library gives you a set of predefined templates to work with, so you don't have to build every analysis manually. The library offers templates for dashboards and reports.
Access templates
You can access templates from two places:
- Dashboard templates: Go to Overview > My dashboards > + Create new.
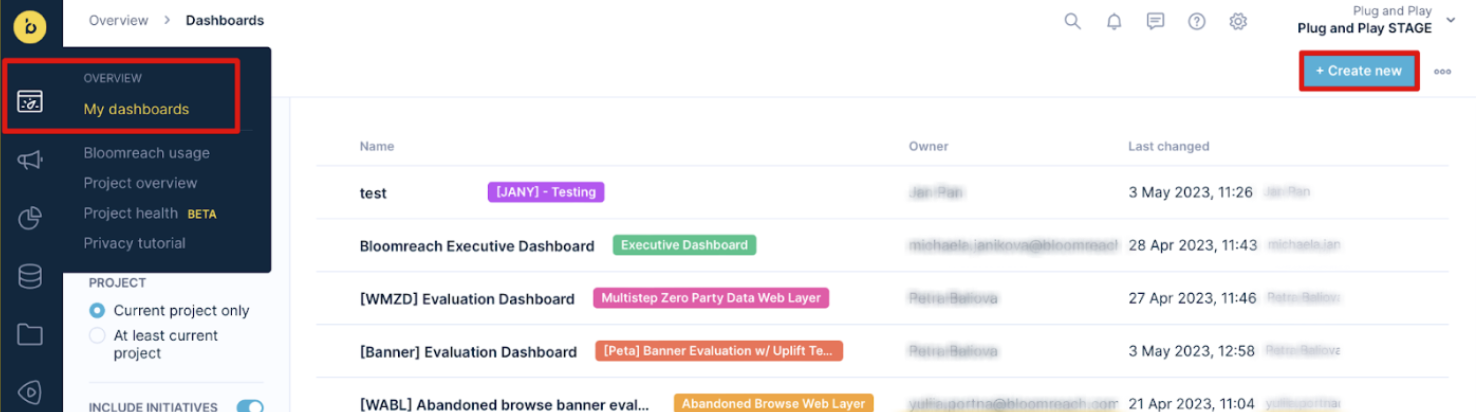
A dashboard template in the My dashboards view.
- Report templates: Go to Analyses > Reports > + New Report.
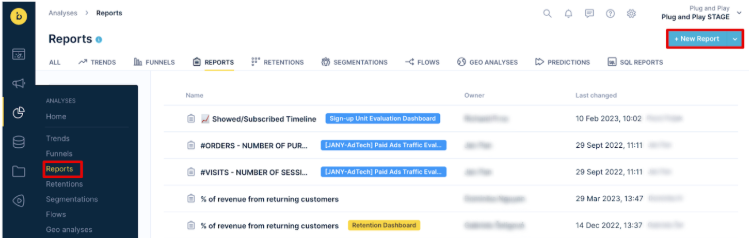
A report template in the Reports view.
Use the template library
Once you're in the template library, you can:
- Search for a specific template by keyword in the name or description.
- Filter templates by tags.
- Browse by tag or search by keyword to find templates that match your reporting goal. Each template shows a preview before you import it.
- Edit the analysis after importing it if needed.
Any user with the Analyses Editor role can import a template.
Suggest a template: Share your template idea to help shape the library. Go to Analyses > Reports, click +, and use the Missing a template? form.
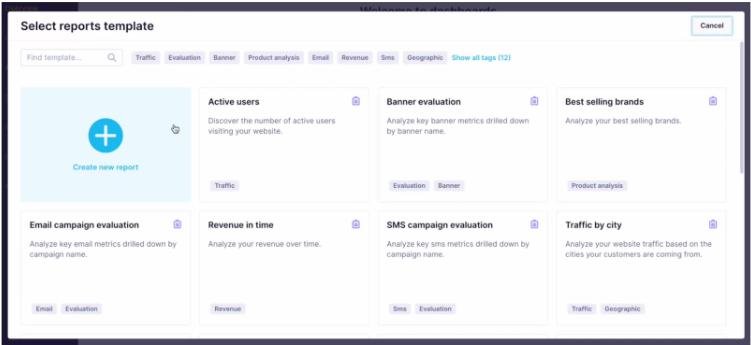
A report template in the reports template library.
Updated about 1 month ago