

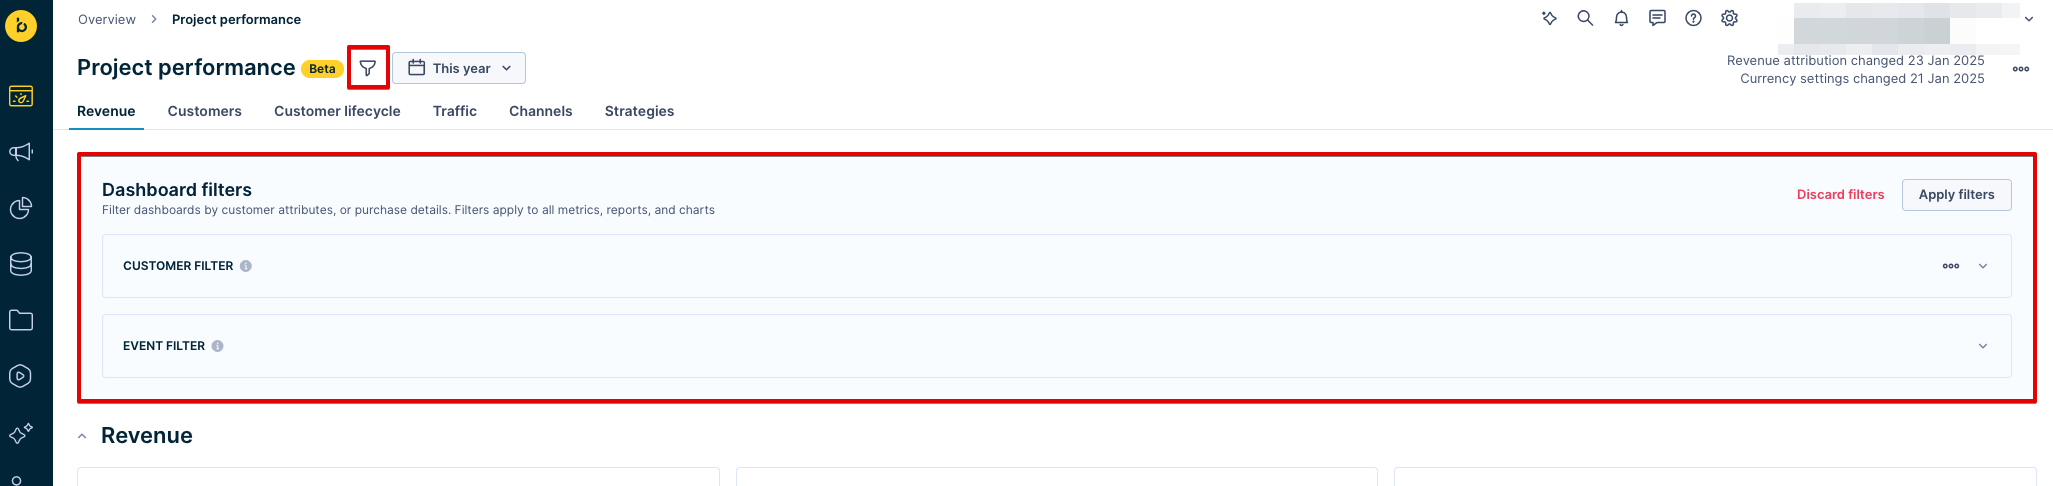
Filters in Performance dashboards
The filtering option is a key feature of Performance dashboards that enhances your analysis capabilities. Filters allow you to refine data, making it easier to analyze specific segments and gain valuable insights.
You can use the following filtering options on your performance dashboards:
- Date filter: available in all Performance dashboard types.
- Customer filter: available in all Performance dashboard types.
- Event filter: available in all Performance dashboard types.
- Reliable opens and clicks filter: available in Email engagement and Email campaign evaluation dashboards.
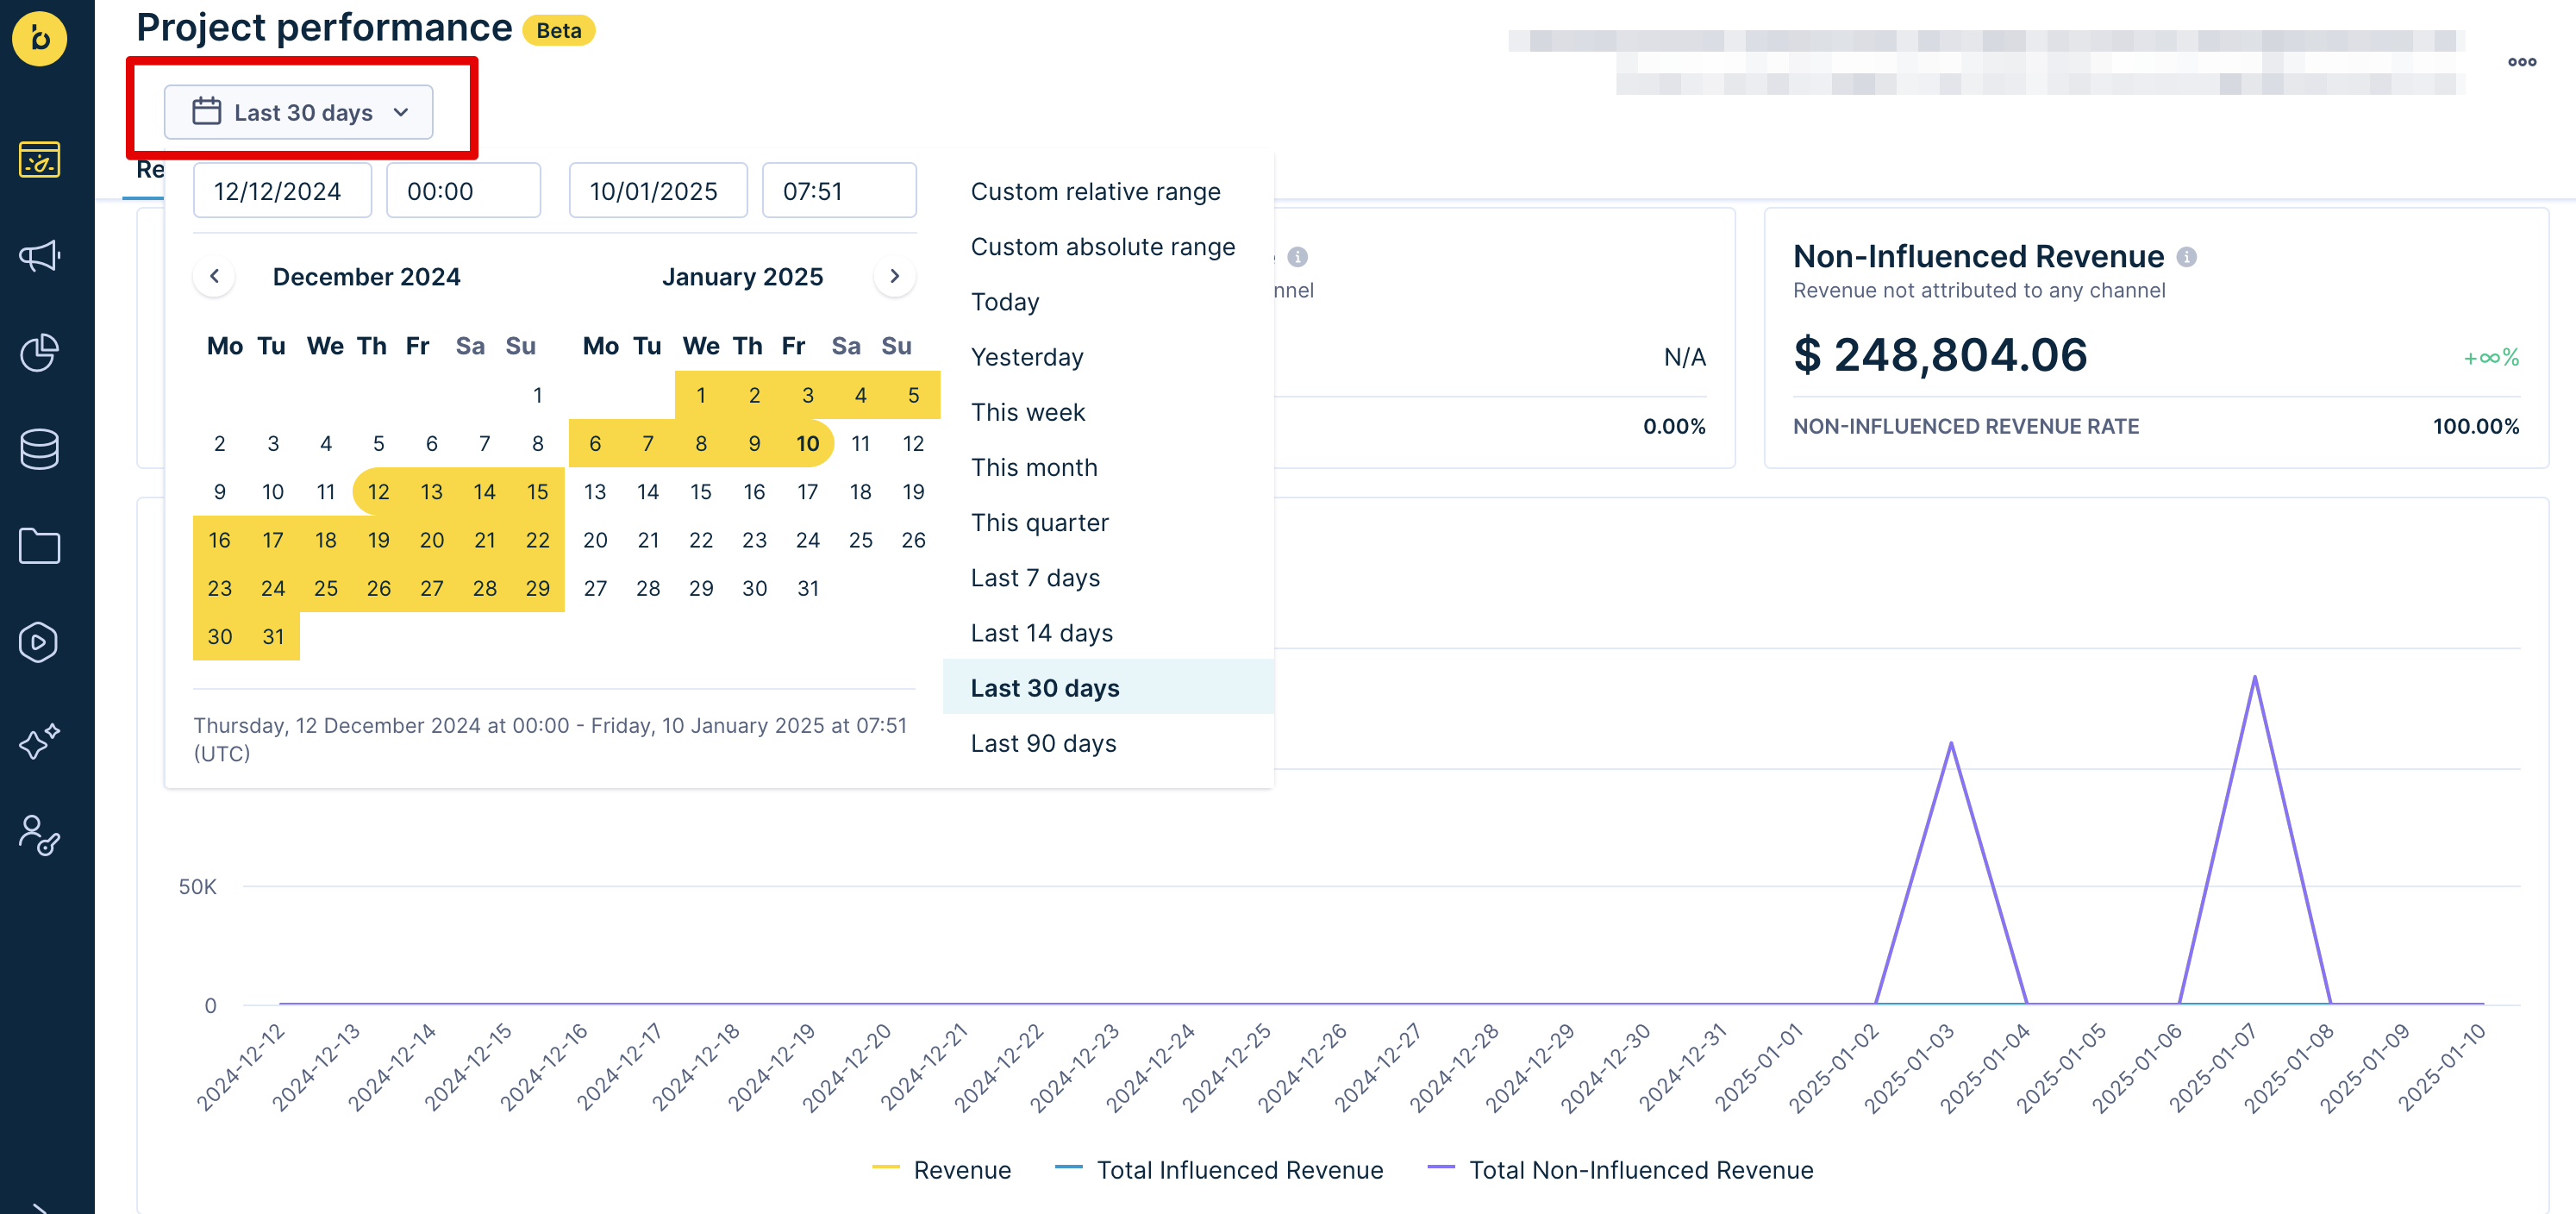
Date filter
Use the date filter to select a specific time range for your revenue dashboards or to switch the report view based on time.
Time range picker
Use the drop-down menu at the top of your dashboard to choose the time period you wish to analyze. Use pre-set time picker (for example, "This week", or "Last 30 days"), or your custom range. The maximum time range you can select is 365 days.
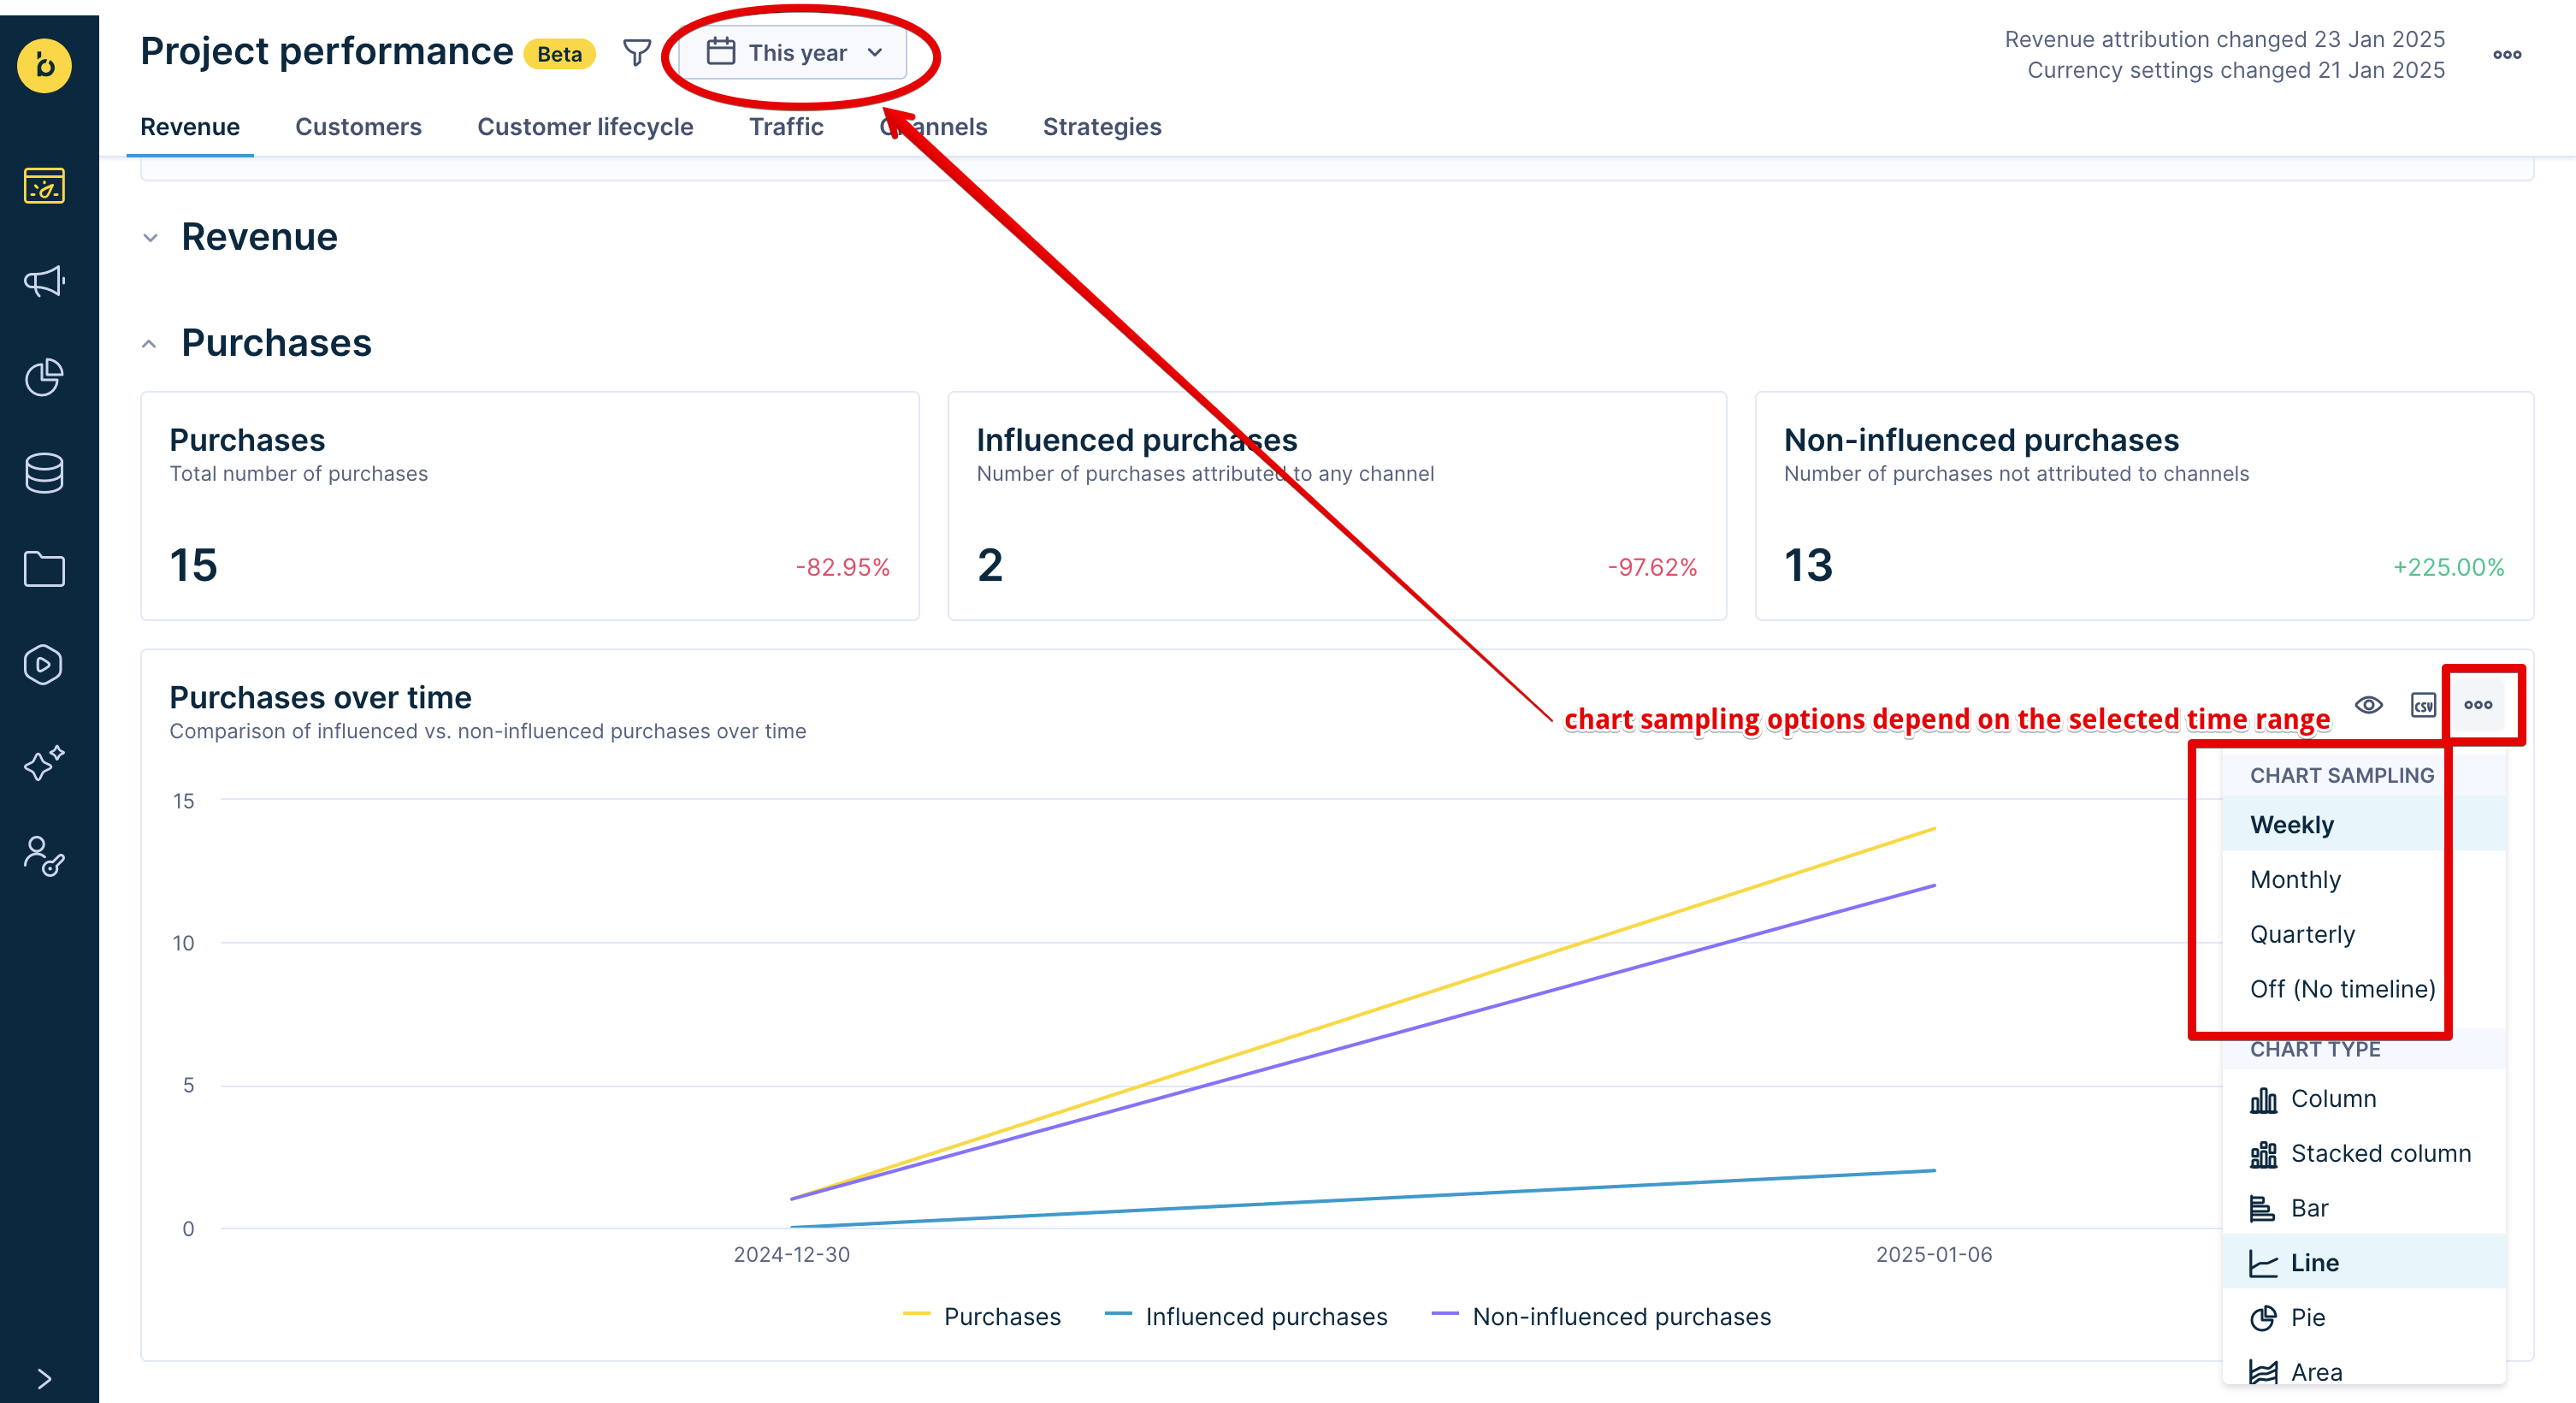
Time-based reports sampling
With the time sampling feature, you have complete control over data granularity, allowing you to view data in daily detail or as a monthly topline.
Hover over your report to see the 3-dots menu. Select from the available options, depending on the time range of your report:
- Hourly
- Daily
- Weekly
- Monthly
- Quarterly
- Off (No timeline)
Time sampling options are available based on the selected time range. For example, if you select "Less than one day" in your date range option, you can select hourly data sampling. However, if you switch the date range to "One year," you can't use the hourly time sampling option. The report will choose the most granular valid option instead as a fallback. In this case, it will be a weekly view.
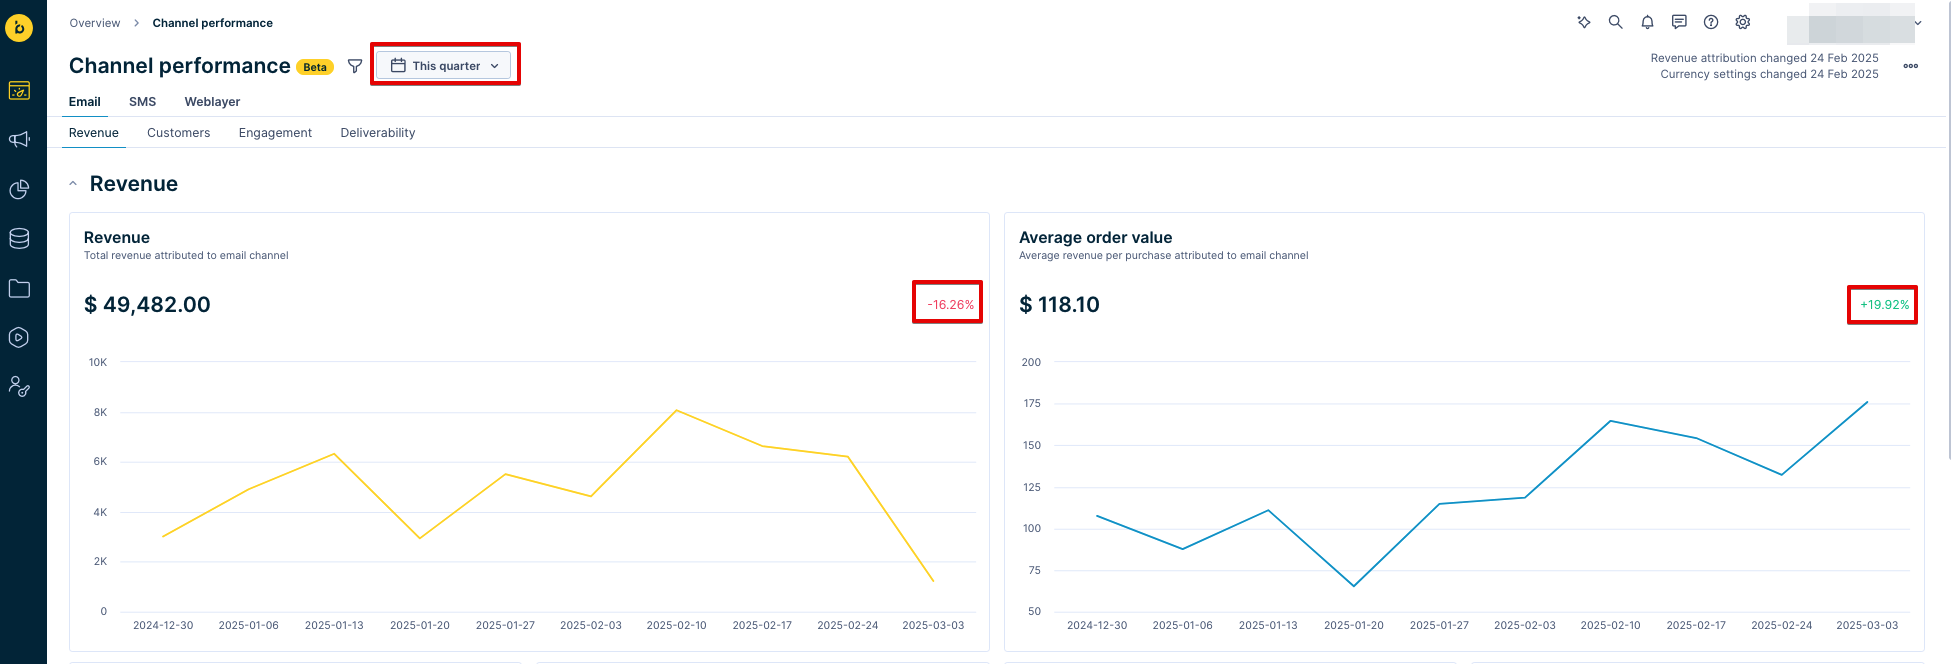
Date filter examples
Comparing campaign metrics over time
When you set up a date filter, the dashboards automatically calculate the difference in metric results compared to the previous time period. This provides immediate insight into your campaign's performance over time and reveals the percentage change in metrics.
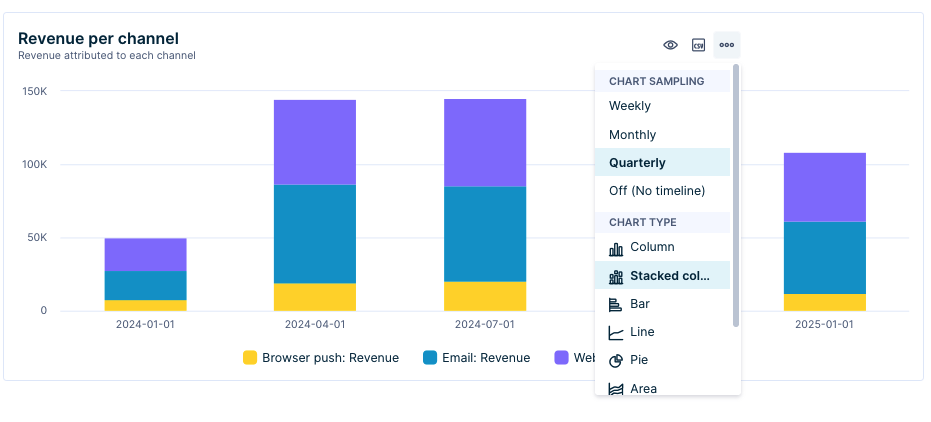
Customizing data granularity
Use the time sampling feature to select the data granularity required for various stakeholders' current needs. For instance, your boss might request a quarterly view for high-level insights, while you prefer a daily data view for managing daily operations effectively. This flexibility ensures that both detailed and summary data needs are met.
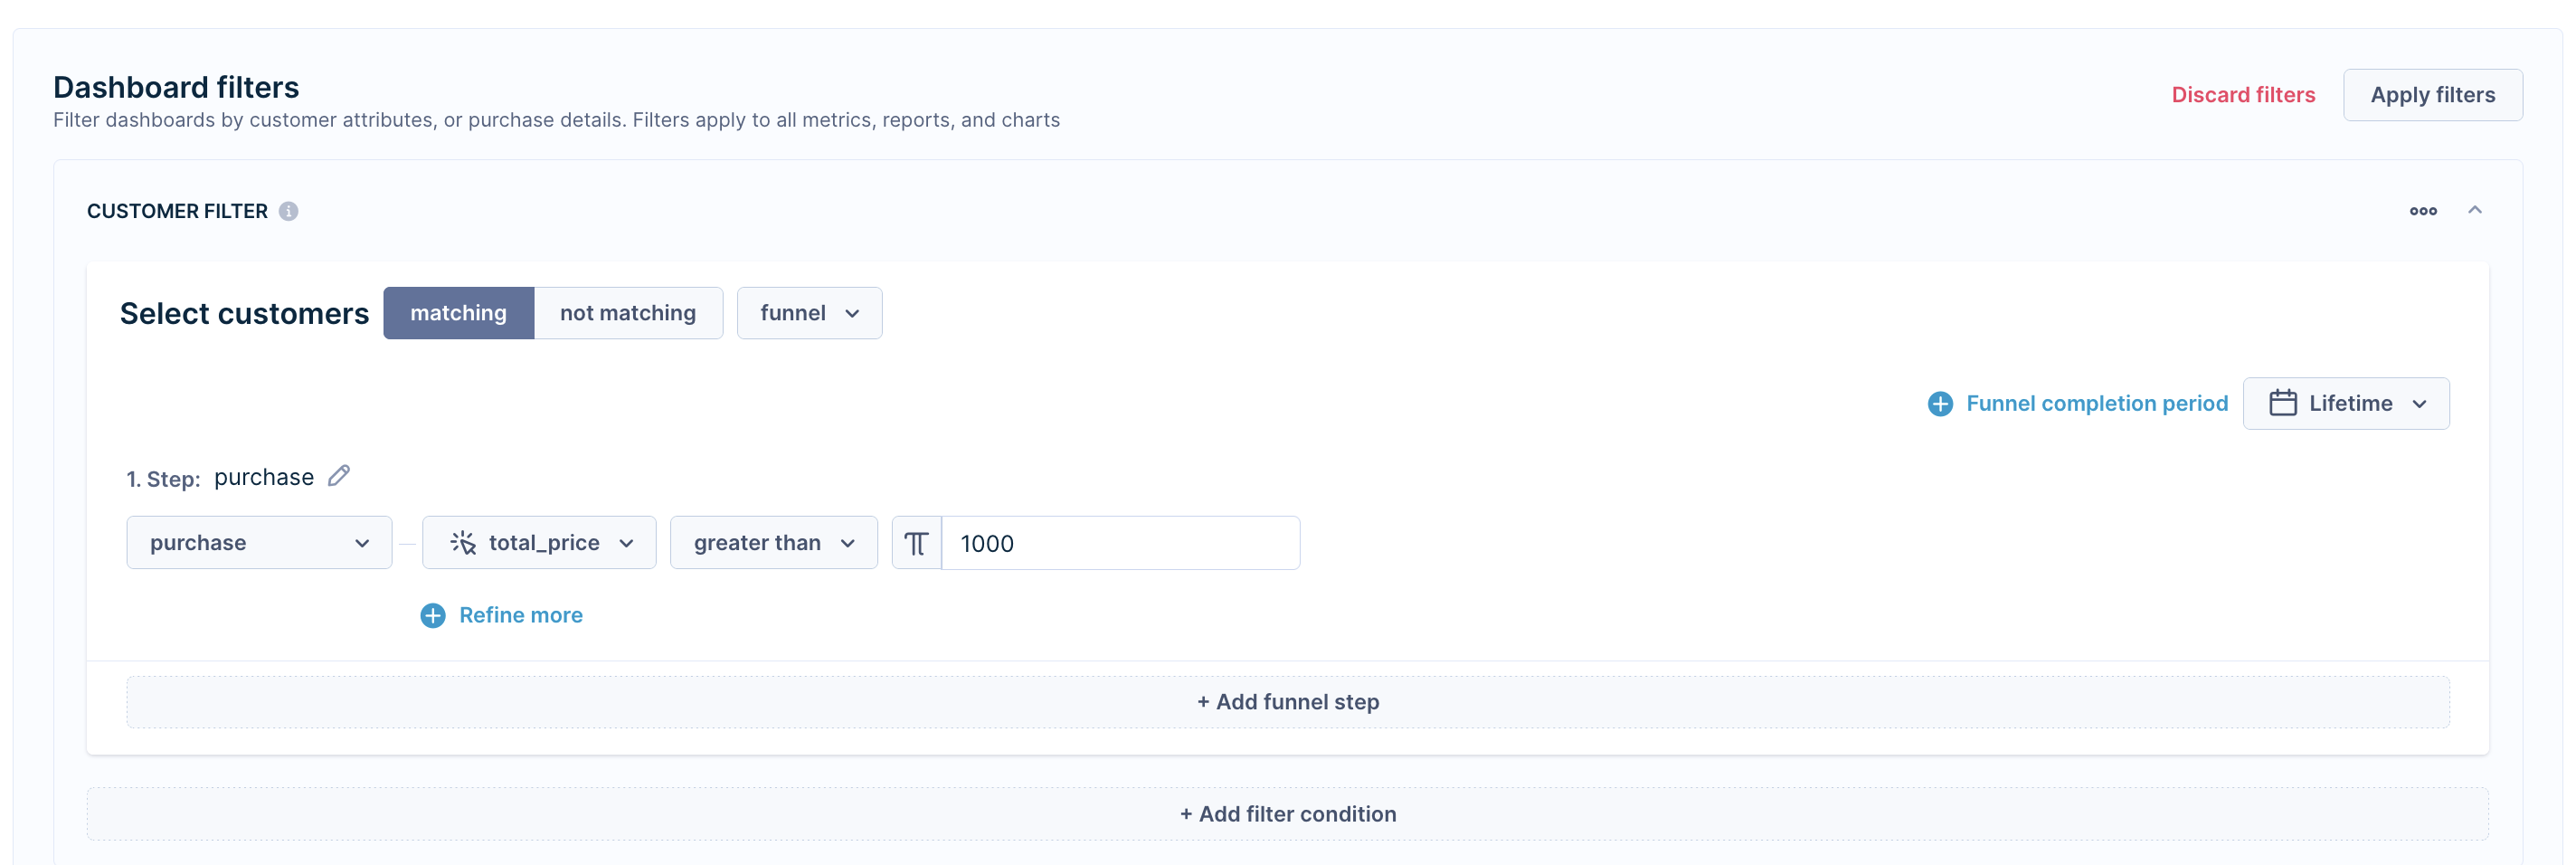
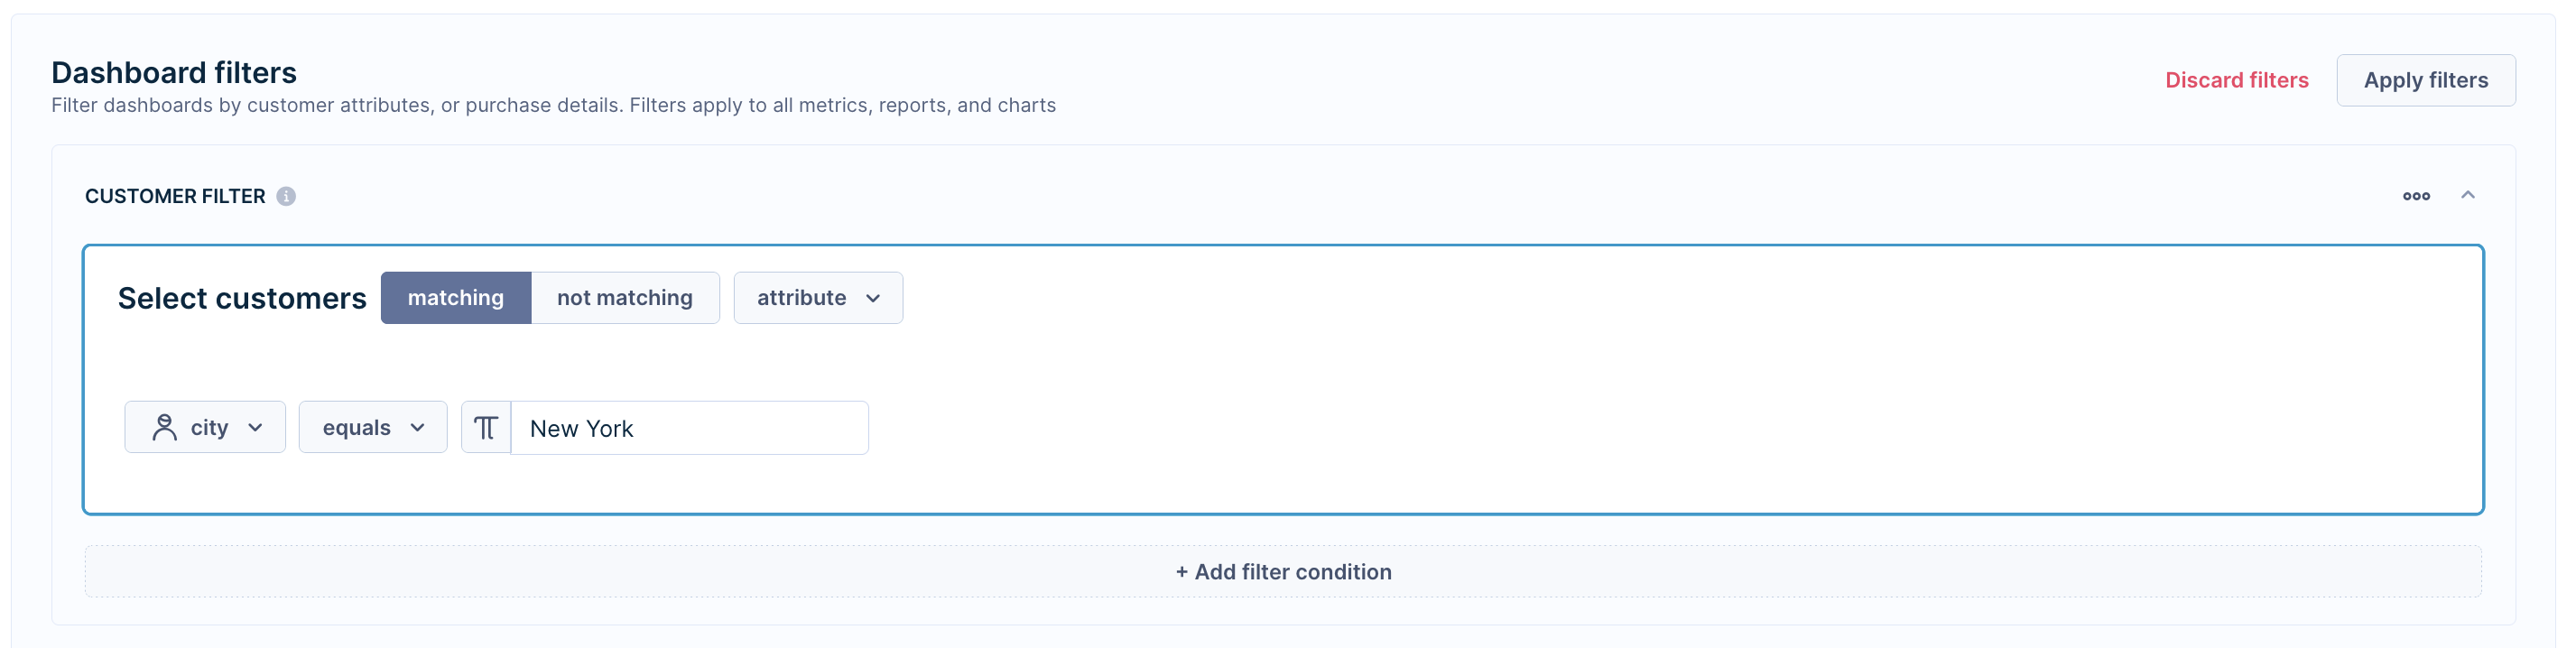
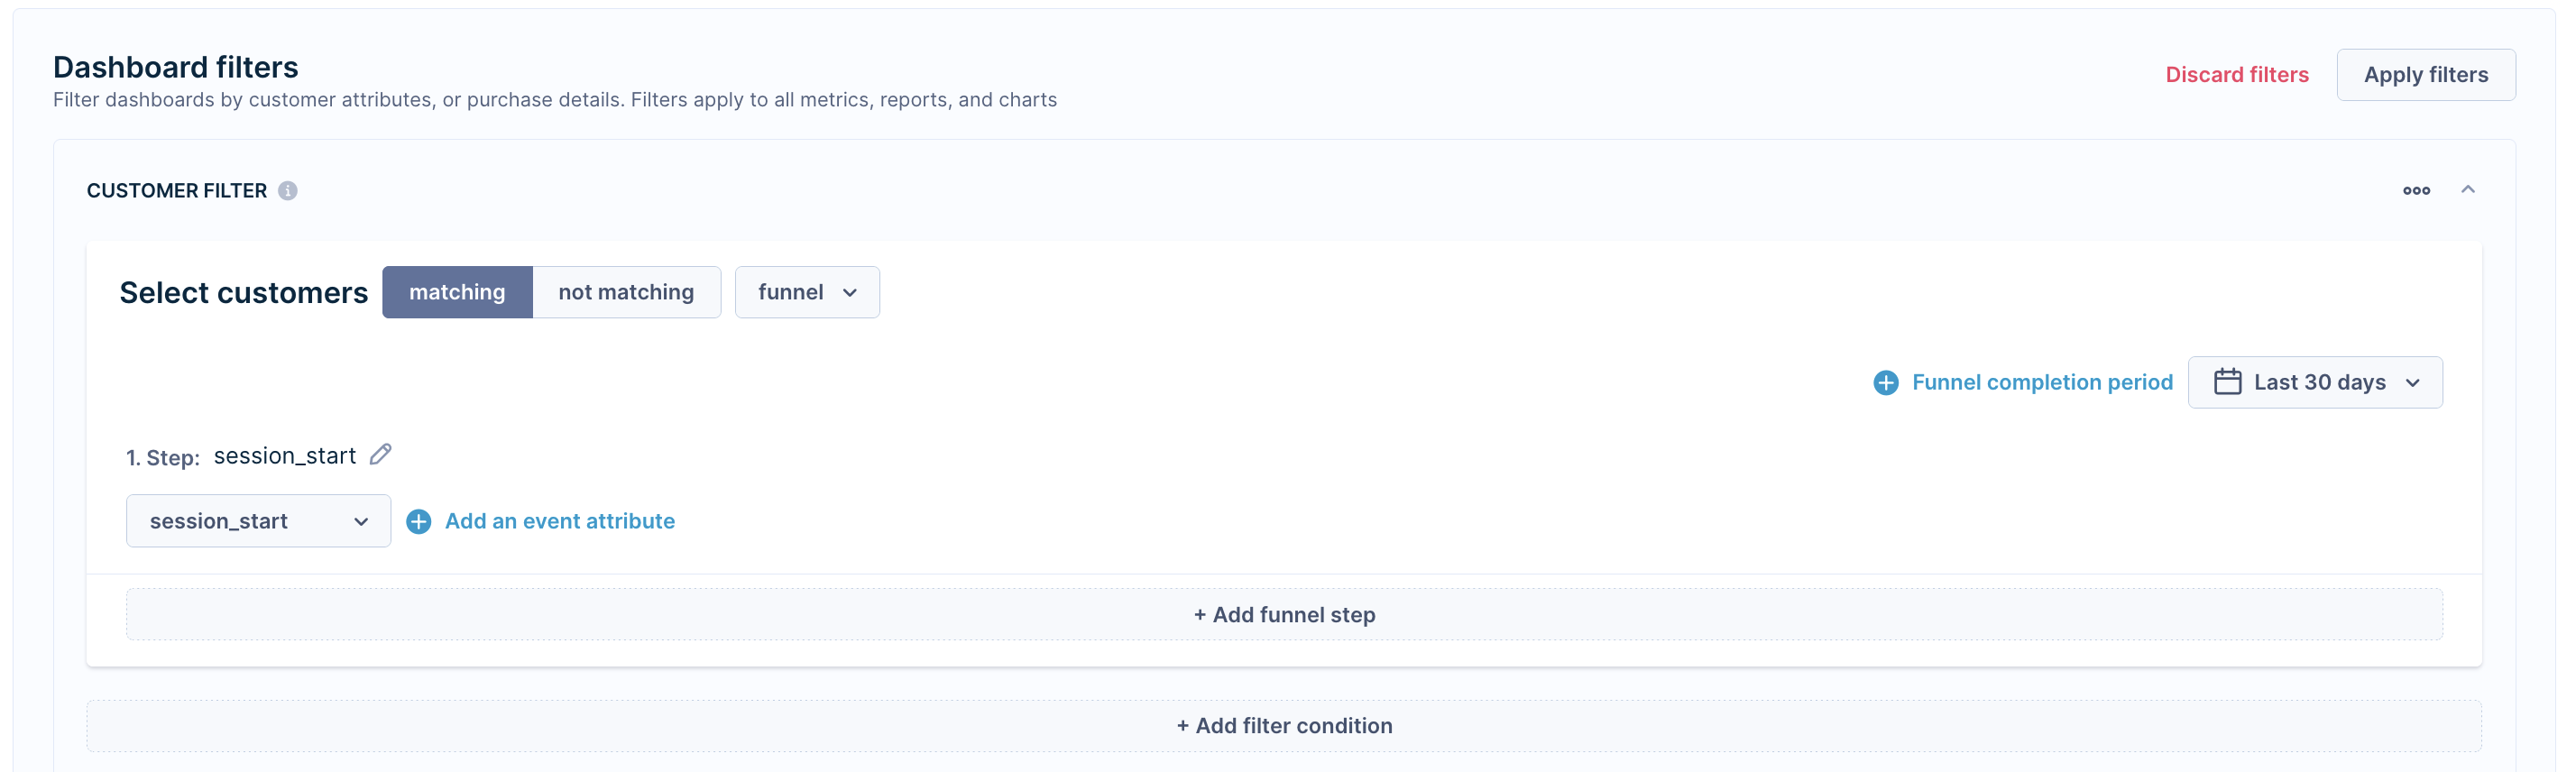
Customer filter
Customer filter allows you to filter customers based on their attributes or events. This helps you view performance metrics for a particular segment, making it easier to analyze and target specific groups.
To activate the function, click the filter icon on the top of your screen. Customer and Event filters will appear as a drop-down menu.
Customer filter examples
High-value customers analysis
Identify and target your most valuable customers.
Example: Filter by total_price > 1000 to find customers who have spent more than $1000.
Geographic analysis
Use the customer filter to view metrics for customers in particular locations.
Example: Filter by city = 'New York' to focus on customers in New York.
Recent visitors analysis
Analyze customers who interacted with your website recently.
Example: Filter by session_start date within the last 30 days to target customers who visited your website in the last month.
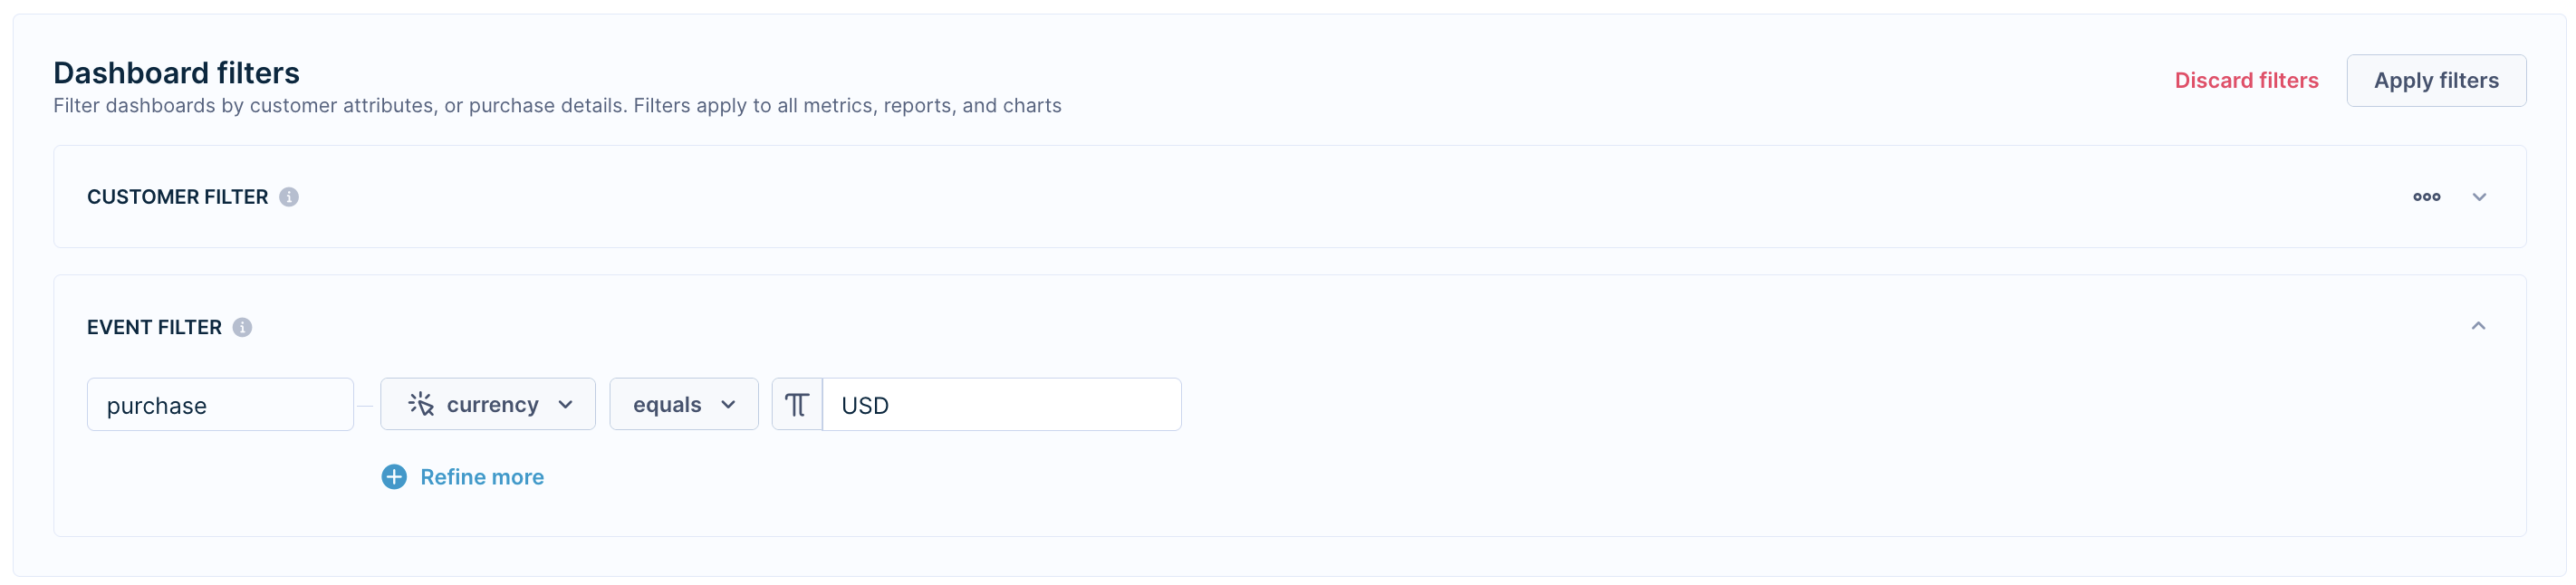
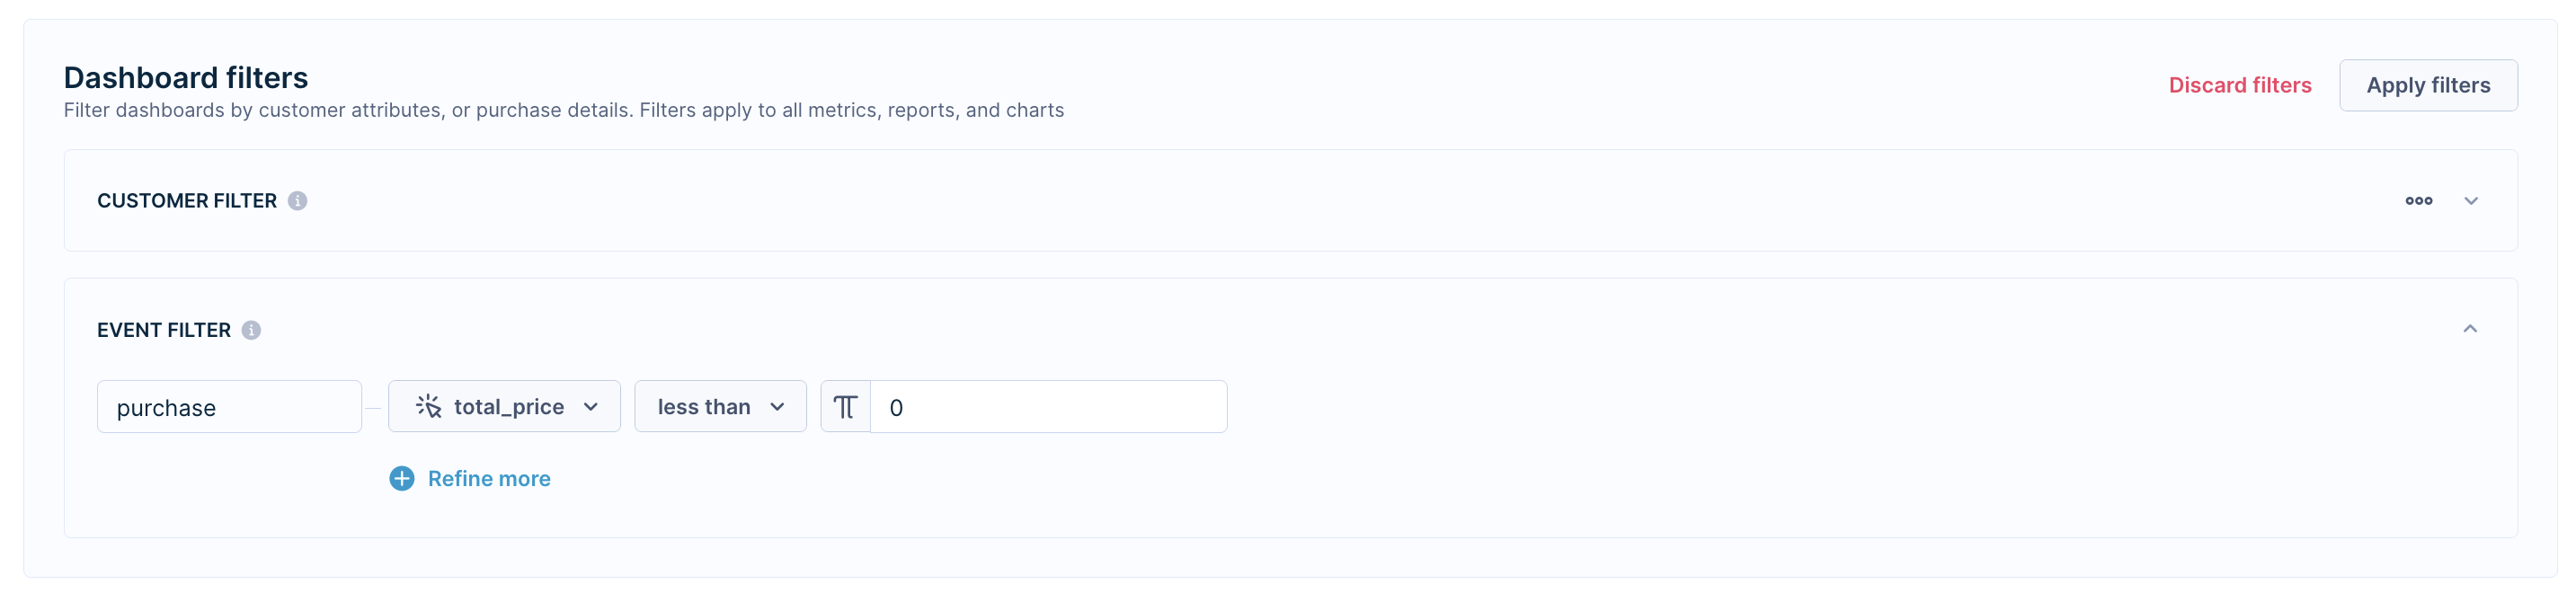
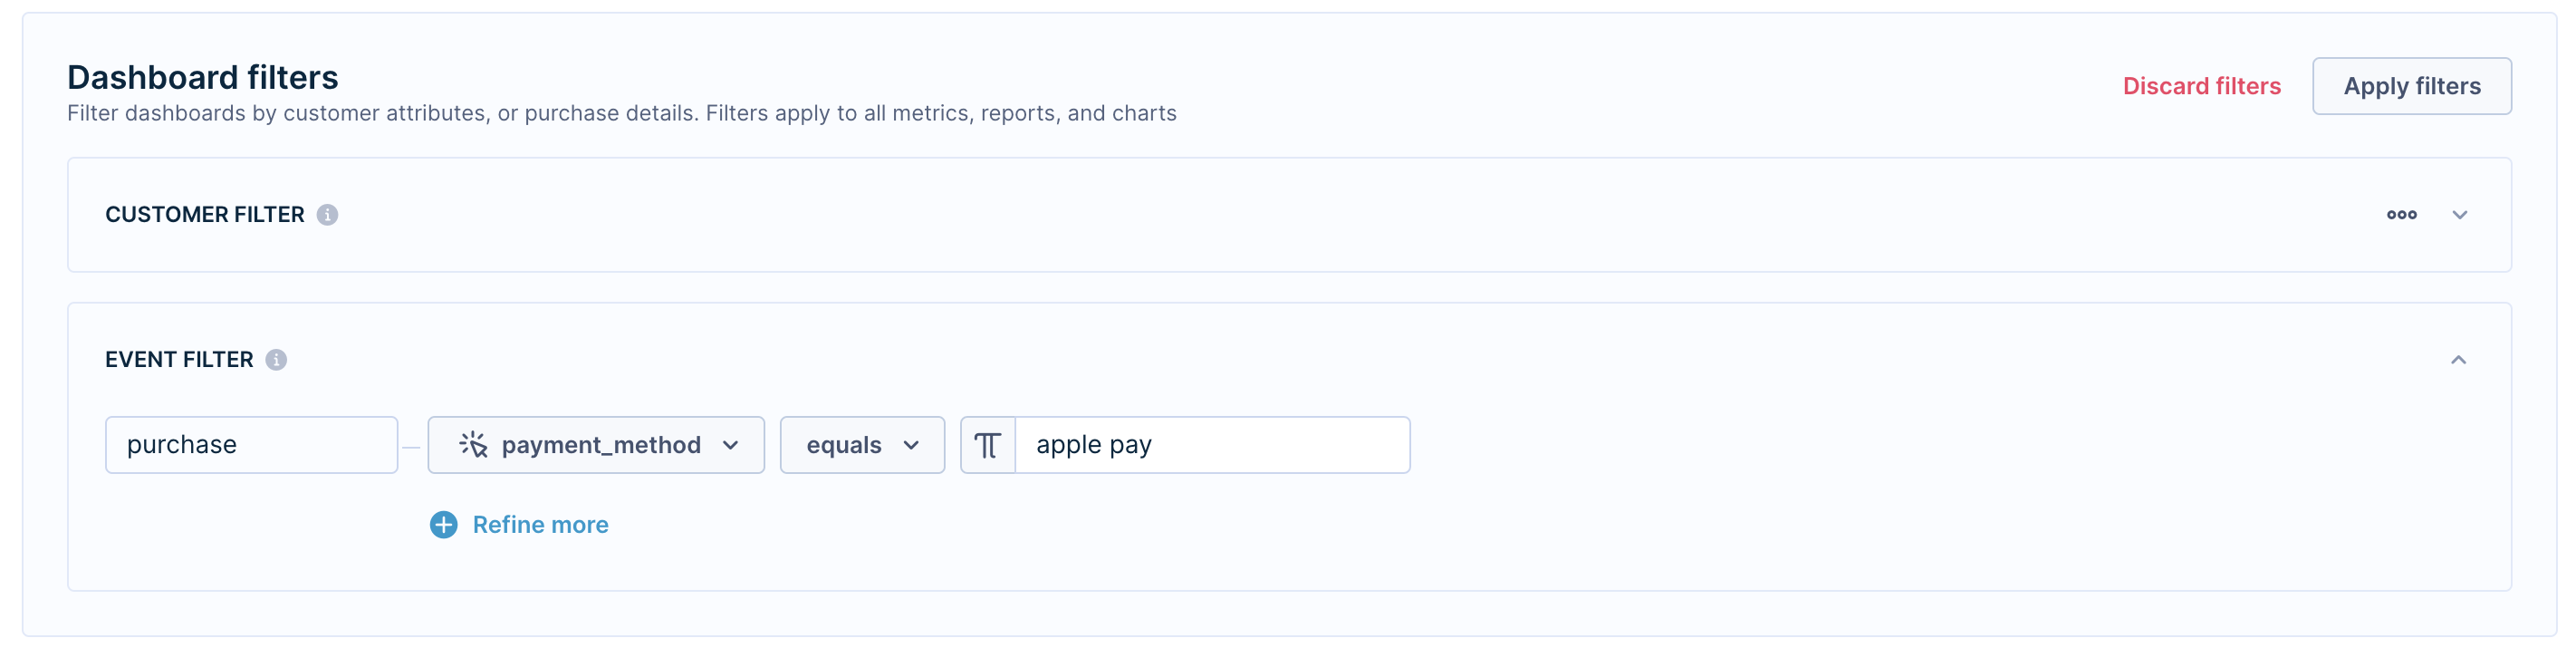
Event filter
Event filters allow you to analyze revenue data on your dashboard based on purchase attributes. This feature helps you investigate specific segments of purchases, such as filtering by currency or excluding transactions with a total price of zero.
Event filter examples
Currency analysis
Apply the purchase filter to include only transactions made in a specific currency.
Example: Filter by currency USD to see revenue generated from purchases made in US dollars.
Discount campaign analysis
To evaluate the impact of a discount campaign, you might want to exclude purchases made with a total price of zero.
Example: Filter by total_price > 0 to focus on transactions that generated revenue.
Payment method analysis
To understand how much revenue comes from a specific payment method, filter purchases to analyze which method is the most popular one.
Example: Filter by payment_method = 'apple pay' to see metrics related to purchases via Apple pay method.
Reliable opens and clicks filter
Reliable opens and clicks filter helps you see how people engage with your content. You can choose to view metrics based on reliable clicks and opens or those that include unreliable data. Switching between the two types of data lets you get a clearer picture of your actual performance.
Hover over Click through rate from delivered or Click through rate from opened metrics. Click the checkbox to activate the filter.
Example: Enable Reliable opens and clicks filter to exclude bot interactions and get accurate metrics.
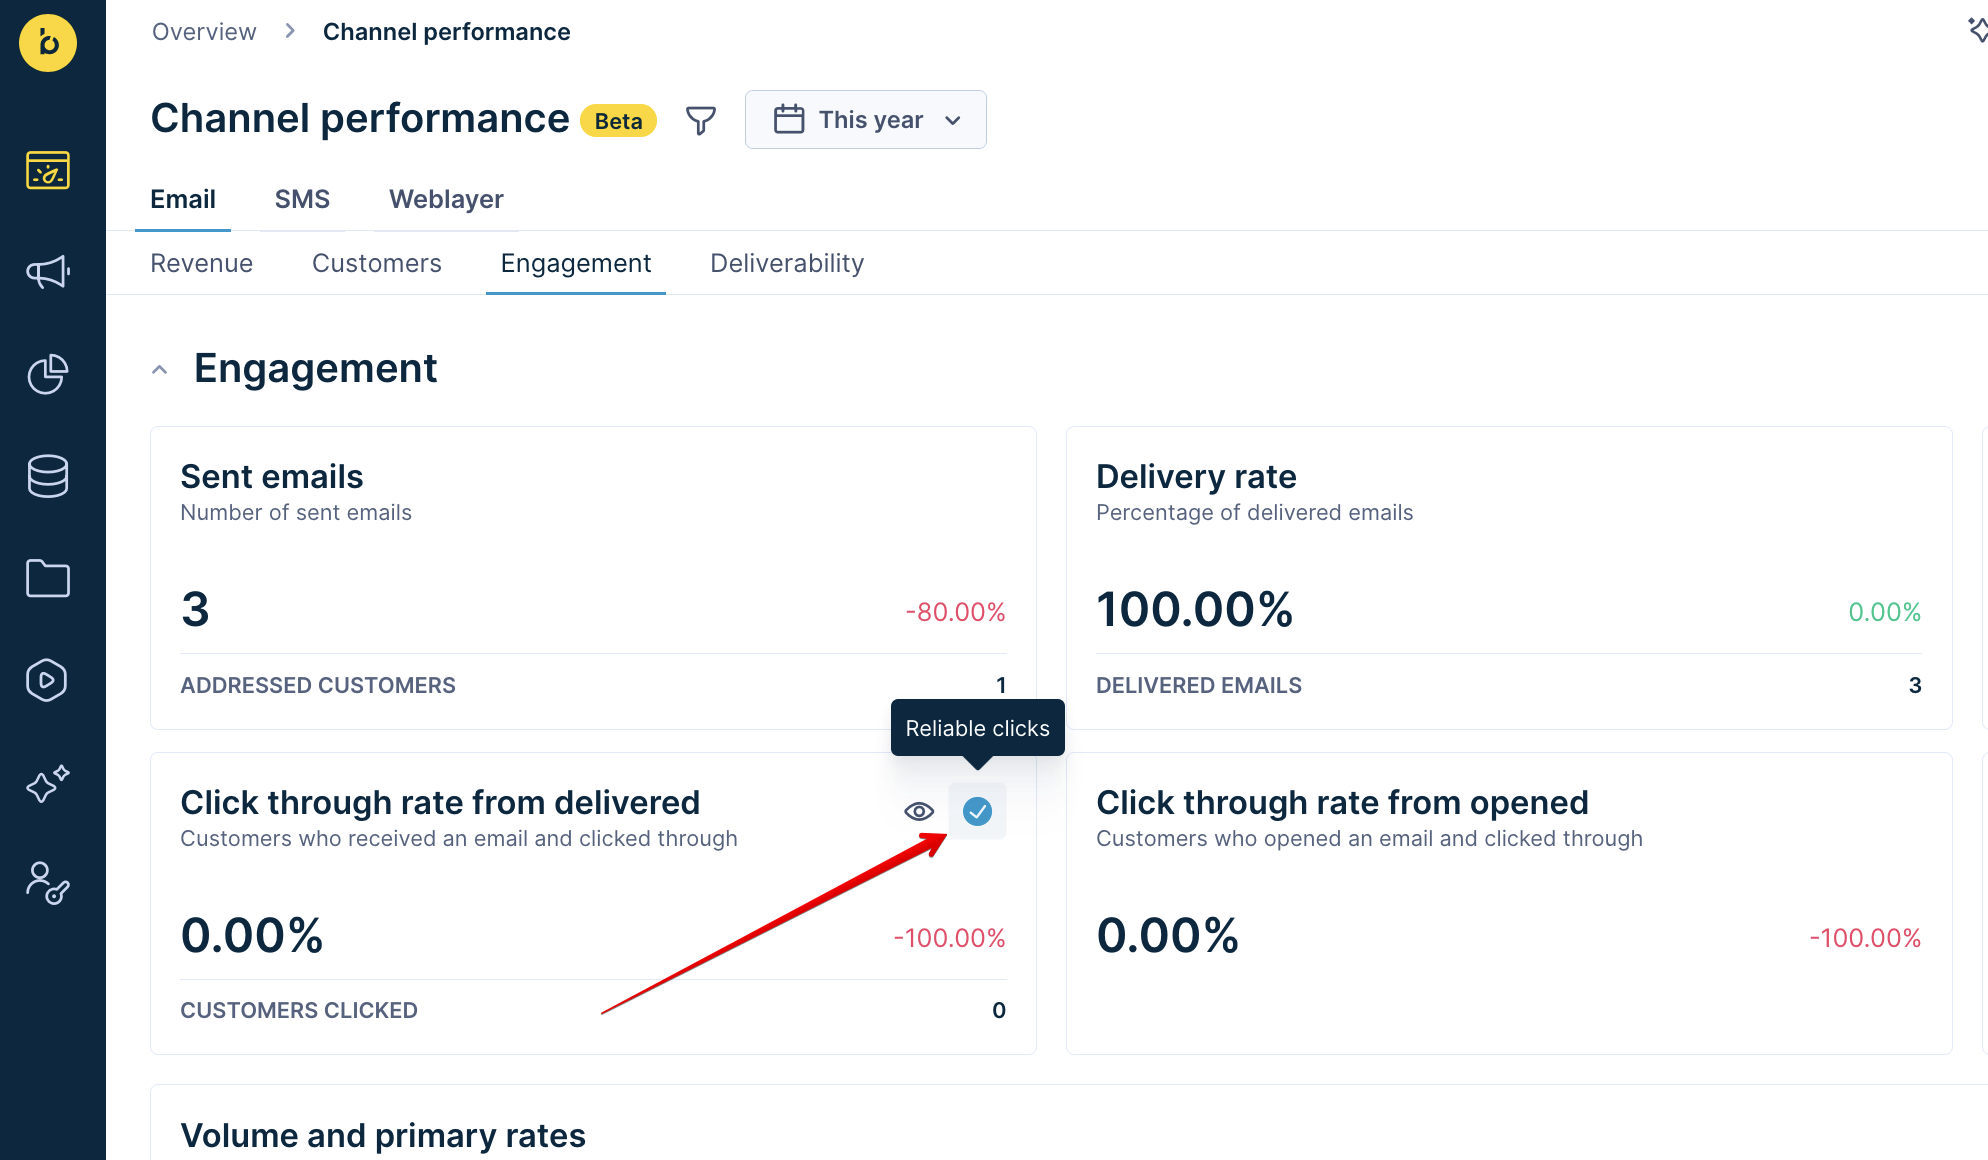
This feature is available in Email engagement and Email campaign evaluation dashboards. The Reliable opens and clicks filter complements the Data cleaning function available in Revenue attribution settings.
Updated 3 months ago