

Trends
This article explains how to use Trends to track events over time. You'll learn how to create a trend analysis, add and edit events, and configure filters and display settings.
Trends lets you track how events develop over time and spot patterns in your data. Specify the events and time period — the tool generates a chart automatically. Common use cases include tracking page traffic, website visits, and purchases over time. You can also use it for more advanced analyses, such as visualising how two related metrics change together.
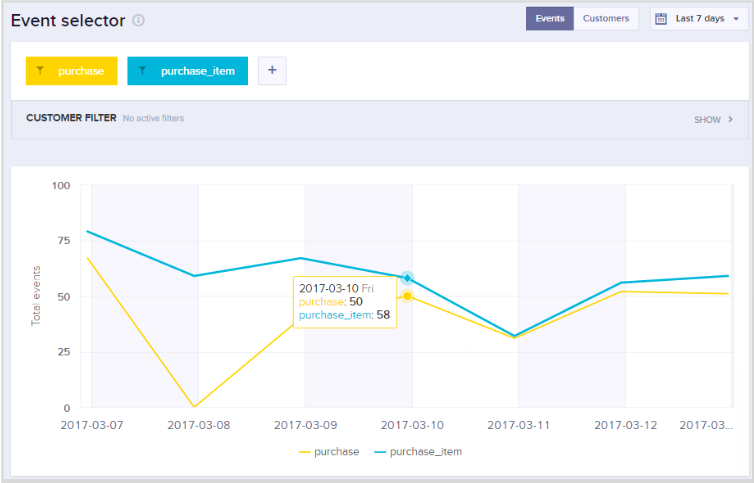
Trend analysis chart showing purchase and purchase_item events over a seven-day period.
Create a trend analysis
- Go to Analyses > Trends.
- Click the plus sign next to Trends in the menu.
- In the edit window that opens, start building your trend analysis.
Add and edit events
- In the Event selector box, click + to add an event and choose what you want to chart.
- To edit an event, hover over it and click the pen icon to swap it for a different one, or the cross icon to remove it.
- Once you've added your events, click Preview to generate the chart. You can add more events and preview again at any time — the chart updates each time.
Filter your data
To learn more about date, customer, and event filters, read the Filtering data article.
Switch between events and customers
Use the toggle above the Event selector box to switch the chart's y-axis between the number of events on a given day and the number of unique customers.
To display event attributes in time, use Reports.
Updated 18 days ago
What´s next?
Learn how to clone your trend into another project that you have access to in our Cloning article