

In-session prediction
In-session prediction identifies customers likely to make a purchase during their current session. Use it to trigger real-time campaigns or weblayers that help convert them before the session ends.
Use it to trigger real-time weblayers based on purchase intent — showing incentives to high-probability customers and suppressing irrelevant overlays for low-probability ones.
How the model works
In-session prediction scores customers in real time based on their current session behavior — pages viewed, items browsed, time on site — rather than predicting over a future window. The model combines these live signals with each customer's historical patterns to output a probability score between 0 and 1 for how likely they are to purchase before the session ends. Unlike other prediction types, the score updates continuously throughout the session as new behavior signals come in.
In-session prediction workflow
The in-session prediction workflow consists of the following steps:
- Create a prediction model.
- Evaluate the model's performance.
- Create segmentation based on the model.
- Create an A/B test.
- Evaluate and run.
Create a prediction model
-
Go to Analyses > Predictions, click + New prediction, and select In-session prediction.
-
Specify the time frame for in-session purchase predictions. For example, if you select
one month, the algorithm looks back two months in total — using the earlier month to build features and the most recent month to generate targets. -
Select the conversion goal for your project. For example, the
purchaseevent is used for the in-session purchase session. -
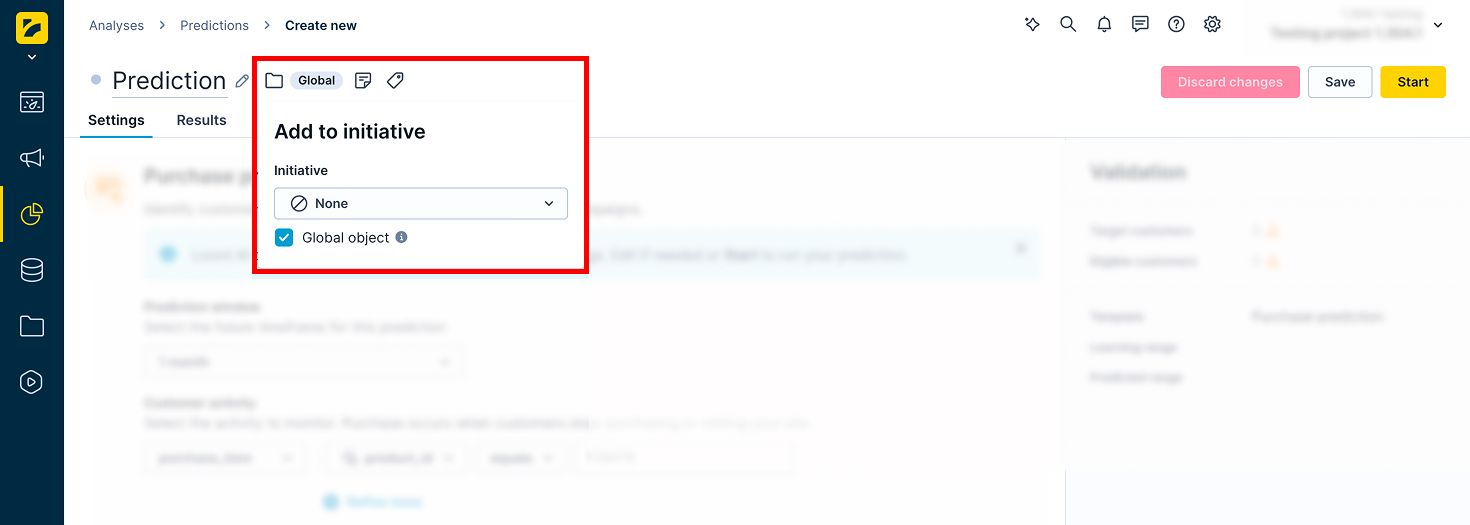
If the prediction is part of an initiative, mark it as a global object to display it in the customer profile. Click the Initiative icon next to the prediction name and check the Global object box.
-
Click Save, then Start to launch the calculation.
Monitor progress in the Results tab. The process typically takes between 20 minutes and a few hours, depending on the amount of data in your project.
Evaluate the model's performance
In the Results tab, review the model's quality metrics and decision tree. For this model, use Area under the curve (AUC) as the primary metric.
If performance is unsatisfactory, try a different time frame or a custom prediction. For a full explanation of metrics and how to read the decision tree, see Interpret prediction results.
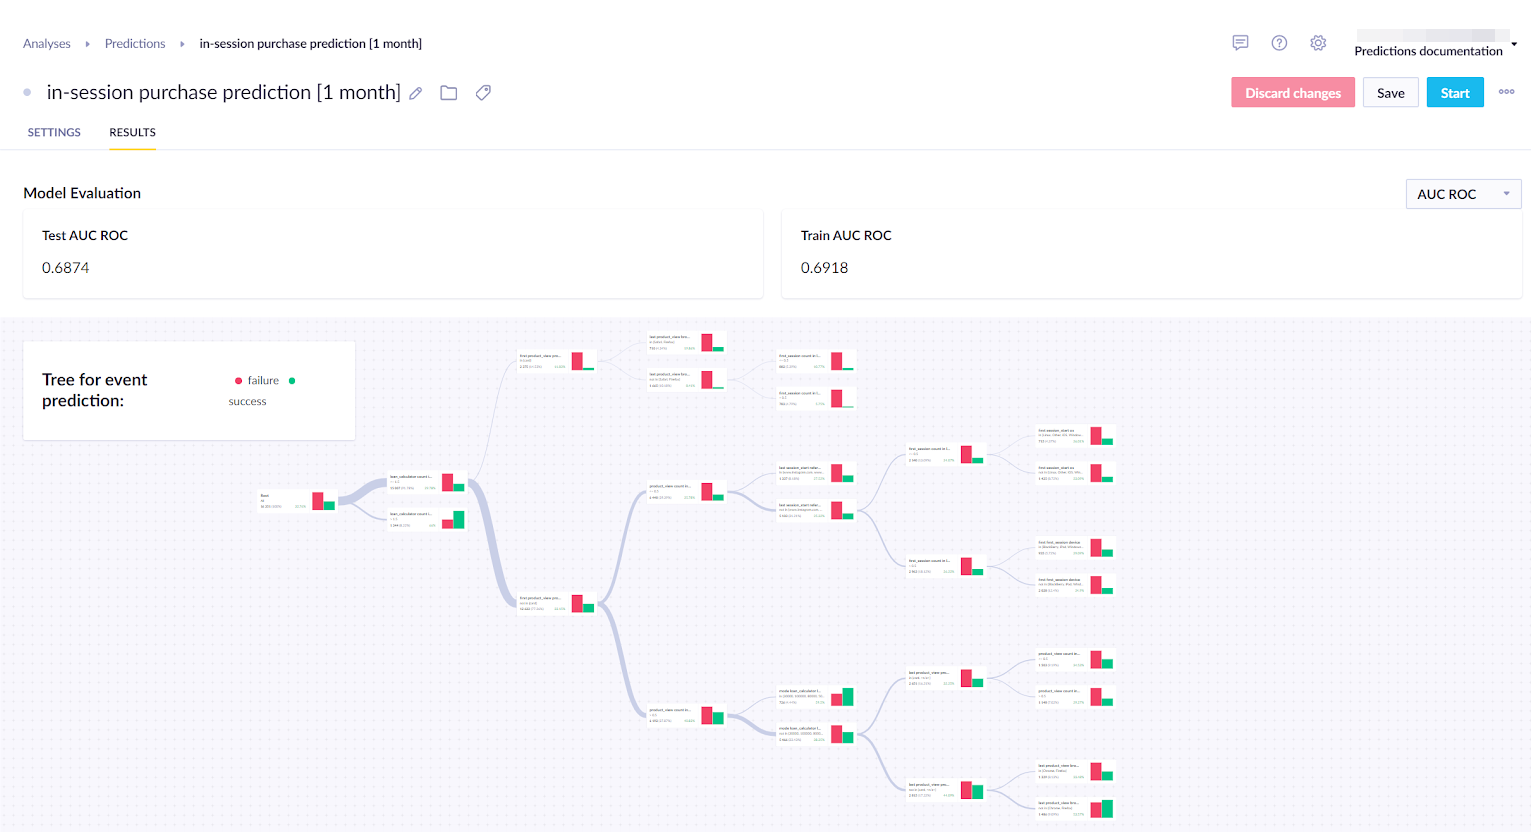
The result is stored per customer in a property called In-session prediction [timeframe] — a value between 0 and 1 representing the probability of a purchase in the next month.
Create segmentation based on the model
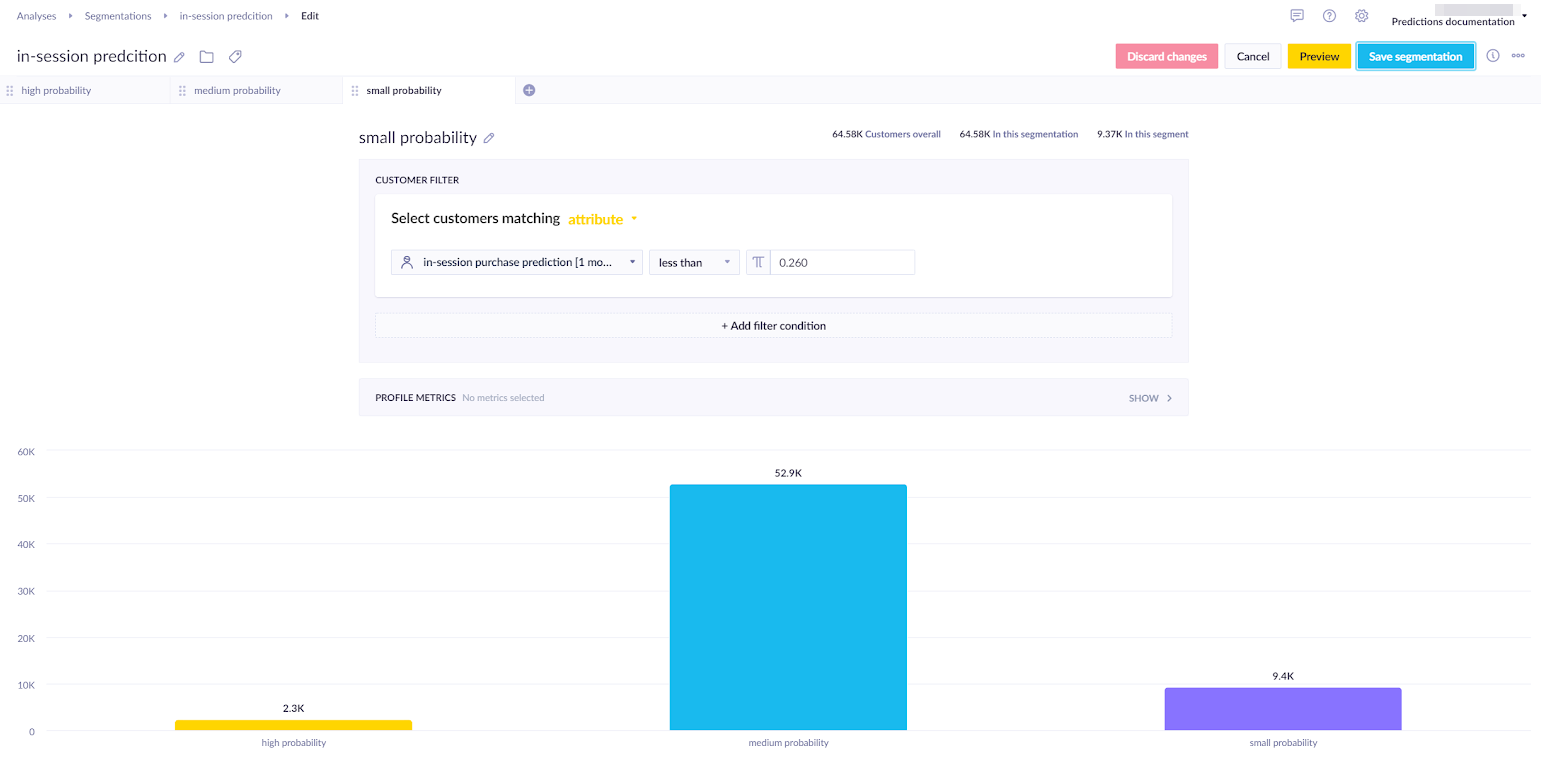
Divide customers into segments based on their in-session probability score to target each group with the right campaign.
The example below uses three segments — adjust the thresholds to fit your use case:
- High probability: in-session purchase prediction greater than
0.6(60%) - Medium probability: in-session purchase prediction between
0.26and0.6(26%–60%) - Low probability: in-session purchase prediction less than
0.26(26%)
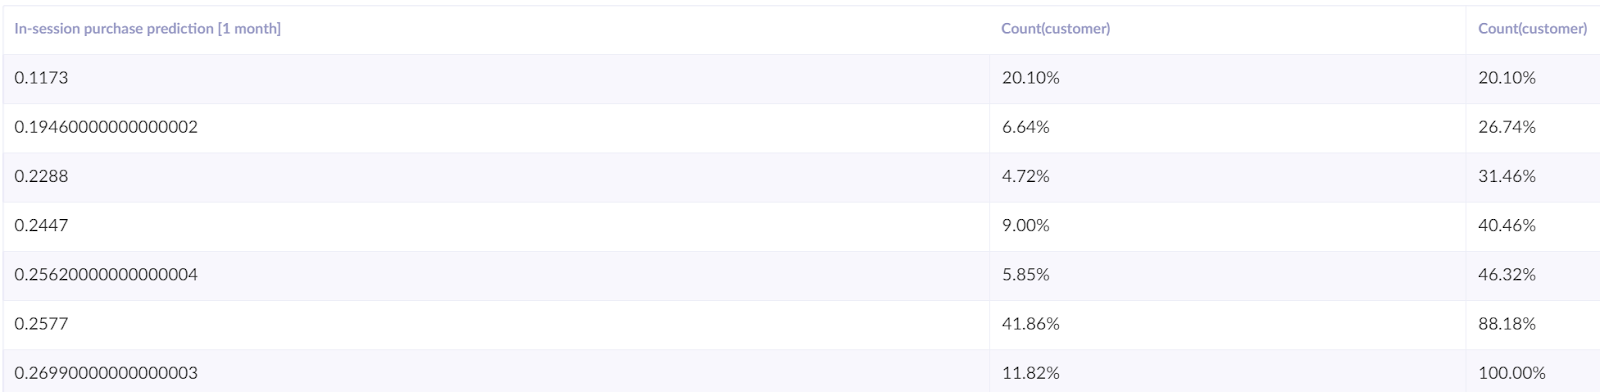
To find the right thresholds, create a report with the in-session prediction score in rows and two customer count metrics — one showing Column total % and one showing Running total %. The running total helps you see how customers distribute across score ranges so you can set thresholds that give you usable segment sizes
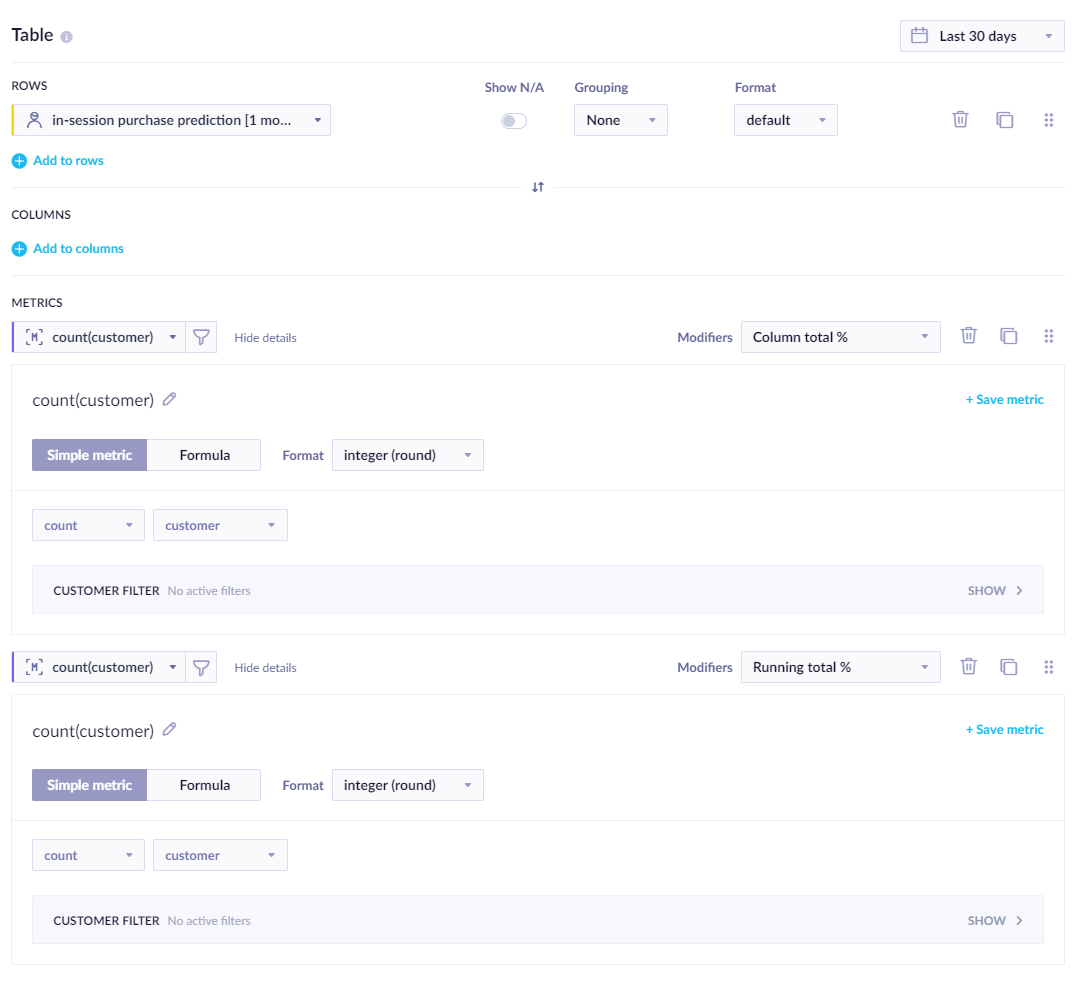
From the report table, identify the thresholds and, based on your preferences, choose either large segments or only a percentage of customers in the highest segment.
Create an A/B test
Create an A/B test to find the most effective approach for each customer segment. Divide customers into two groups:
- Variant
- Control group
Show a weblayer or campaign to the Variant group and leave the Control group untargeted. This lets you measure whether the campaign had any effect.
-
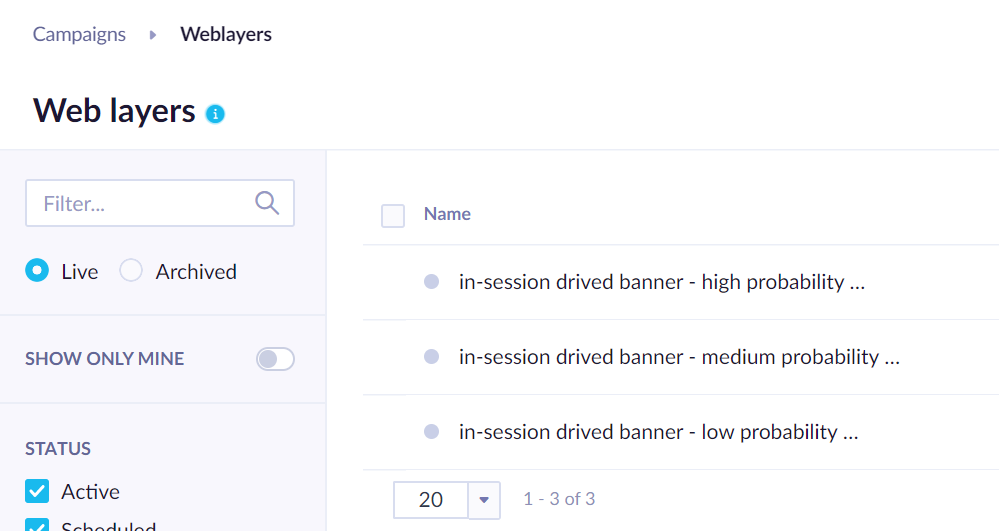
Create three versions of the weblayer — one per segment.
-
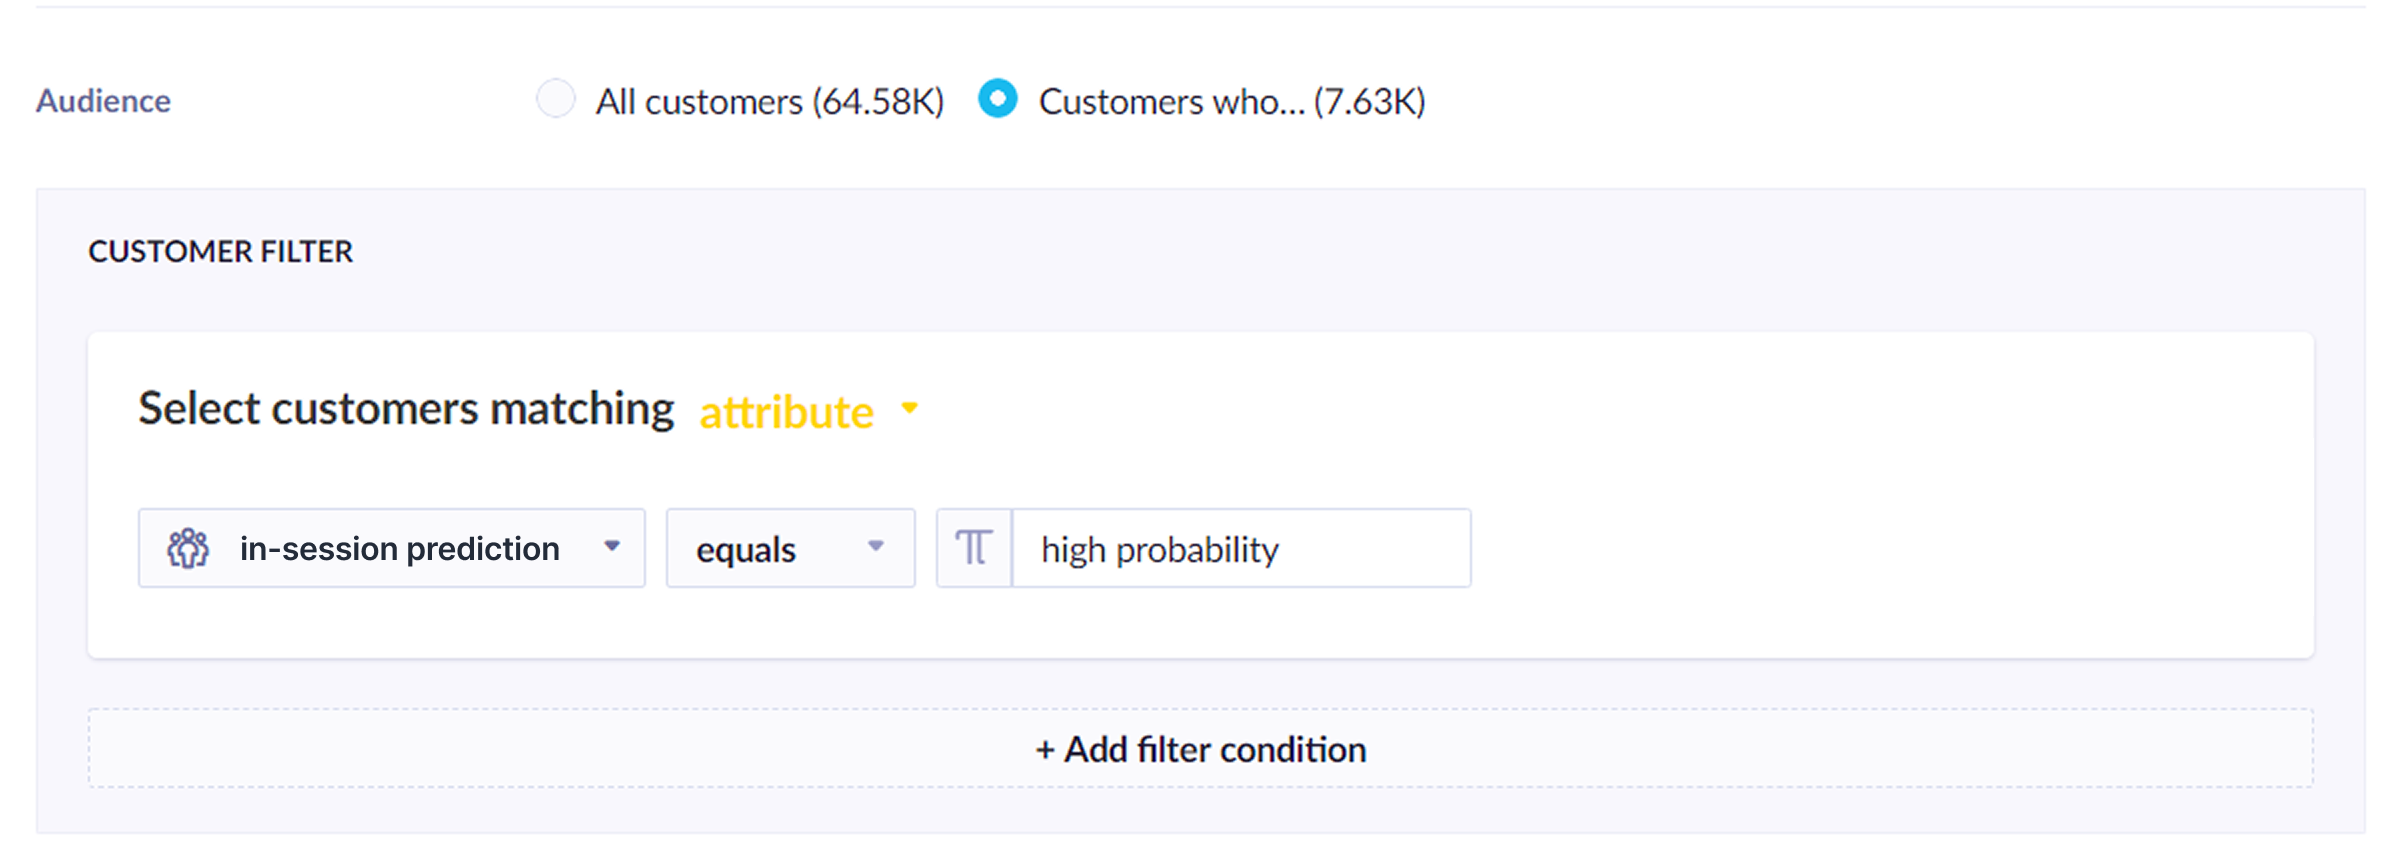
Set the target segment for each weblayer in Settings > Audience > Customer filter.
-
Select the desired segment from the in-session prediction.
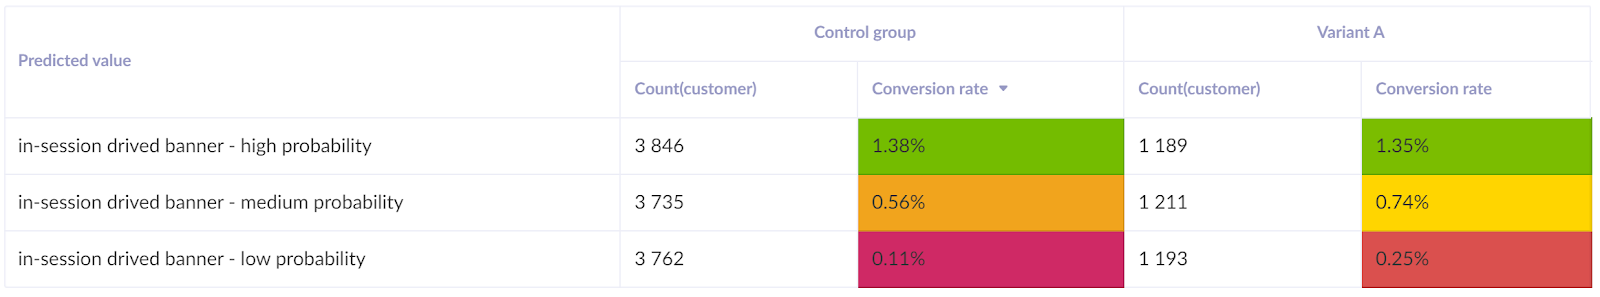
This gives you six segments (3 prediction segments × 2 variants) to evaluate what works best for each.
The weblayer type is flexible so the format — banner, overlay, or inline — can vary by segment. For high- and medium-probability customers, focus the message on a quick-purchase incentive such as a limited offer or free shipping. For low-probability customers, consider suppressing the weblayer entirely to reduce friction.
Run and evaluate
Run the scenario for several days. Then, evaluate the following:
- Does the model have an impact on campaign effectiveness? Compare the control group with customers in the lower probability segment who have the added prediction event.
- What works for each segment? Compare the uplift in performance across probability segments of the Variant and the Control group.
Learn how to measure prediction performance in Evaluate predictions.
For example, high-probability customers are already likely to buy and don't need a discount. Focus discounts on medium- and low-probability segments, and check your margins to confirm the uplift justifies the cost.
To check whether the difference between a variant and the control group is statistically significant, use the Bayesian A/B test calculator.
Based on the evaluation, adjust the campaign so real-time predictions decide whether a weblayer is shown to each customer.
Use in-session prediction
Every customer has the purchase prediction result stored in the In-session prediction [time frame] property. The value is recalculated with the most up-to-date data every time its value is requested — the same way aggregates or segmentations work. The result is a value between 0 and 1 representing the probability that a customer will make a purchase in the defined time frame.
The in-session prediction attribute can be used wherever customer attributes are accepted. Common uses include:
- Segmentations — build audience segments based on in-session probability, for example
In-session prediction [1 month] > 0.7as a high-intent bucket. - Weblayers — target overlays to customers with high purchase intent by setting the prediction segment in Settings > Audience > Customer filter.
- Scenarios — branch customers into personalized paths: show urgency messaging to high-probability customers, suppress overlays for low-probability ones.
- Reports — compare conversion rates across probability segments to validate thresholds and refine targeting logic.
Related articles
Prediction use cases: Explore real-world examples of how predictions can personalize customer experiences and drive engagement.
Updated 4 months ago