

Purchase prediction
Purchase prediction identifies customers most likely to make a purchase within a chosen time window — so you can focus your budget, offers, and campaigns on the customers most likely to convert.
Prerequisites
To be considered for model training, a customer must have started a session in the last 90 days.
How the model works
The model analyzes each eligible customer's behavior over a historical learning window to establish prediction targets.
During the learning window:
- The model analyzes each customer's behavior — sessions, purchases, engagement signals, and more.
- It then labels customers based on whether they completed the target action during the prediction window.
- Using the labels, the model learns the patterns that distinguish customers likely to convert from those who aren't.
- At prediction time, each eligible customer receives a probability score for the selected window.
Purchase prediction workflow
The purchase prediction workflow consists of the following steps:
- Create a prediction model.
- Evaluate the model's performance.
- Create segmentation based on the model.
- Create an A/B test.
- Run and evaluate.
Create a prediction model
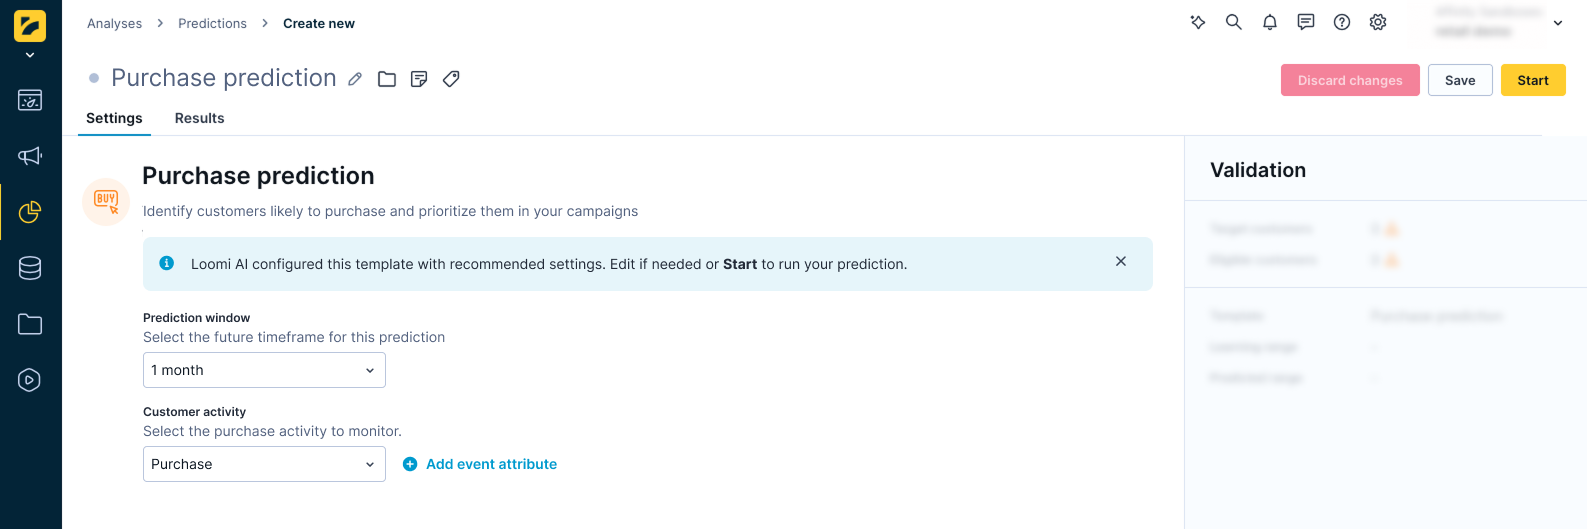
- Go to Analyses > Predictions, click + New prediction, and select Purchase prediction.
- Specify the prediction window time frame for future purchases. Short windows capture near-term intent; longer windows capture slower purchase cycles. Select from the following options:
- 1 day
- 1 week (7 days)
- 2 weeks (14 days)
- 1 month (30 days)
- 3 months (90 days)
- 1 year (365 days)
- Define the customer activities the model should learn from.
- By default, the template uses the mapped purchase event and status from Data Manager > Mapping.
- To use a different event, select any event type and apply static filters — for example,
category = 'shoes'.
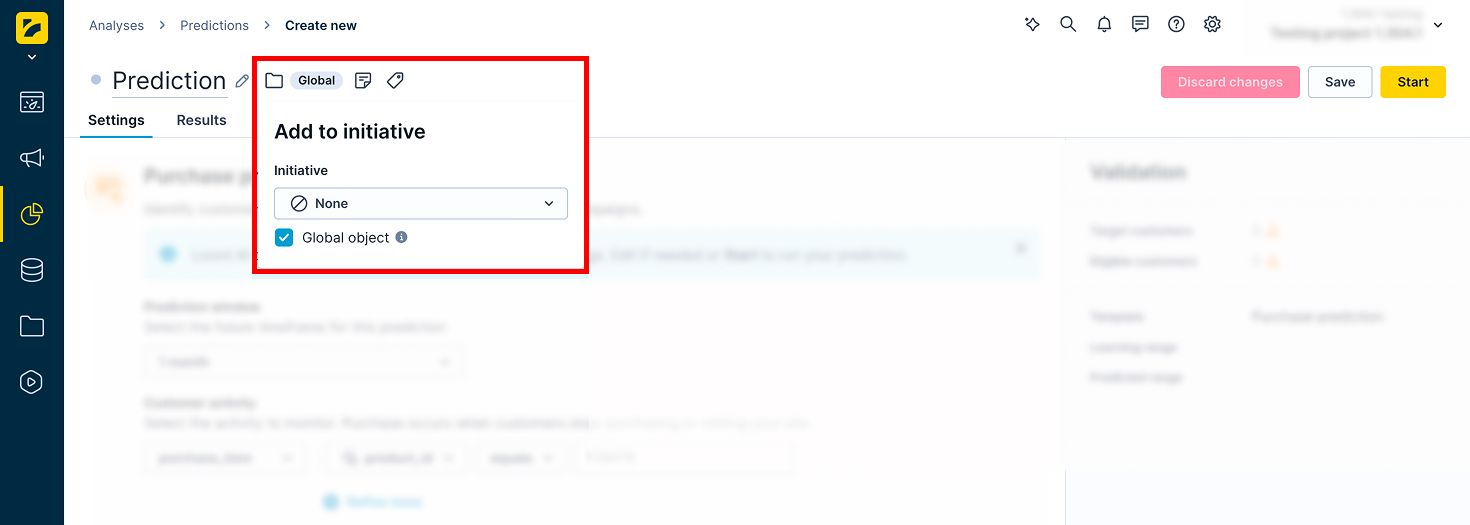
- If the prediction is part of an initiative, mark it as a global object to display it in the customer profile. Click the Initiative icon next to the prediction name and check the Global object box.
- Click Save, then Start to launch the calculation.
Monitor progress in the Results tab. The process typically takes between 20 minutes and a few hours, depending on the amount of data in your project.
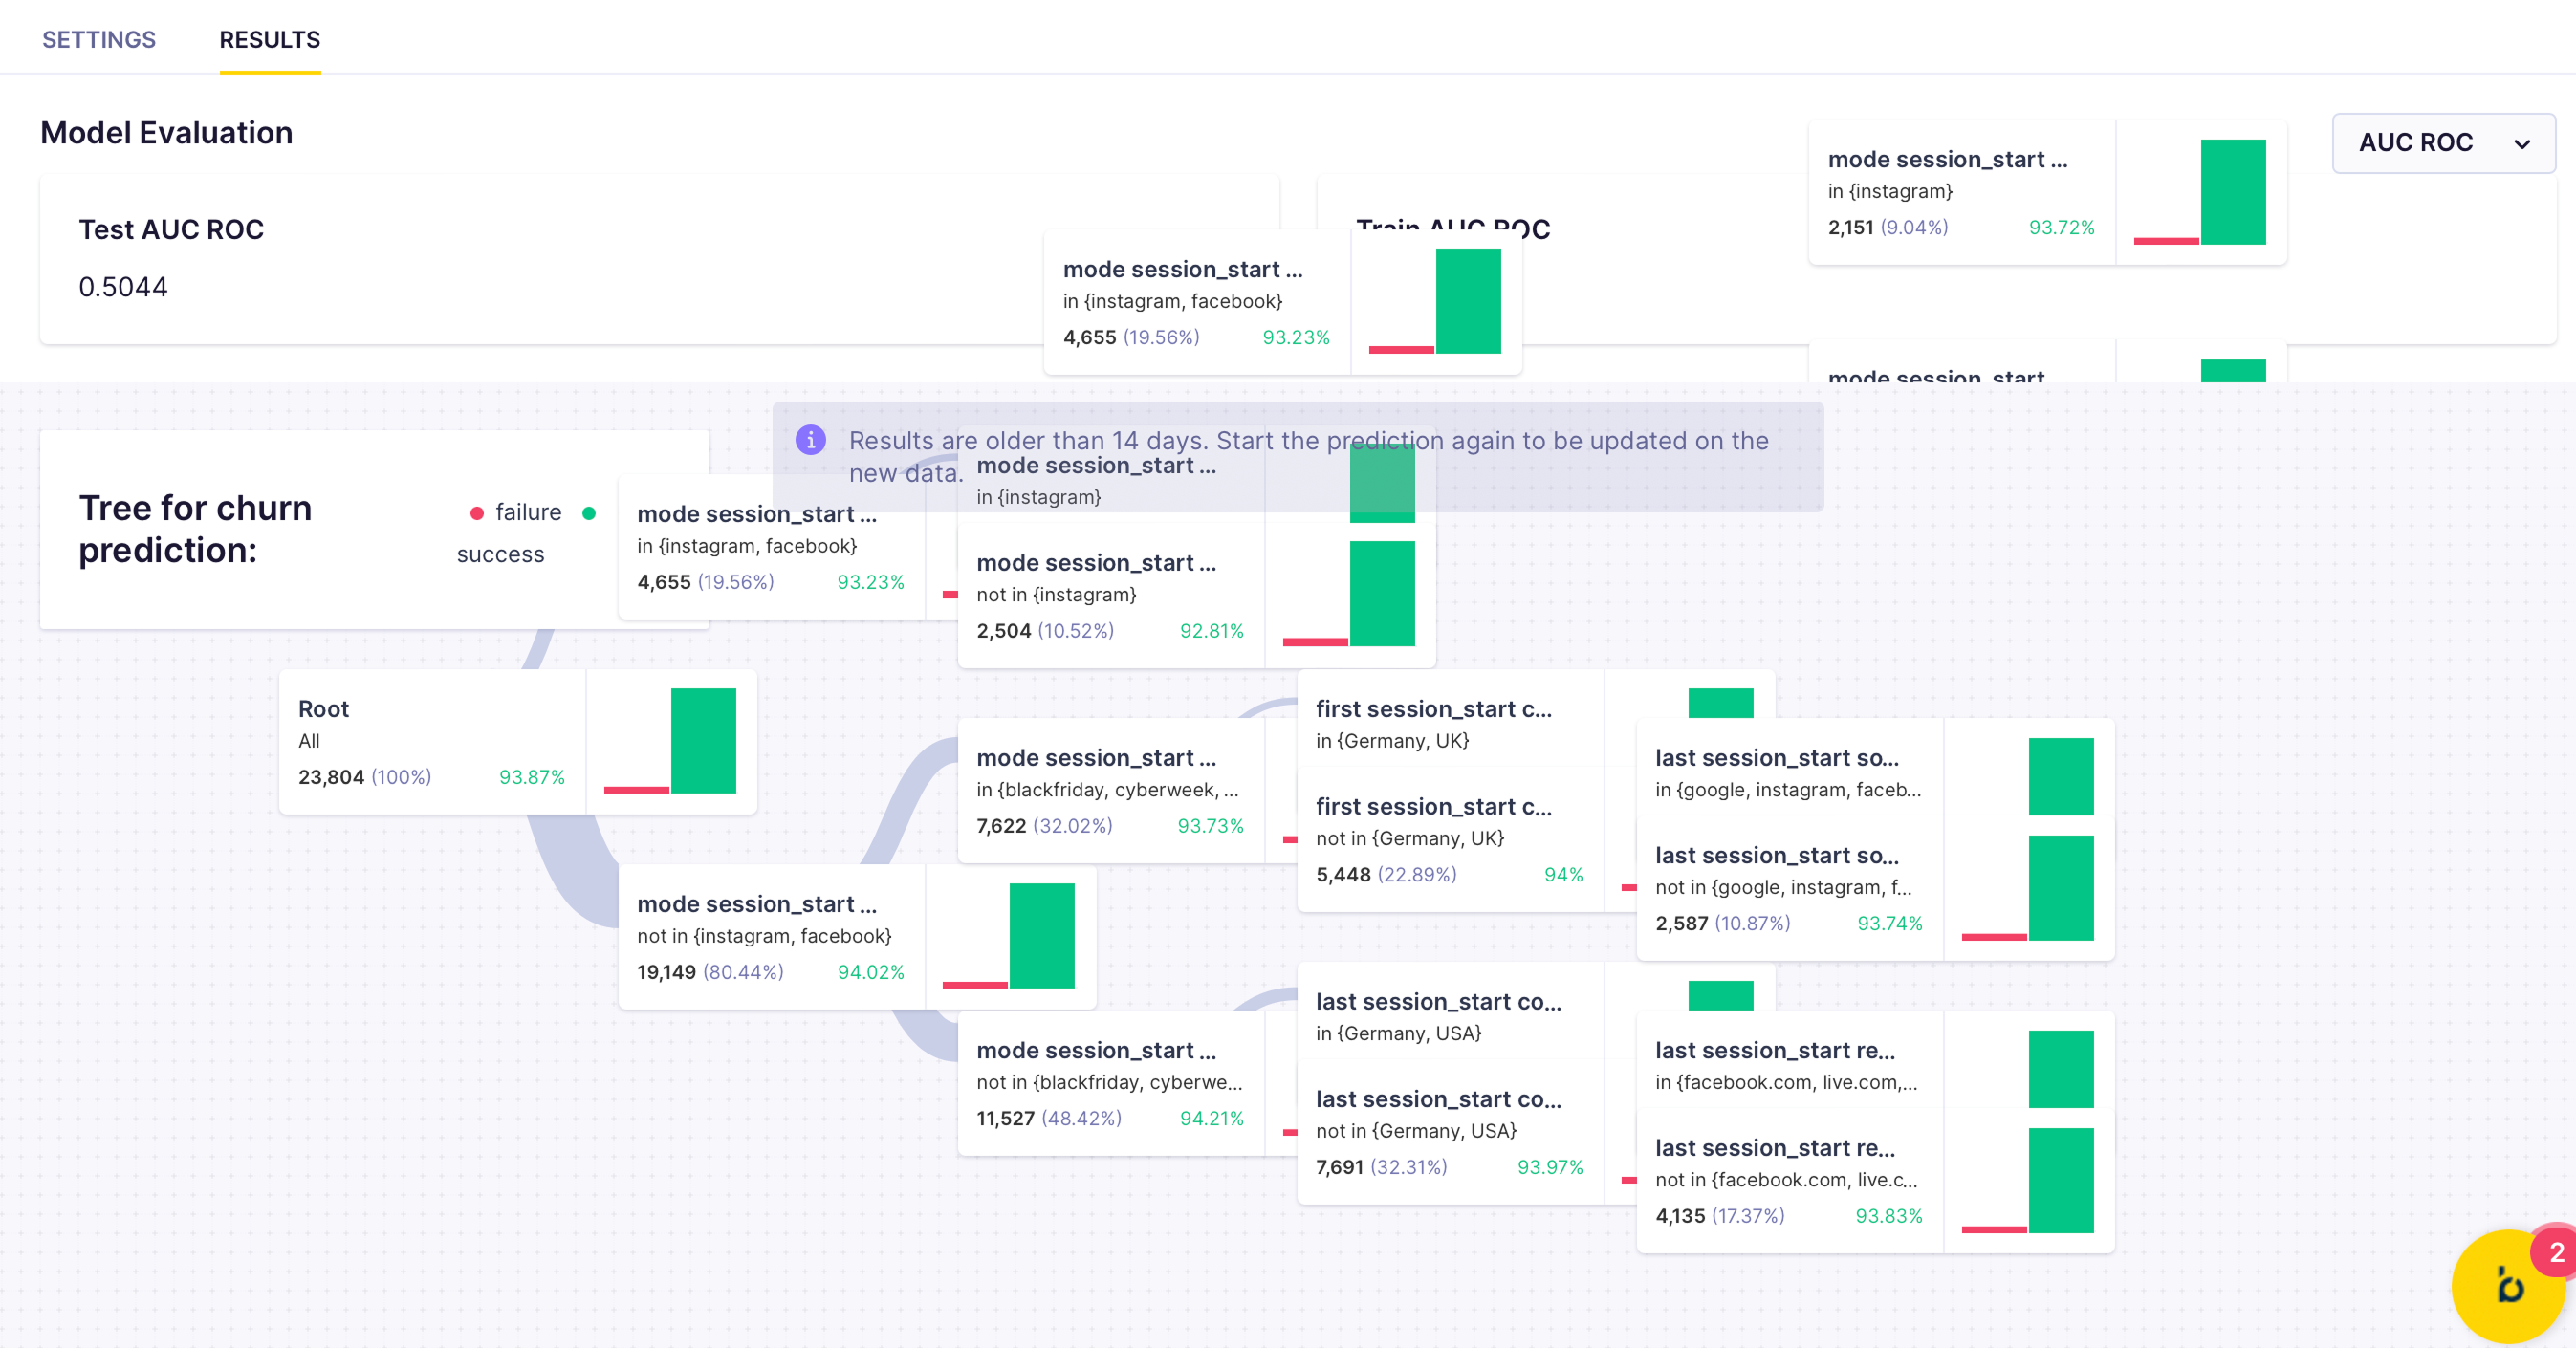
Evaluate the model's performance
In the Results tab, review the model's quality metrics and decision tree. For this model, use Area under the curve (AUC) as the primary metric.
If performance is unsatisfactory, try a different time frame or a custom prediction. For a full explanation of metrics and how to read the decision tree, see Interpret prediction results.
Create segmentation based on the model
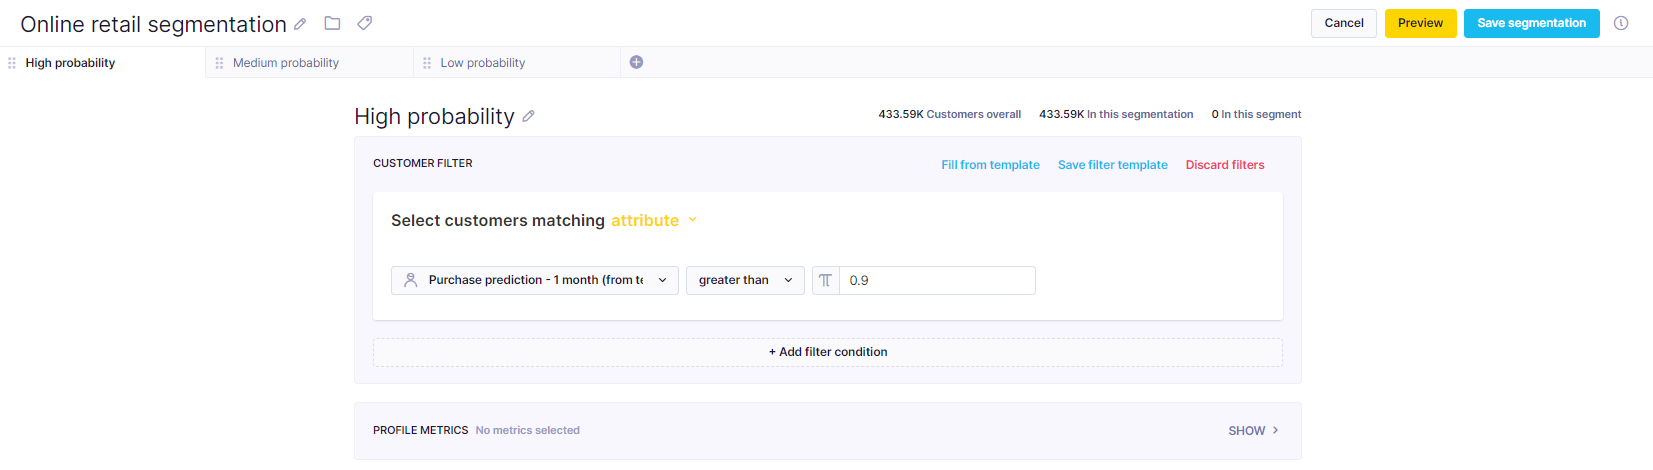
Using the prediction results, create a segmentation that divides customers into segments.
Every customer has the purchase prediction result stored in the Purchase prediction - [timeframe] property. The value is recalculated with the most up-to-date data every time its value is requested—the same way aggregates or segmentations work. The result is a value between 0 and 1 representing the probability that a customer will make a purchase in the defined time frame.
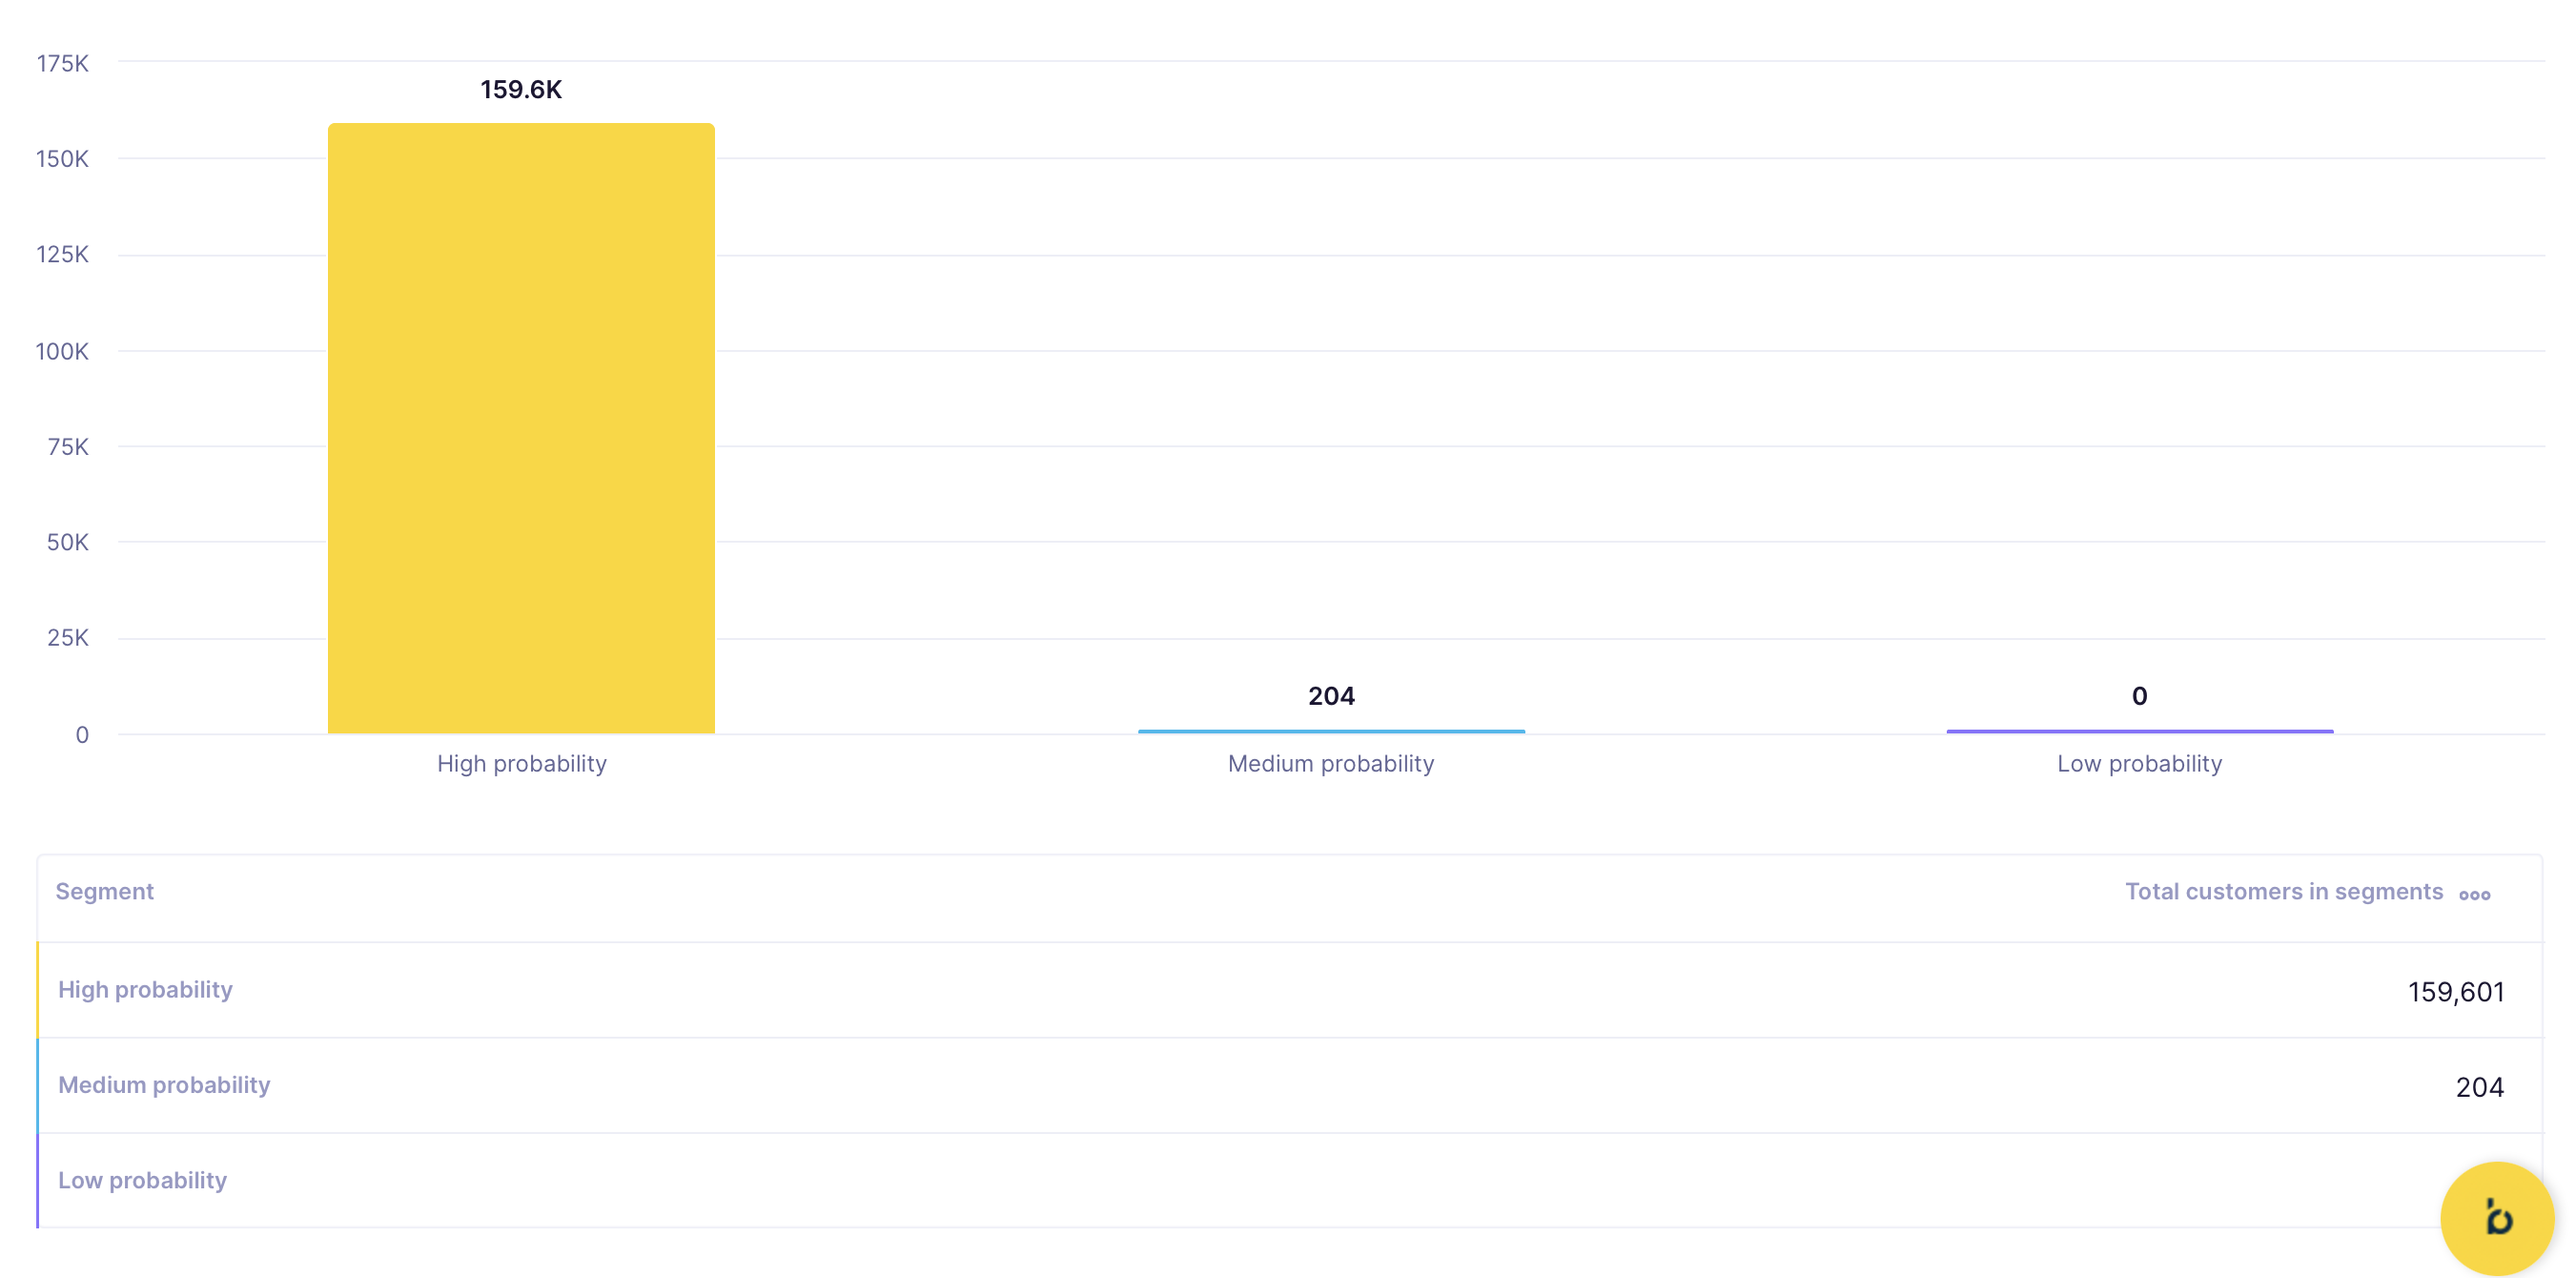
The example below uses three segments—adjust the thresholds to fit your use case:
- High probability: purchase prediction greater than
0.9(90%) - Medium probability: purchase prediction between
0.5and0.9(50%–90%) - Low probability: purchase prediction less than
0.5(50%)
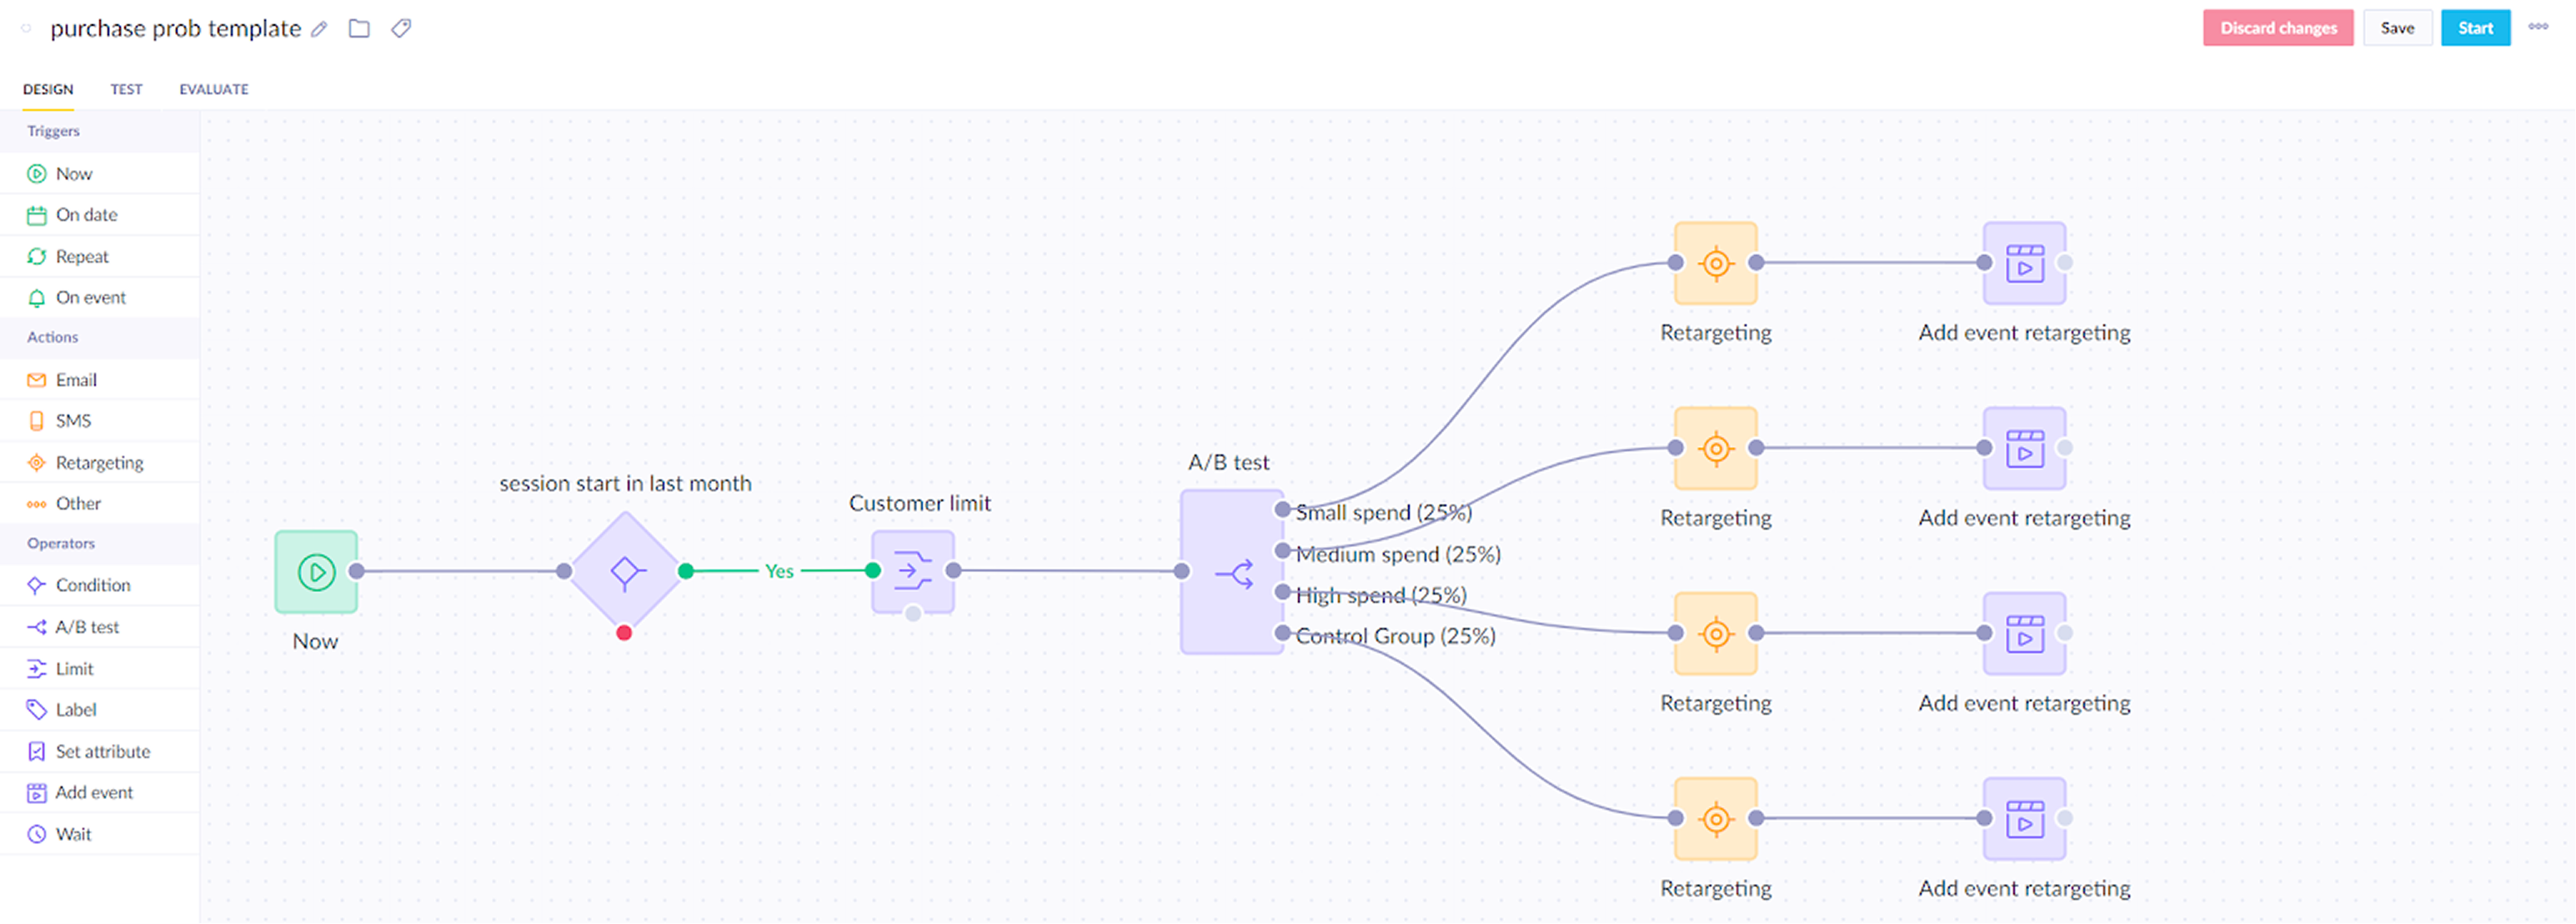
Create an A/B test
Create an A/B test to find the most effective approach for each customer segment.
- Divide customers into four groups, which map directly to your probability segments—one control group to measure the baseline, and one treatment group per probability tier:
- Control group
- Small spend
- Medium spend
- High spend
- Connect each group to a specific retargeting audience using the
retargetingnode—set its budget in your ads manager. - Append an
add eventnode to eachretargetingnode for evaluation. - For purchase prediction, include these four properties:
Campaign_name— the name of the current campaign (must be unique).Prediction_name— the name of the prediction used.Prediction_value— the current predicted value for the customer.Variant— the A/B test variant.
This gives you 12 segments (3 prediction segments × 4 audiences) to evaluate what works best for each.
Run and evaluate
Run the scenario for several days. Then, evaluate the following:
- Does the model have an impact on campaign effectiveness? Compare prediction segment performance against the control group.
- What works for each segment? Compare the uplift in performance against the amount spent to achieve it.
Learn how to measure prediction performance in Evaluate predictions.
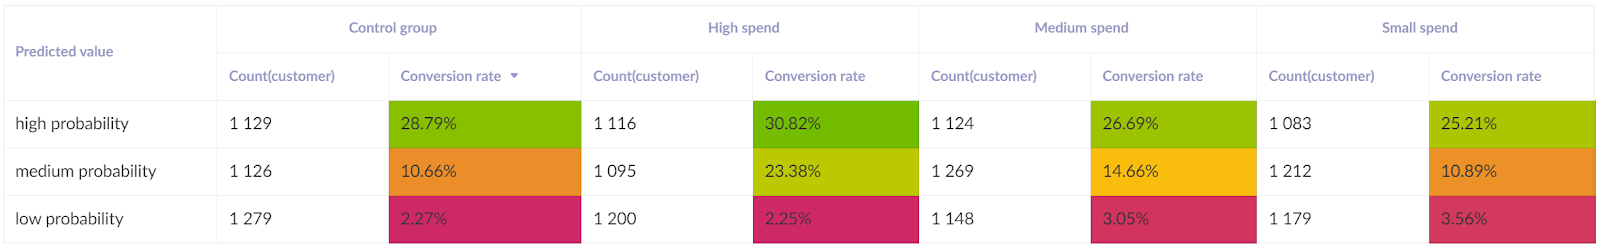
For example, in the example below, the model provides insights into the budget to allocate per customer group.
- The High spend segment needs few resources—increased spend doesn't significantly move this group as it activates readily.
- The Medium spend segment benefits most from increased budget, as it meaningfully raises the likelihood of purchase.
- The Low spend segment doesn't justify additional investment, as it doesn't translate into more purchases.
NoteTo check whether the difference between a variant and the control group is statistically significant, use the Bayesian A/B test calculator.
Based on the evaluation, adjust the campaign so that real-time predictions drive optimal retargeting budget planning.
Use the purchase prediction property
The A/B test is one way to act on the prediction. The purchase prediction property is also available across the platform wherever customer attributes are accepted.
- Segmentations — filter by purchase probability to build high-intent audiences, for example
purchase_prediction_30d > 0.7. - Scenarios — branch customers based on purchase probability: route high-probability into promotions, lower-probability into lower-touch approaches.
- Reports — track lift charts, distribution, and performance across prediction segments.
Related articles
Prediction use cases: Explore real-world examples of how predictions can personalize customer experiences and drive engagement.
Updated 2 months ago