

Churn prediction
Churn prediction identifies customers unlikely to make another purchase, so you can re-engage them before they're lost. For each eligible customer, the model predicts whether they'll buy again within a chosen future window and assigns a churn probability score you can act on.
Use it to retain high-value customers, trigger win-back flows, and prioritize at-risk segments for outreach or incentives.
How the model works
To be eligible for model training, a customer must have at least one activity event within the training window you define.
The model then checks whether each eligible customer performs the activity again during the prediction window. Customers with no activity in that future window are labeled as churned, the rest are labeled as retained.
The model is trained to predict each active customer's churn probability.
Churn prediction workflow
The churn prediction workflow consists of the following steps:
- Create a prediction model.
- Evaluate the model's performance.
- Create an A/B test.
- Evaluate and run.
- Use churn prediction.
Create a prediction model
-
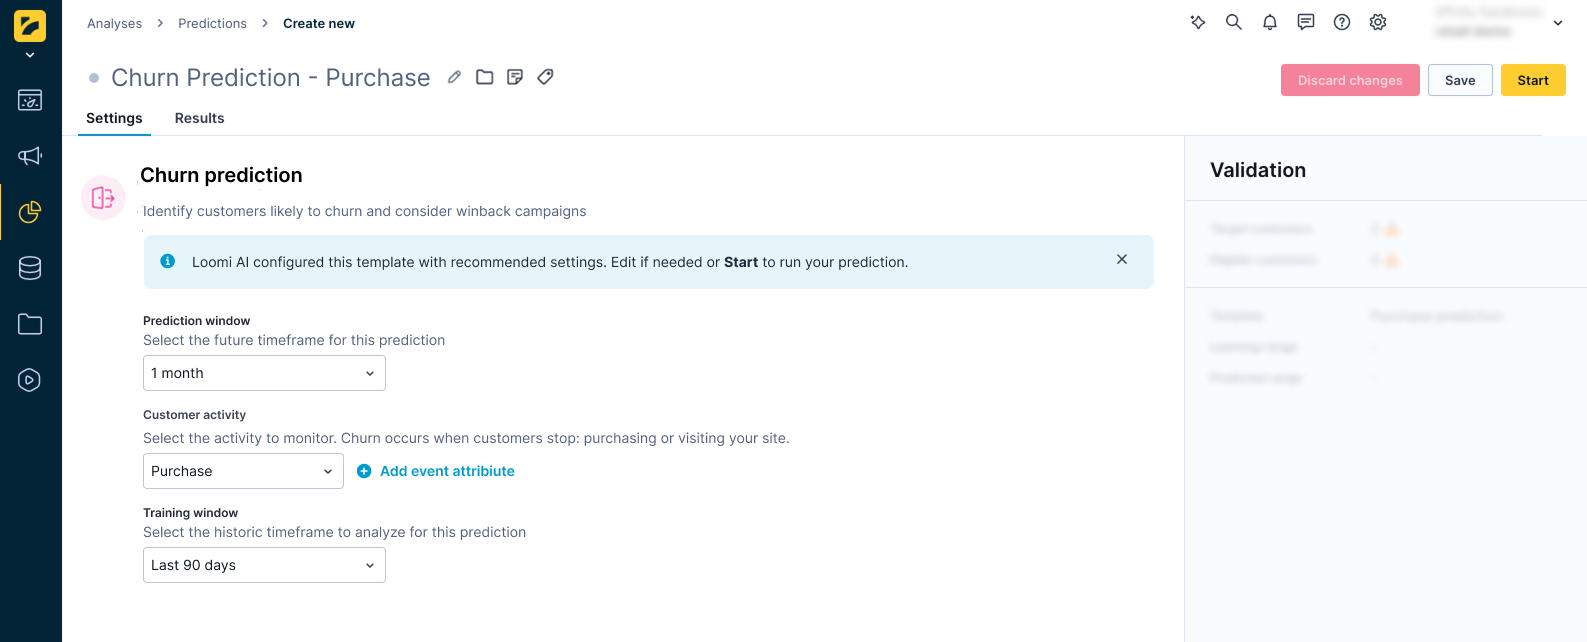
Go to Analyses > Predictions, click + New prediction, and select Churn prediction.
-
Specify the prediction window — how long without activity counts as churn risk. Select from the following options:
- 1 day
- 1 week (7 days)
- 2 weeks (14 days)
- 1 month (30 days)
- 3 months (90 days)
- 1 year (365 days)
Short windows flag customers who disengage quickly; longer windows identify customers with naturally slower purchase cycles who may not be at risk yet.
-
Define what counts as an active customer — the events the model uses to identify engagement.
- Select the events, for example,
purchase,session_start,app_open, orsubscription_renewed. - Apply static filters to narrow the definition — for example,
device_type = 'mobile'orcategory = 'subscriptions'.
- Select the events, for example,
-
Select the training window — how far back the model looks for the customer activity you defined above. Select from the following options:
- 30 days
- 90 days
- 180 days
- 1 year
-
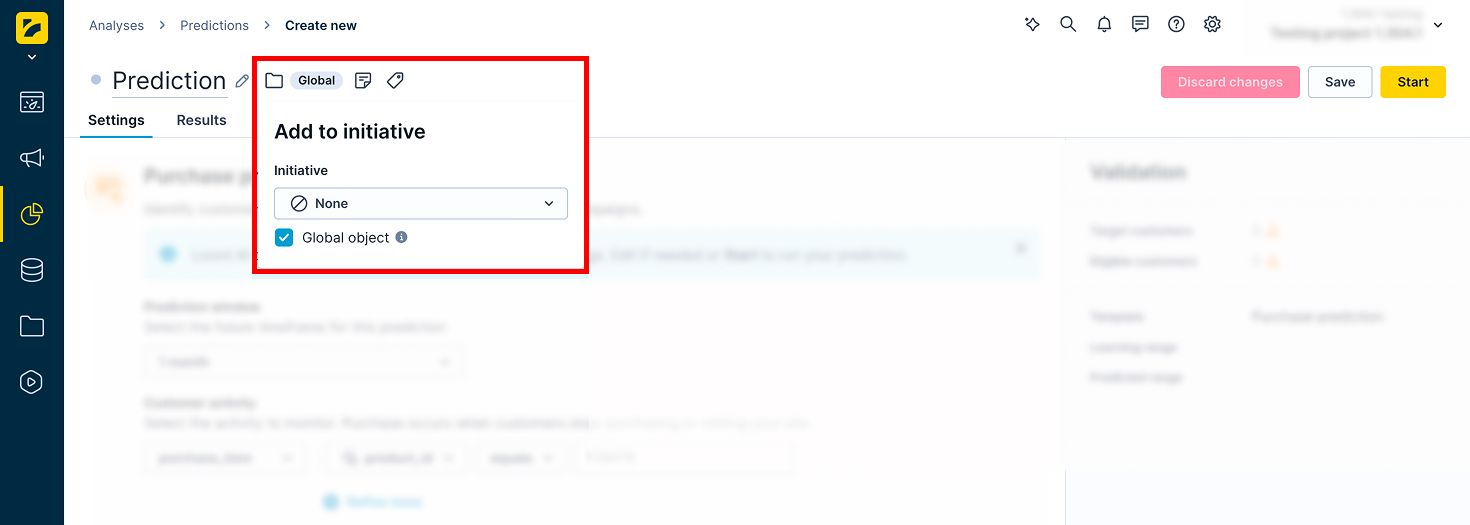
If the prediction is part of an initiative, mark it as a global object to display it in the customer profile. Click the Initiative icon next to the prediction name and check the Global object box.
-
Click Save, then Start to launch the calculation.
Monitor progress in the Results tab. The process typically takes between 20 minutes and a few hours, depending on the amount of data in your project.
Evaluate the model's performance
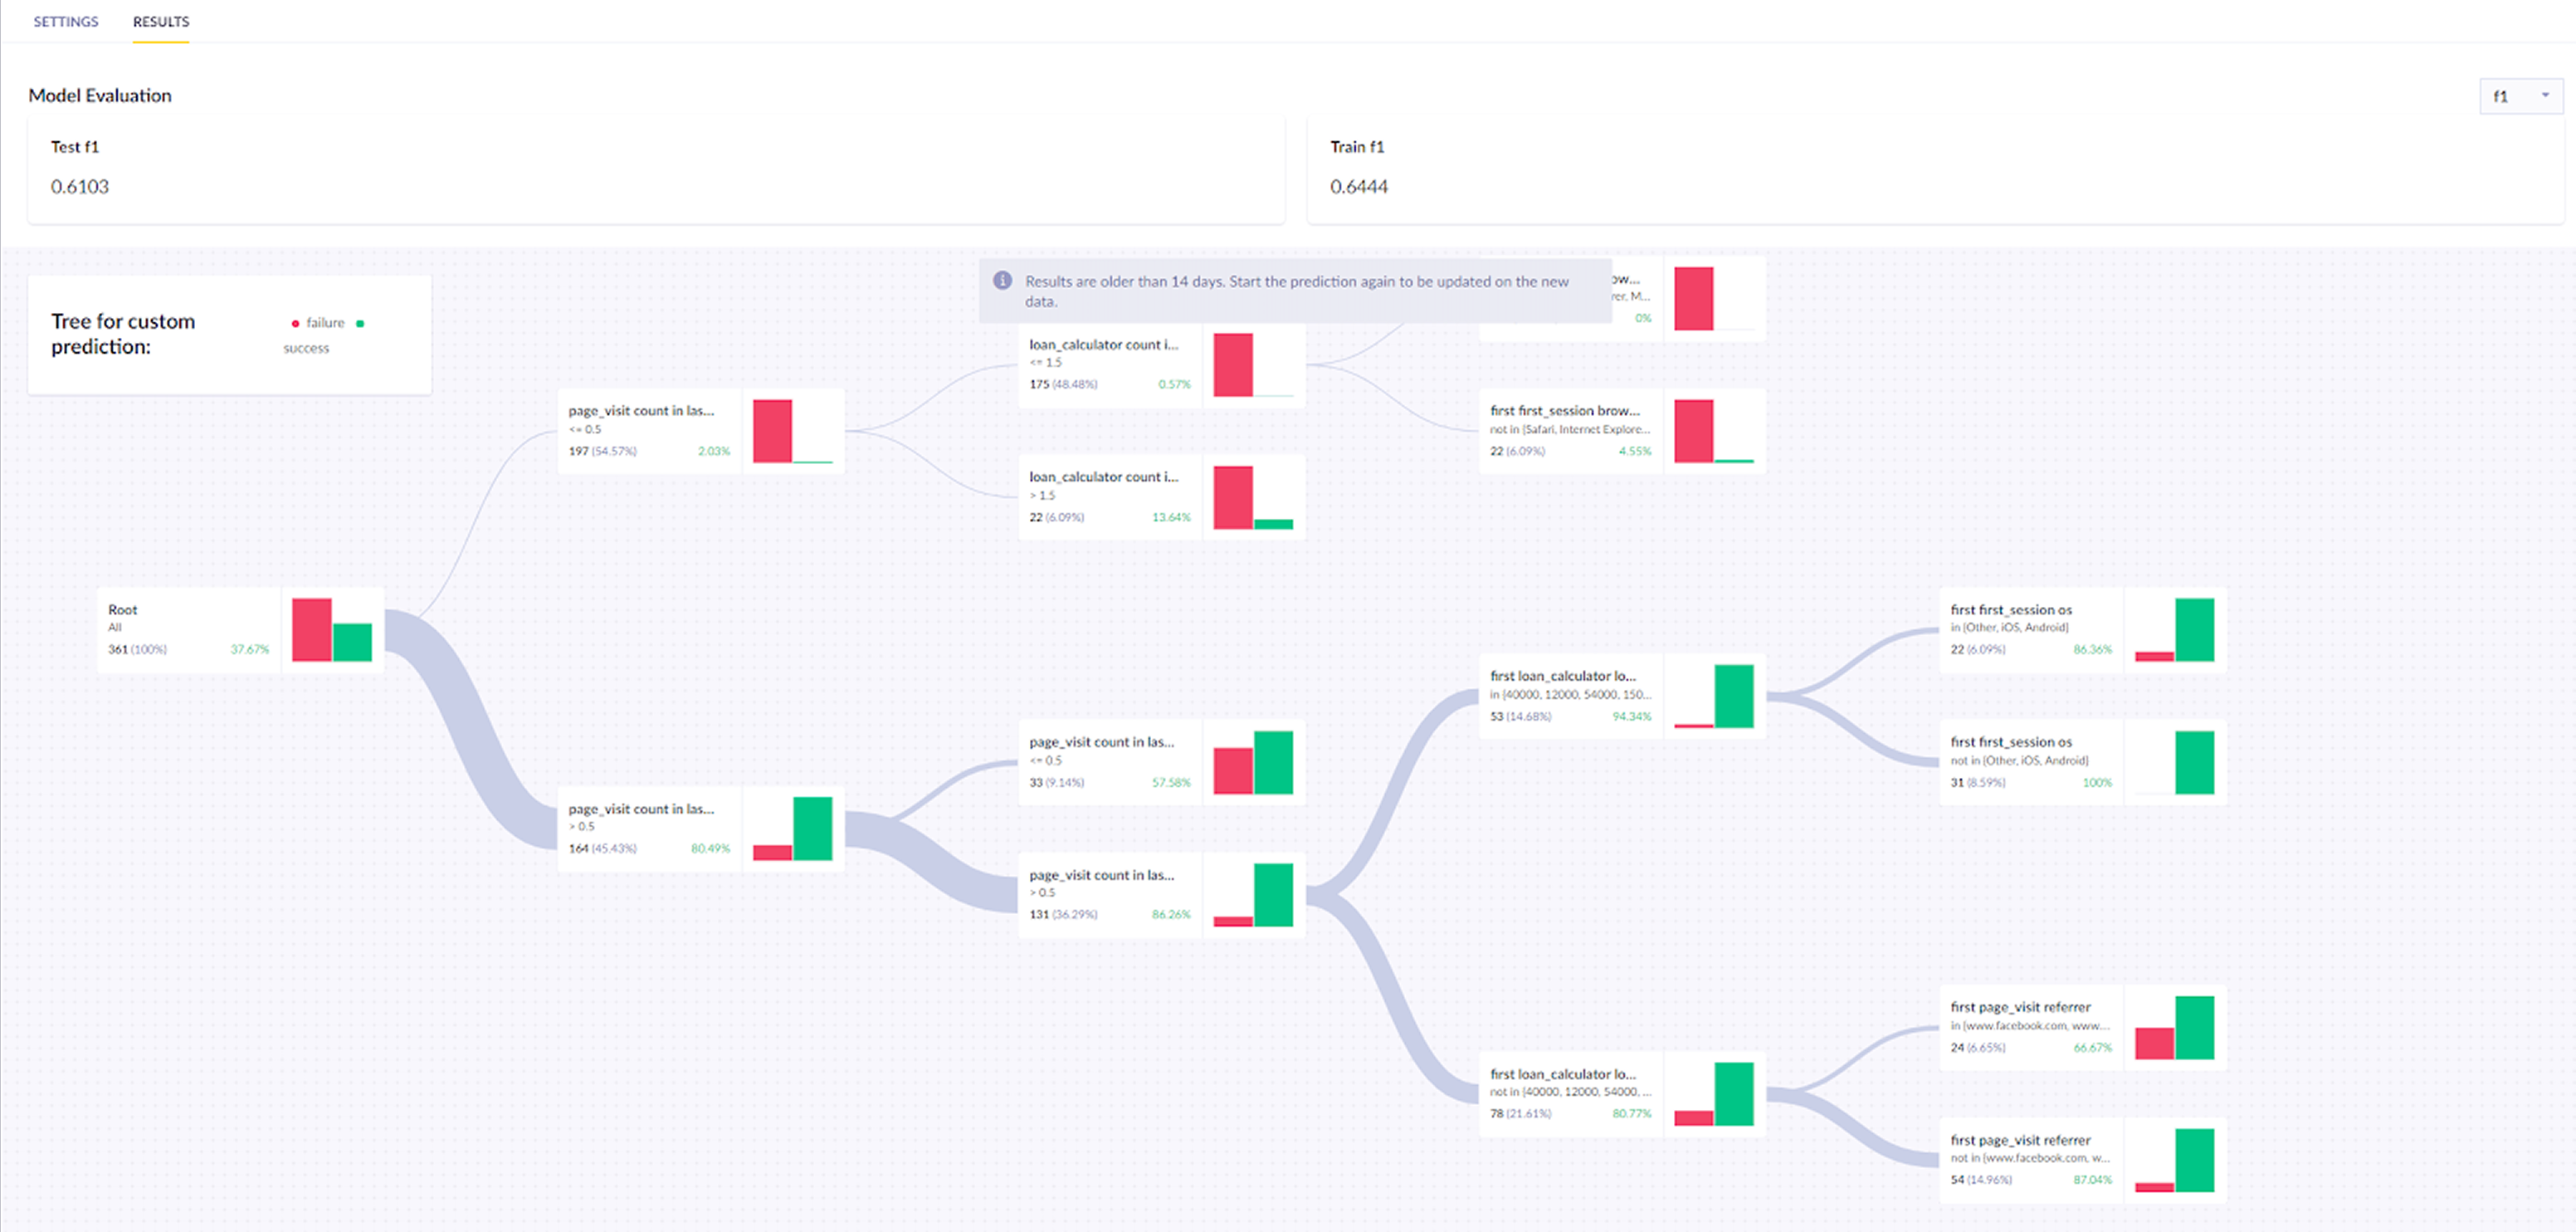
In the Results tab, review the model's quality metrics and decision tree. For this model, use Area under the curve (AUC) as the primary metric.
If performance is unsatisfactory, try a different time frame or a custom prediction. For a full explanation of metrics and how to read the decision tree, see Interpret prediction results.
The result is stored per customer in a property called Churn prediction [1 month], which represents the probability of a repeat purchase in the next month and ranges from 0 to 1.
Create an A/B test
Before running the A/B test, identify your high-risk threshold. Churn probability distributions vary by project. Run a report with the prediction in rows and customer count as the metric to see where your customers cluster, then set your threshold accordingly.
Once identified, A/B test whether incentivizing them increases the likelihood of a repeat purchase. Divide them into two groups:
- Variant
- Control group
Target the Variant group with a purchase-incentivizing campaign and leave the Control group untargeted. This lets you measure whether the campaign had any effect.
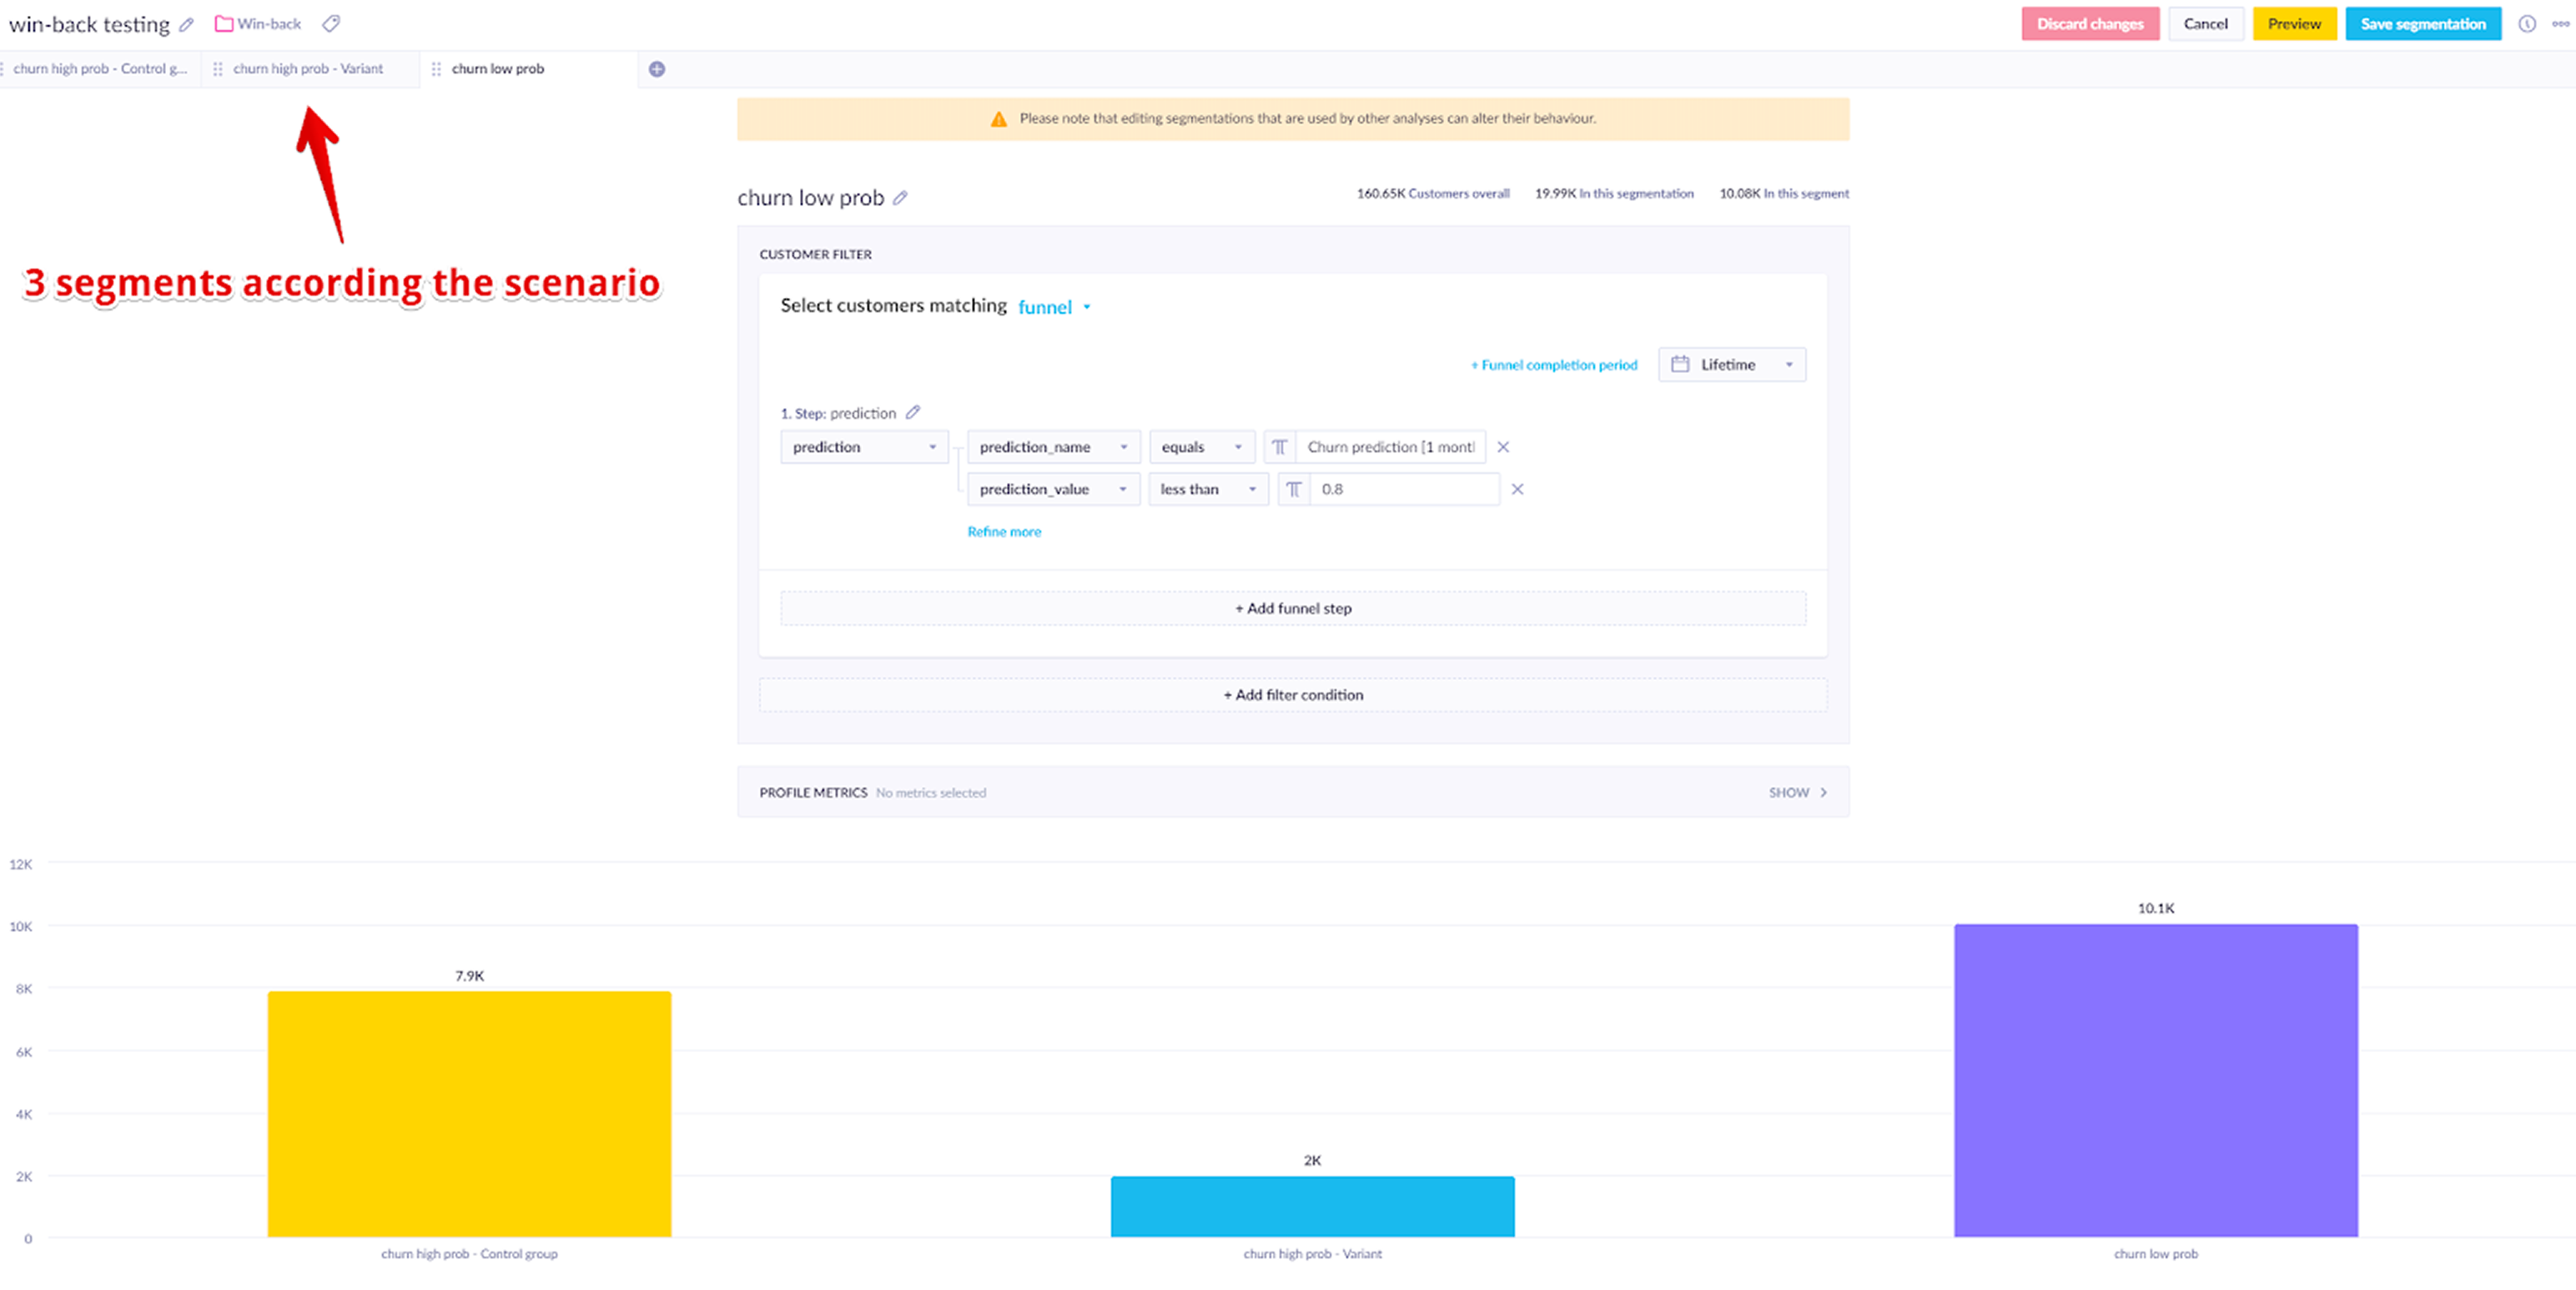
In the example below, the scenario targets customers who:
- Were active in the last 30 days
- Have a churn probability above 0.8
A sample of 10,000 customers with a lower churn probability is also tracked to compare future behavior against the control group.
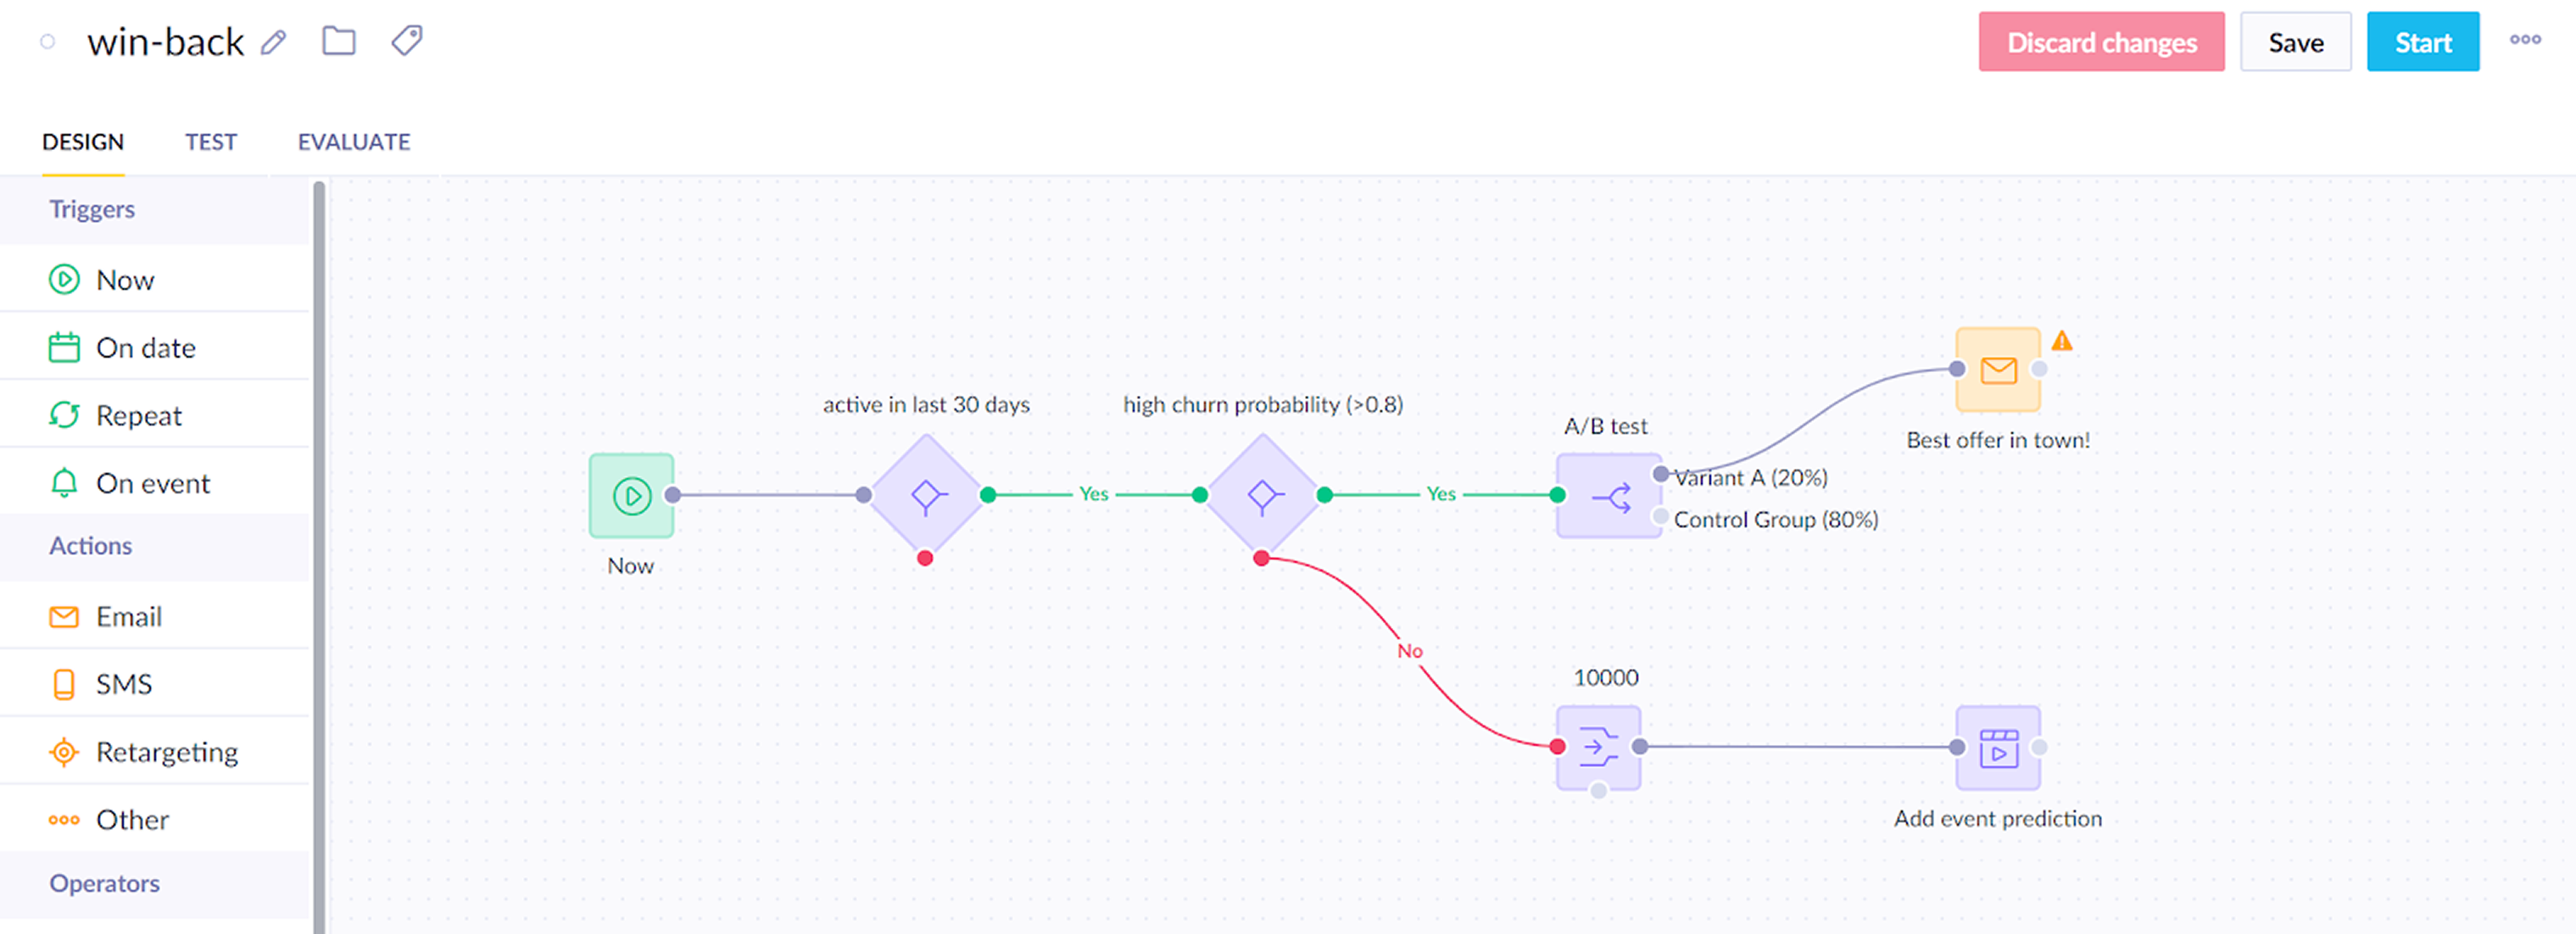
This gives you three segments to compare: the Variant group receiving the campaign, the Control group of high-risk customers who didn't, and the lower-risk sample tracked as a baseline.
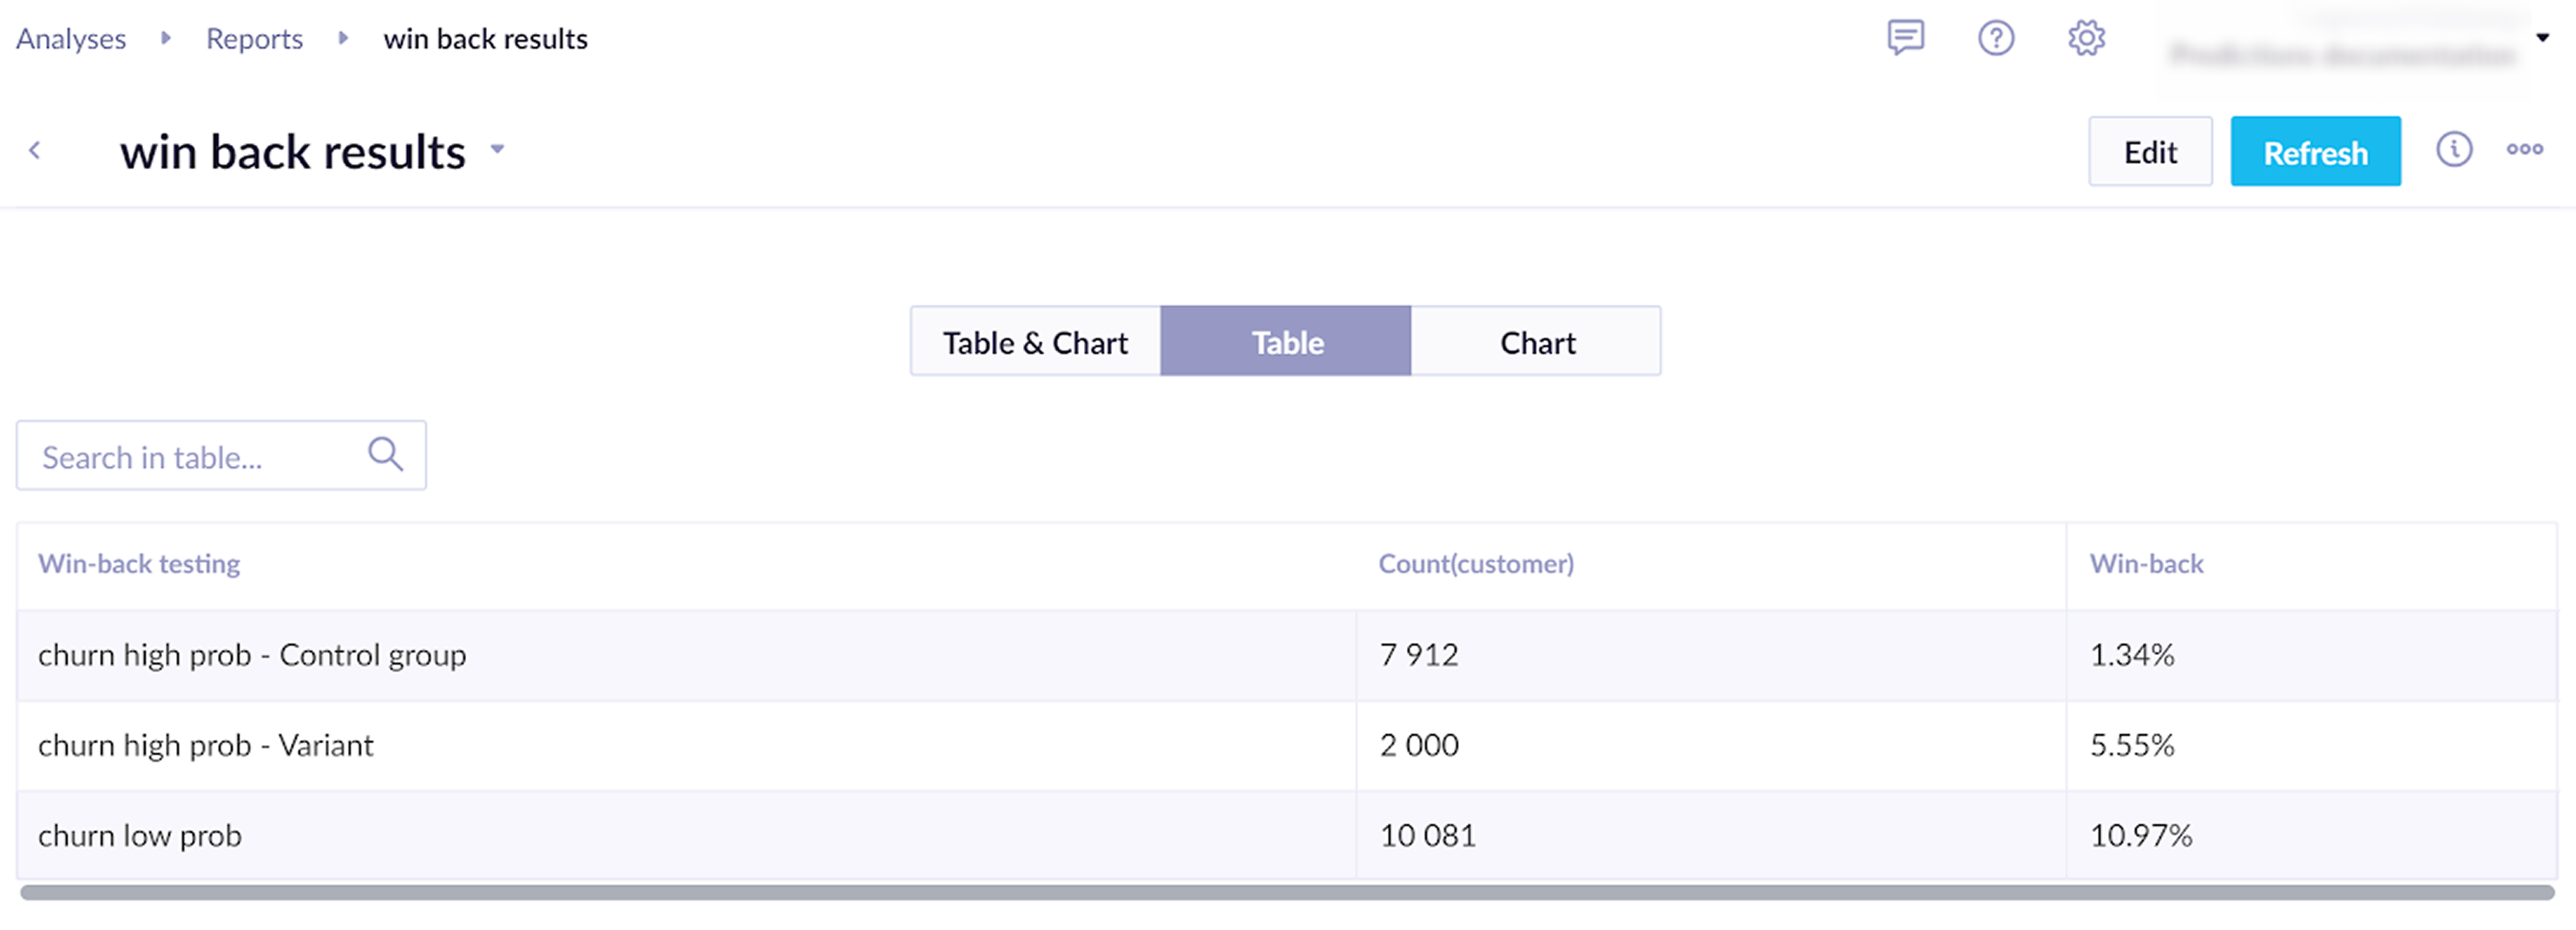
Run and evaluate
Run the scenario for several days. Then, evaluate the following:
- Does the model have an impact on campaign effectiveness? Compare the Control group with the lower churn probability customers who have the added prediction event.
- Does the incentive work? Compare the Control group with the Variant.
Learn how to measure prediction performance in Evaluate predictions.
To check whether the difference between a variant and the control group is statistically significant, use the Bayesian A/B test calculator.
Based on the evaluation, adjust the campaign to support real-time predictions and incentivize likely churners to make a purchase.
Use churn prediction
The churn probability attribute can be used across:
- Segmentations — for example, customers with
churn_probability_30d >= 0.8as a high-risk segment. - Scenarios — run win-back flows for high-risk customers; hold out a control group for A/B testing.
- Reports — track how churn probability relates to actual future activity to validate thresholds.
Related articles
Prediction use cases: Explore real-world examples of how predictions can personalize customer experiences and drive engagement.
Updated 4 months ago