

Multinomial classification use case
Multinomial classification is a custom prediction that predicts the communication channel most likely to drive engagement for each customer, such as email or browser push notification. Instead of sending every customer through the same channel, use it to route each person through the channel they're most likely to respond to, maximizing campaign effectiveness.
In this example, the prediction determines whether email or browser push notifications drive more clicks.
Create a prediction model
Follow these steps to configure a multinomial classification prediction for channel optimisation.
Go to Analyses > Predictions > + New prediction > Custom prediction.
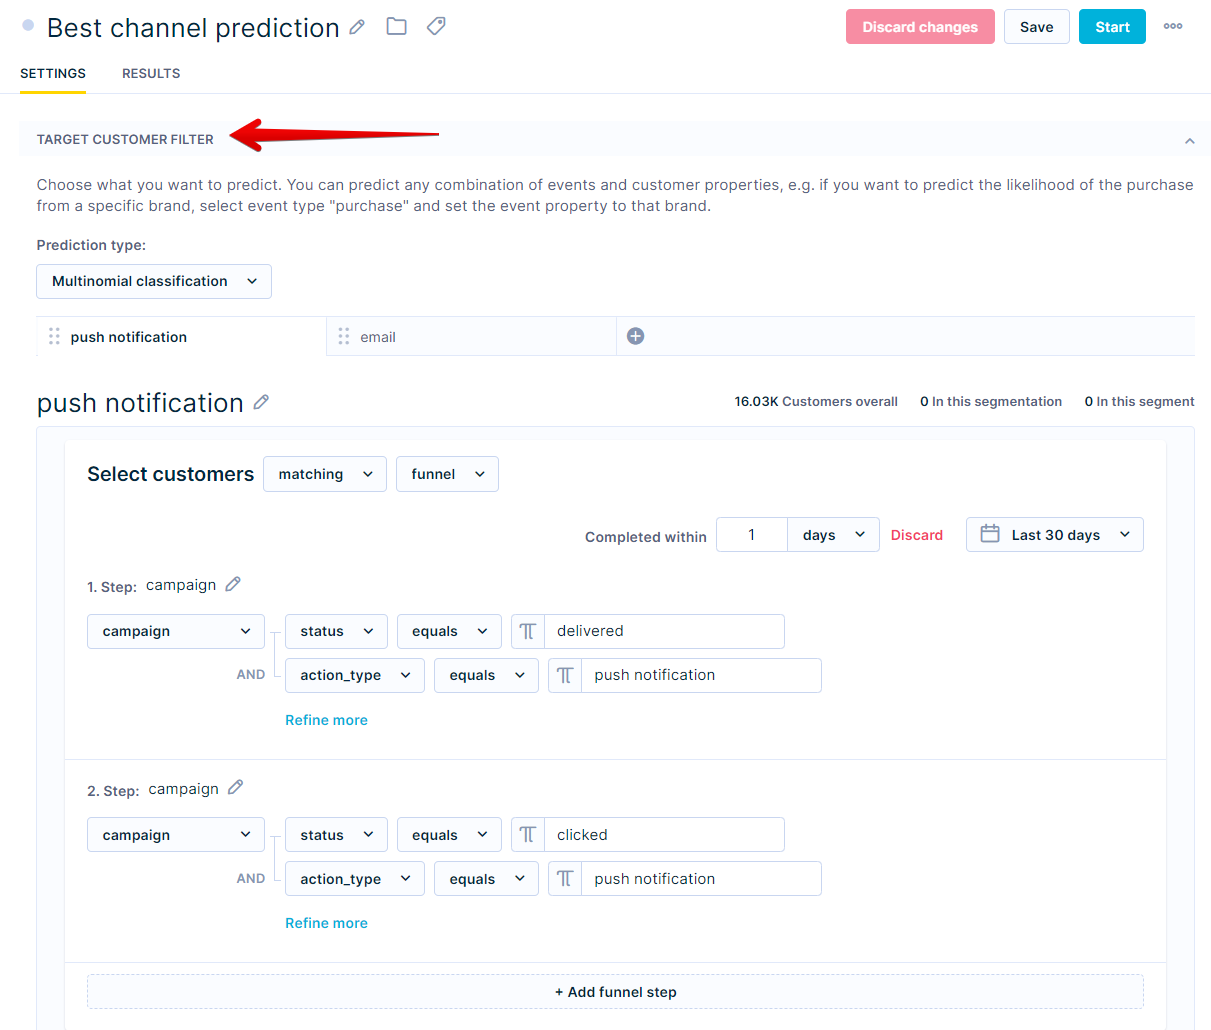
Target customer filter
Prediction type
Set the prediction type to Multinomial classification.
Filter condition
Define the target events for each channel. For each channel, set two filter conditions — one for a delivered campaign and one for a click — to capture customers who received and engaged with that channel.
Segment names in the Target customer filter can't contain a dot (
.) or dollar sign ($) and can't be empty, as these cause an error. For example, rename a segment named2.5to2_5.
In the example below, there are two target customer filters: one for email and one for push notification.
Create two separate target filters — one per channel. For each, add the following conditions:
- Email filter: campaign where
statusequals delivered andaction_typeequals email + campaign wherestatusequals clicked andaction_typeequals email. - Push notification filter: campaign where
statusequals delivered andaction_typeequals push notification + campaign wherestatusequals clicked andaction_typeequals push notification.
The target captures a click following a delivered campaign. Each channel becomes a segment — the model learns which customers are more likely to click email versus push notification and assigns each one their best channel.
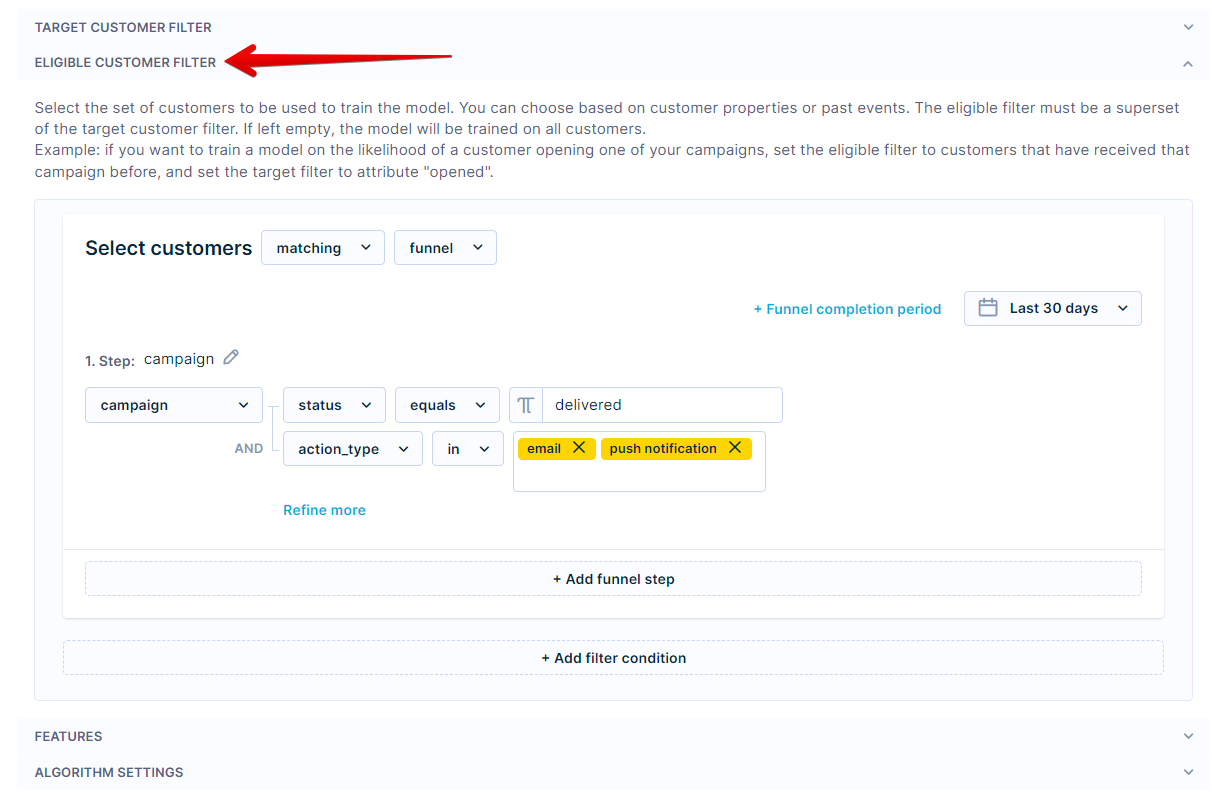
Eligible customer filter
Eligible customers will then be filtered by campaign where
statusequals delivered, andaction_typein email, push notification
Set the time frame to the last 30–90 days. Start with 30 days if your campaign volume is high — extend to 90 days if you need more data to meet the minimum customer threshold.
Features
The goal is to predict which channel a customer will click on right now — not in the future.
- Select the same time frame as the target window.
- Enable Is floating time window.
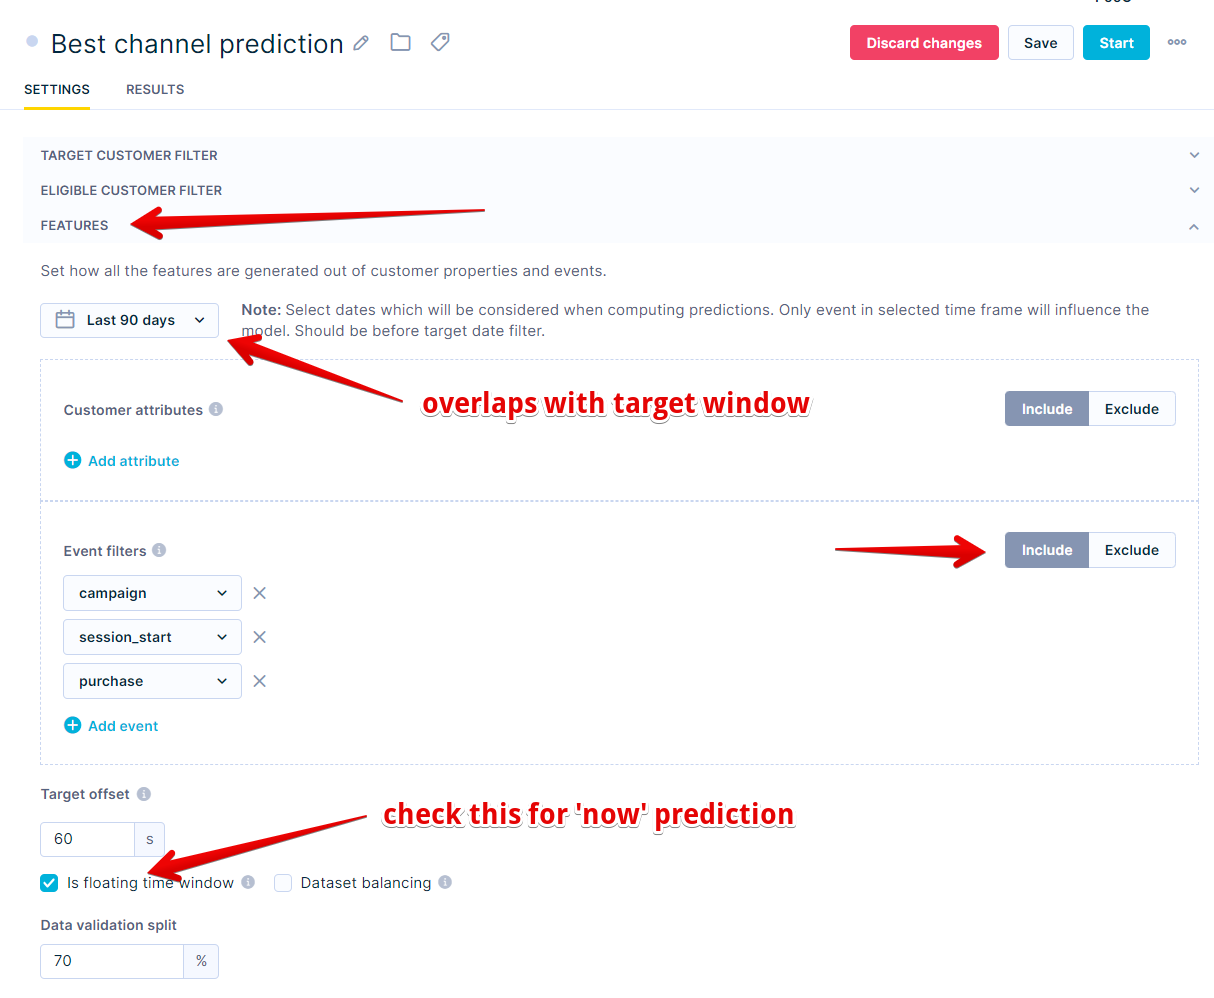
Using this configuration, the feature window is calculated per customer based on the timestamp of their delivered campaign.
Algorithm settings
Use the default algorithm settings unless you have specific preferences.
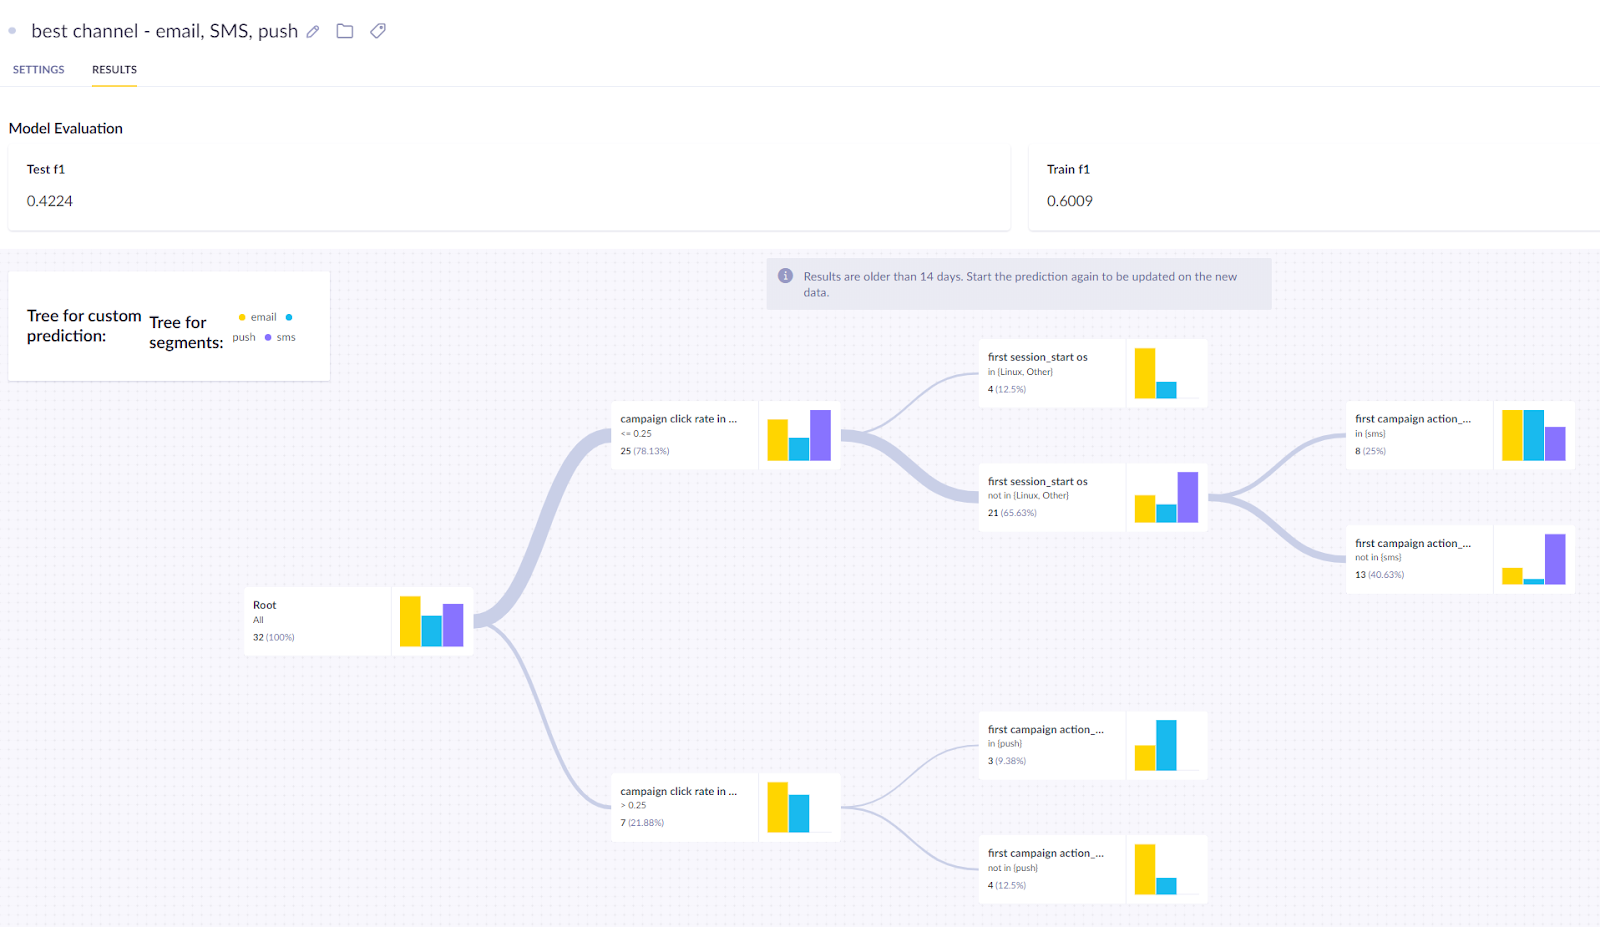
Evaluate the model's performance
In the Results tab, review the model's quality metrics and decision tree. For this model, use F1 as the primary metric.
If performance is unsatisfactory, try a different time frame or a custom prediction. For a full explanation of metrics and how to read the decision tree, see Interpret prediction results.
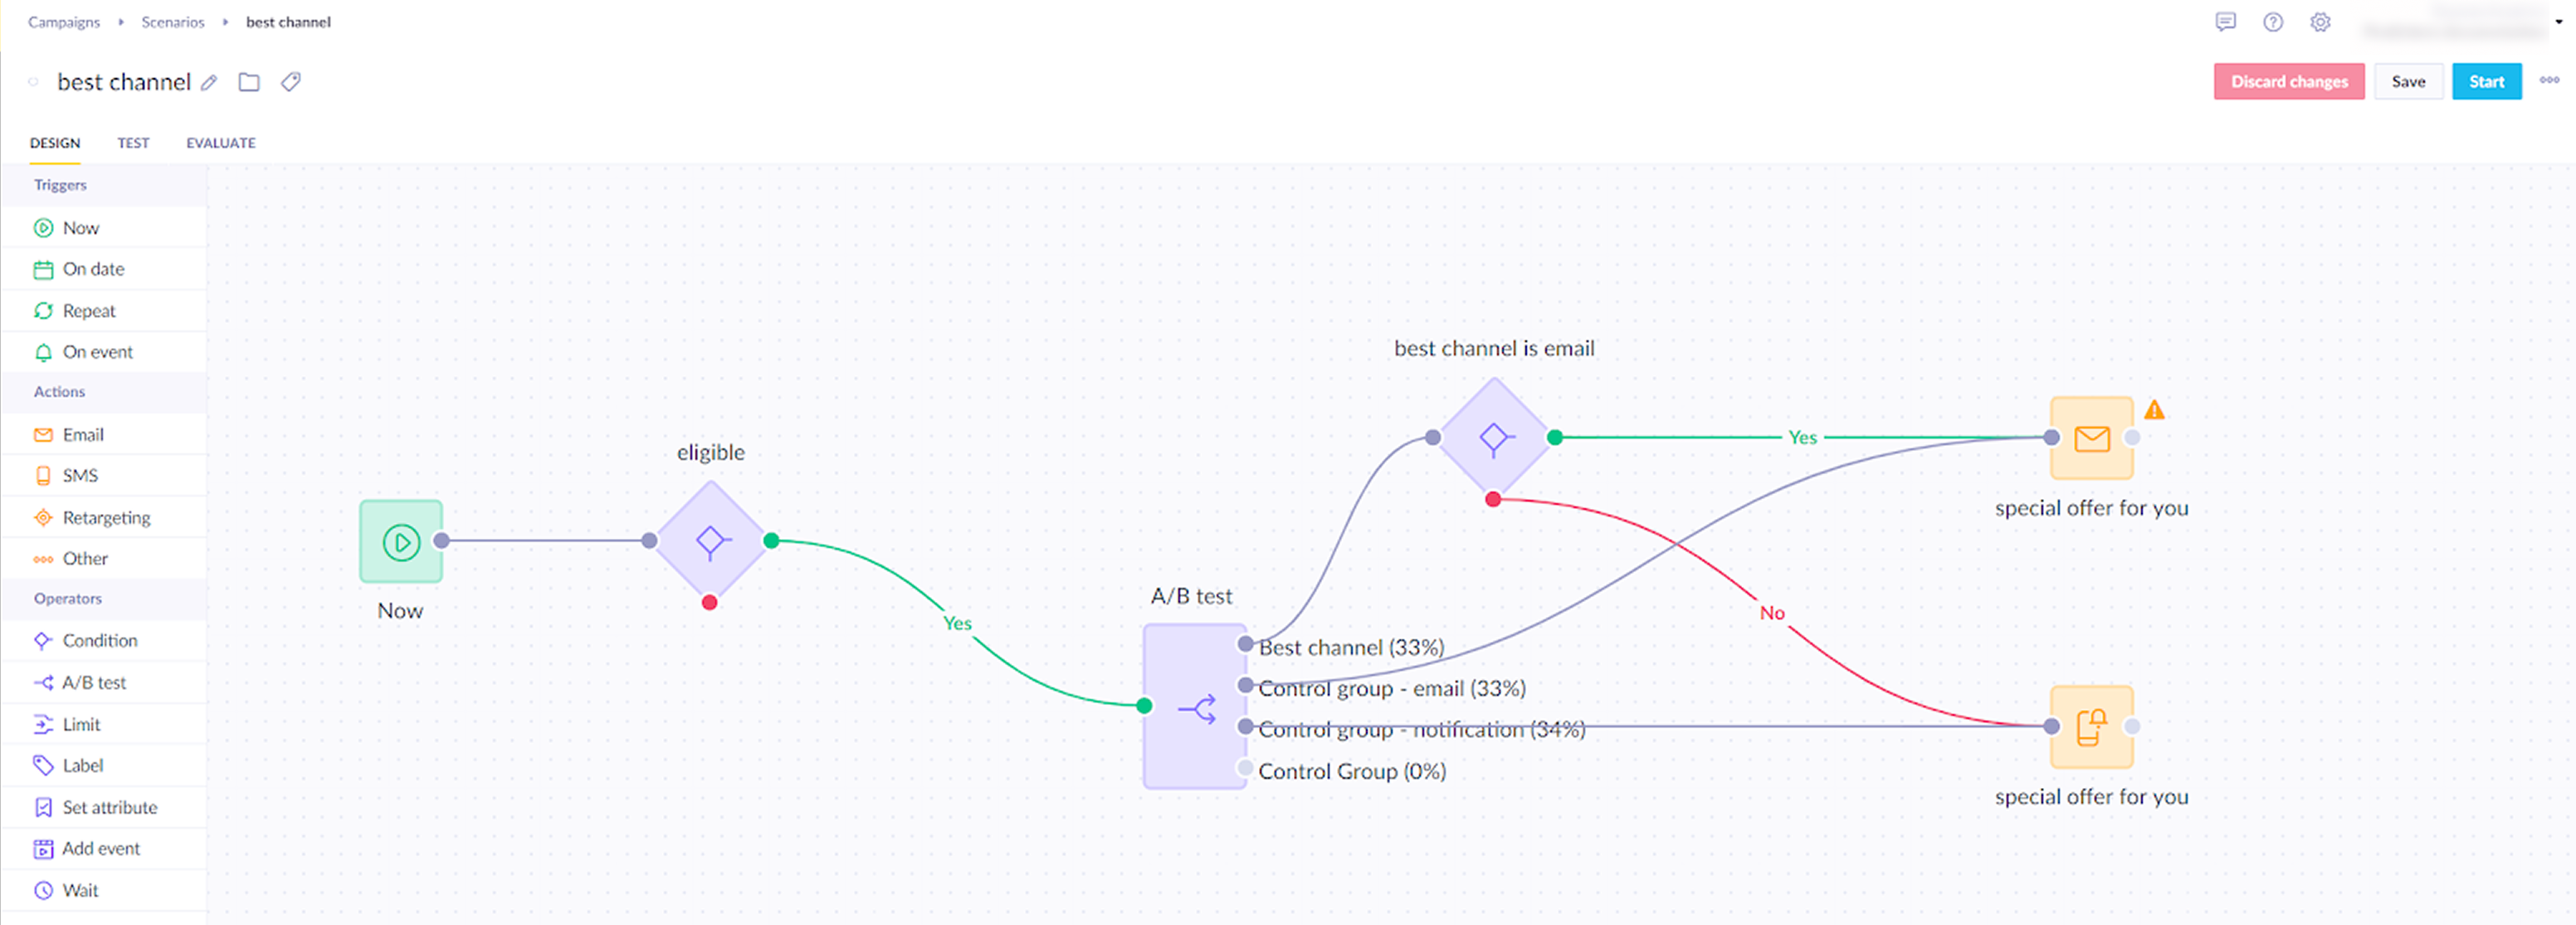
Create an A/B test
After evaluating the model, test whether the prediction improves campaign performance by comparing it against each single-channel approach. Split customers into three groups:
- Variant — uses the channel predicted by the model for each customer.
- Control group A — all customers receive email.
- Control group B — all customers receive push notification. This lets you compare personalised routing against a consistent single-channel strategy.
Evaluate and run
Run the scenario for several days, then compare performance across all three groups to determine whether personalised channel routing outperforms sending everyone the same channel — email or push.
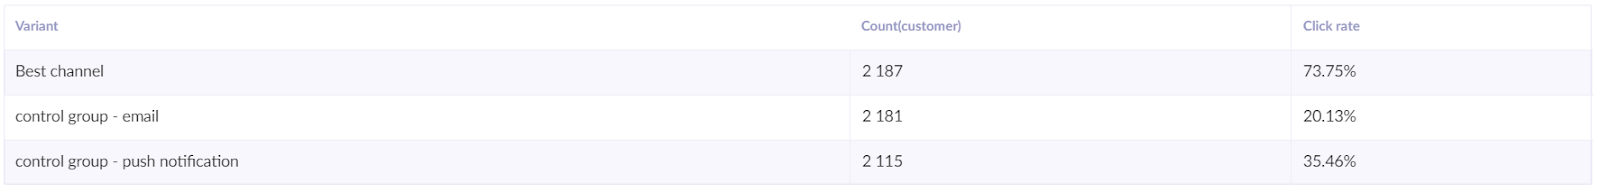
To check whether the difference between a variant and the control group is statistically significant, use the Bayesian A/B test calculator.
Based on the results, update your scenario to route all customers through the predicted best channel — removing the control groups once you've confirmed the prediction drives stronger engagement than either single-channel approach.
Updated 4 months ago