

Create and customize a funnel analysis
This guide walks you through building a funnel analysis from scratch, managing steps, and using the available customization and analysis tools to get more from your data.
Create a funnel analysis
- Go to Analyses > Funnels.
- Click the + sign next to Funnels in the dropdown menu.
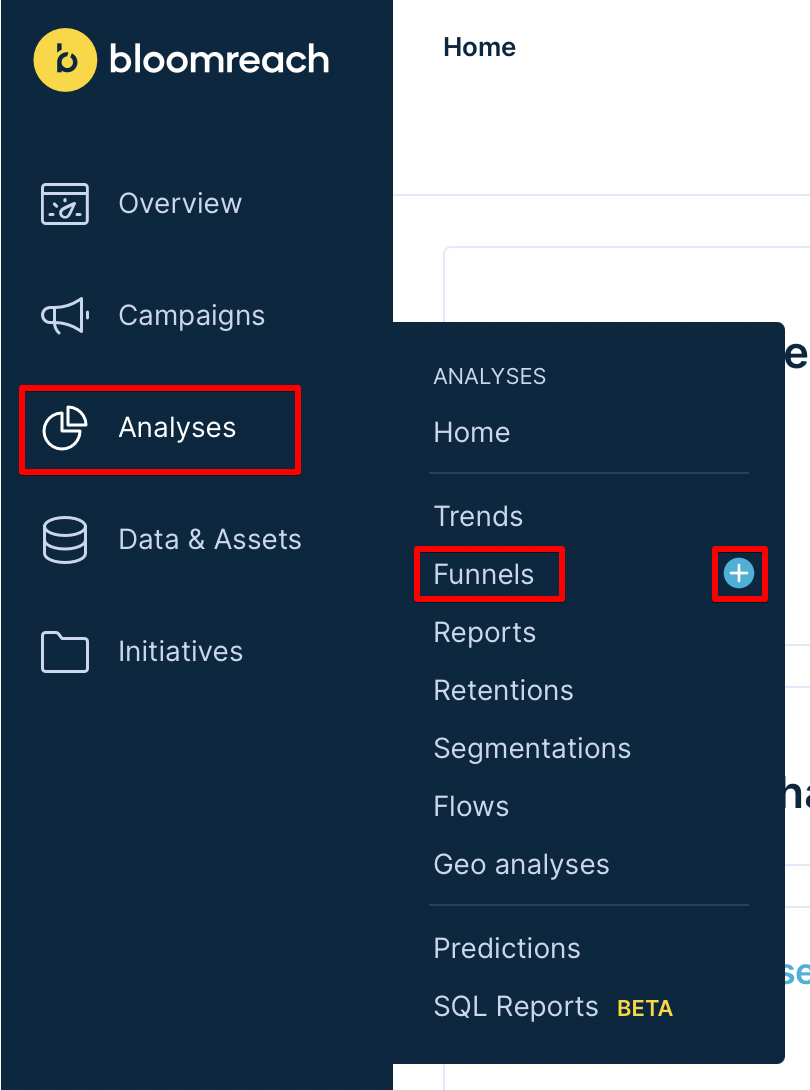
Creating a new funnel analysis from the Analyses menu.
- Choose to build a new funnel from scratch or start from one of the pre-made templates.
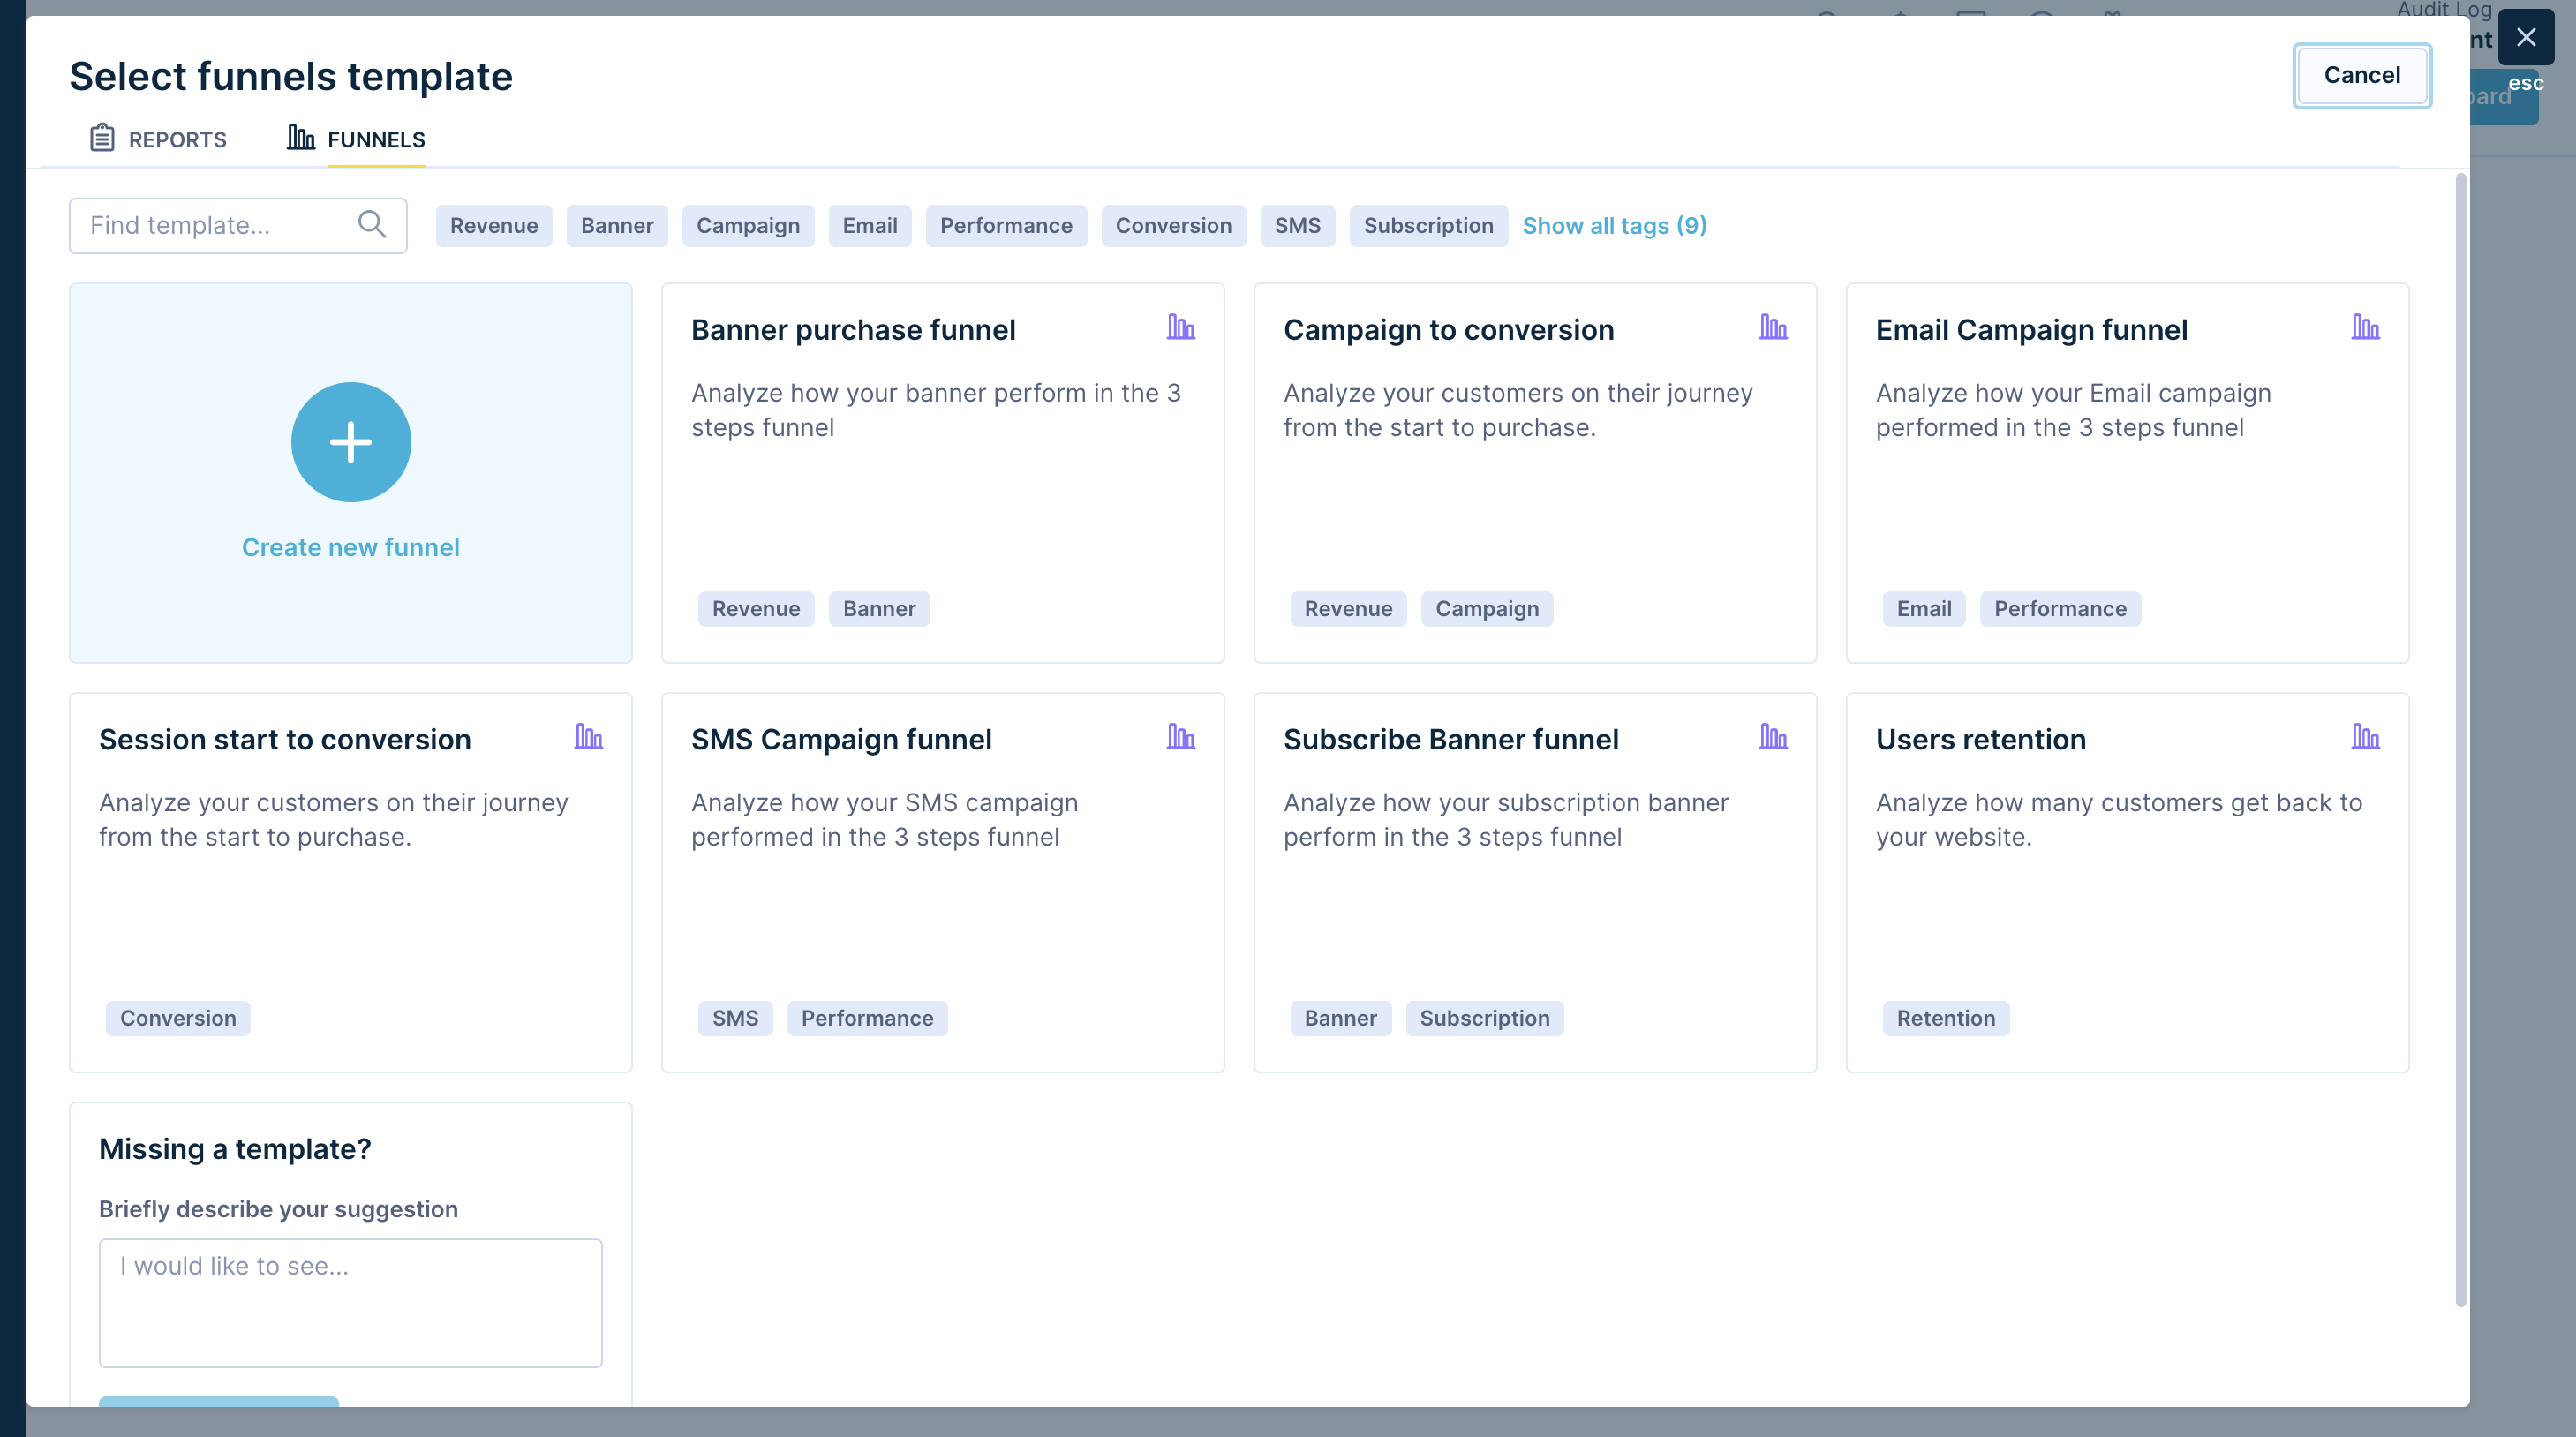
Choosing between a blank funnel and a pre-made template.
Add steps to your funnel
- Select the event for the first step. The event picker only shows events you're currently tracking.
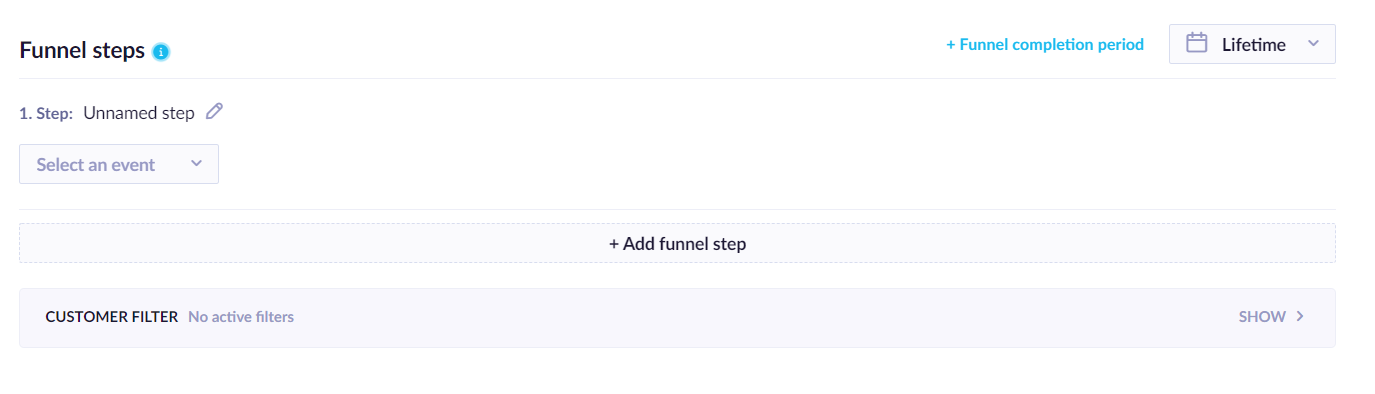
Adding steps to a funnel in the funnel builder.
- Add a new step for each consecutive event in the sequence.
- Select the appropriate event for each step.
- Click Preview in the top-right corner to see a provisional result.
- Scroll down to view the chart.
A few things to keep in mind:
- You can add an unlimited number of steps.
- Steps don't need to happen within a single session — funnels are calculated across the full time interval you specify.
- To be counted, a customer must complete the selected events within the time interval you've set.
Manage steps
Rename a step
Click the pencil icon in the step title to rename it.
Renaming a step using the pencil icon.
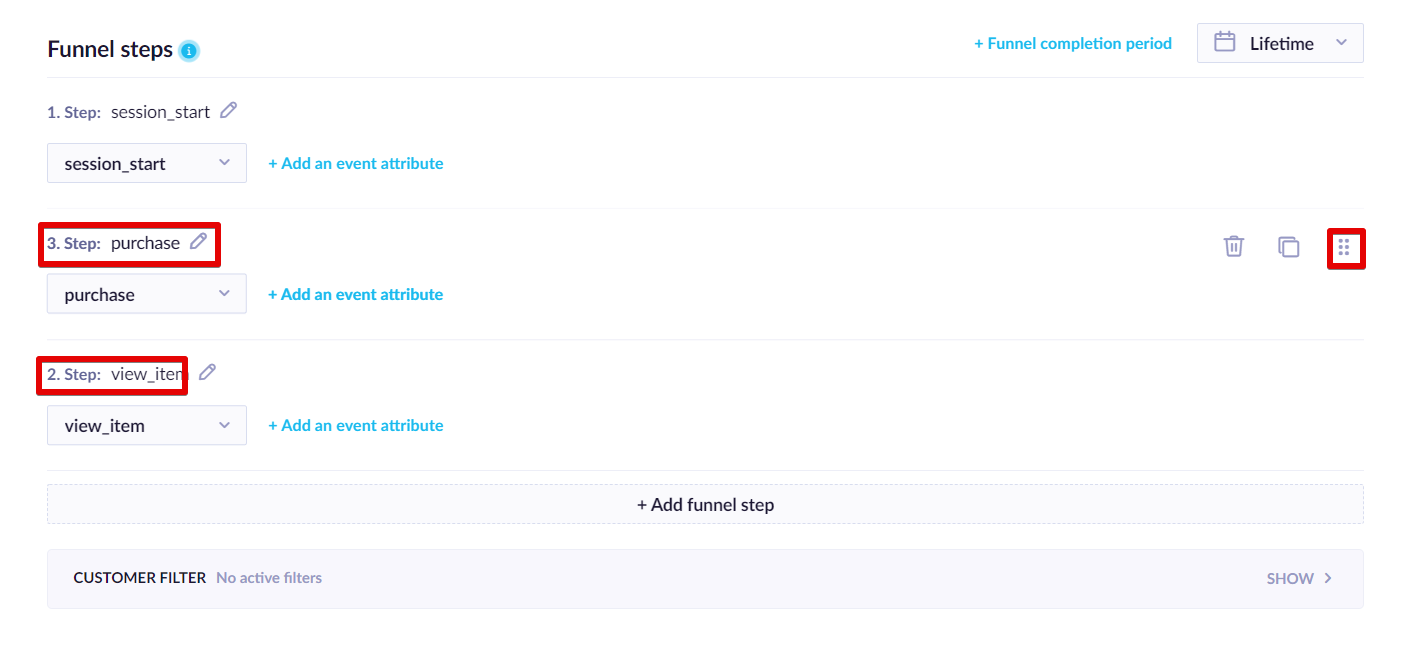
Rearrange steps
Drag a step using the six-dot icon to reorder it in the sequence.
Set a completion time limit
You can set a time limit within which a customer must complete all the funnel steps. This is useful for questions like "how many customers completed a purchase within 24 hours of their first session?"
- Click the clock icon to enable the time limit filter.
- Enter the duration and select the unit — for example, minutes, hours, or days.
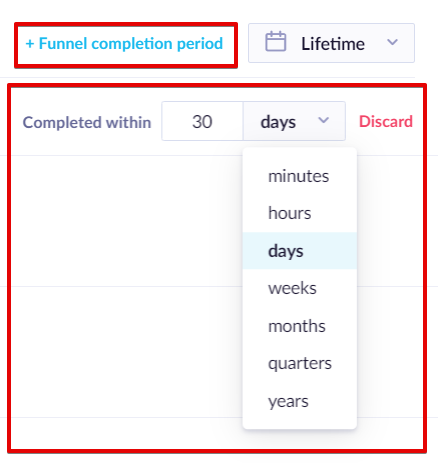
Enabling the time limit filter using the clock icon.
ImportantUsing the time limit filter together with drill-downs can produce imprecise results. When both are active, the system scans only the first set of events for each customer—which means a completed funnel that happened later in the time window may not be counted.
Read the funnel chart and table
A funnel analysis has 2 components: a chart and a table.
The chart shows conversion rates between individual steps and the number of customers who completed each one. Hover over any bar to see additional details — for example, the average time it took customers to move from one step to the next, or the total conversion rate from the first step.
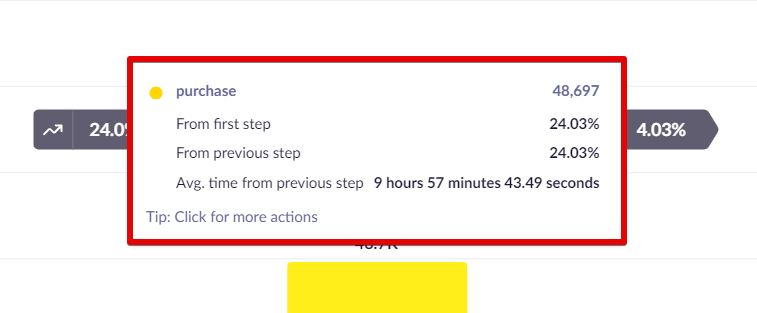
Hover over a funnel step to reveal conversion details and average time between steps.
The table presents the same data in a more compact, structured format. It's particularly useful when you're using advanced features like drill-downs.
Use the chart context menu
Click on any step column in the chart to open a context menu with the following options.
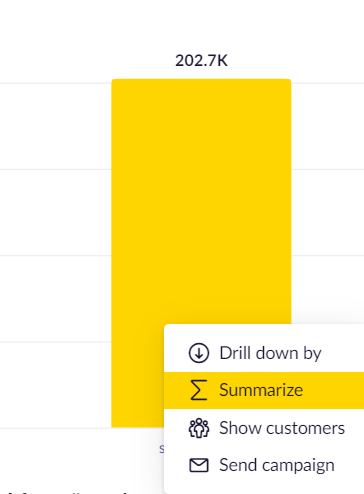
The funnel chart context menu showing available actions for a selected step.
Show customers
Displays all customers who completed every step up to and including the step you clicked. You're redirected to the Customers section, where the funnel is applied as a filter. From there, you can view individual profiles, export the list, and more.
Drill down
Breaks down the funnel by customer or event attributes so you can compare conversion rates across segments.
Drill down by customer attributes
- Scroll down to the Funnel details table.
- Select Customer from the Drill-down by dropdown.
- Select an attribute — for example, Gender or Country.
Drill down by event attributes
- Scroll down to the Funnel details table.
- Select Customer from the Drill-down by dropdown.
- Select a step from the Select step dropdown.
- Select an attribute from the Attributes dropdown.
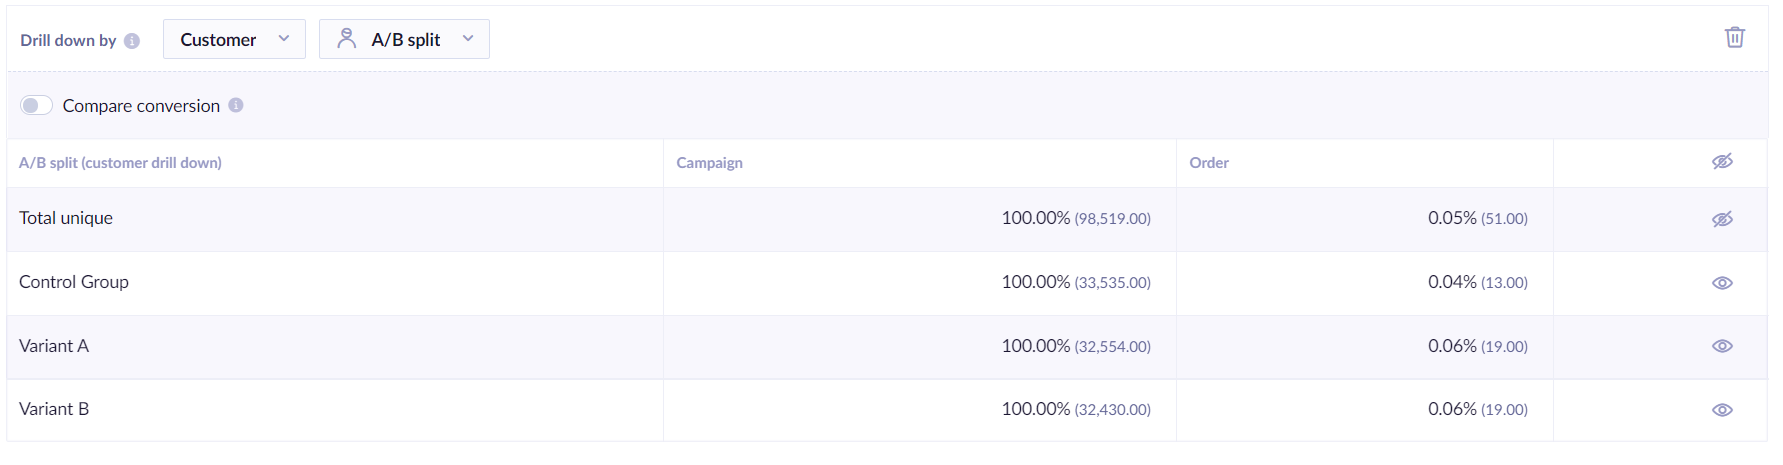
Compare conversions
Compares conversion rates between funnel variants using statistical testing to identify the stronger-performing variant. This is useful for evaluating A/B tests from campaigns or weblayers. Select the original step and a goal — the tool shows the conversion rate from start to goal and a confidence score for each variant.
How confidence is calculated
The comparison uses a right-tailed Chi-Square test, a non-parametric statistical test. Because it doesn't assume that the underlying data follows a normal distribution, it's well suited for analyzing categorical data such as conversion counts.
The confidence score reflects how likely it is that a variant's conversion rate is better than the rest of the traffic. Variants are labeled based on the following thresholds:
- Strong winner — confidence of 99.9% or higher.
- Weak winner — confidence of 90% or higher.
No label is shown when confidence falls below 90%.
How multiple variants are evaluated
When more than two variants are present, each variant is tested against the combined remaining traffic — not against a single control group. This means confidence scores reflect how each variant performs relative to the overall pool, not relative to any one other variant.
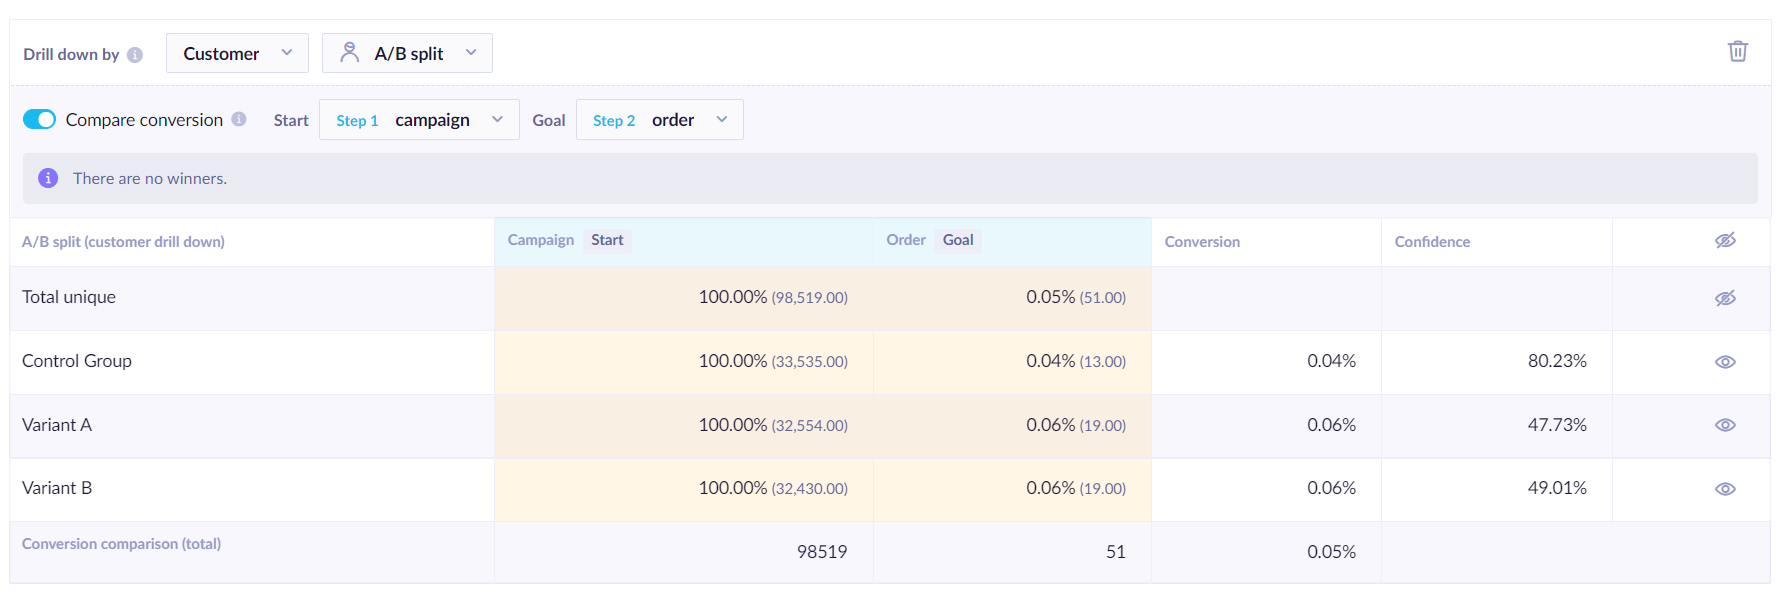
Comparing funnel conversions with statistical confidence using the Chi-Square test.
Summarize event attributes
Shows a summed value of a selected event attribute for a given step. The funnel counts only one event per customer. Click the desired column in the chart to add a summary column marked with a ∑ symbol, showing the total of all values for the selected attribute.
A funnel summary column showing the total of a selected event attribute.
Launch a campaign from a funnel
You can target customers at a specific funnel step—or a drill-down segment—by launching a campaign directly from the chart. Click the step or drill-down flow, then select the campaign option. A new scenario opens with a condition automatically set to match the customers from that step.
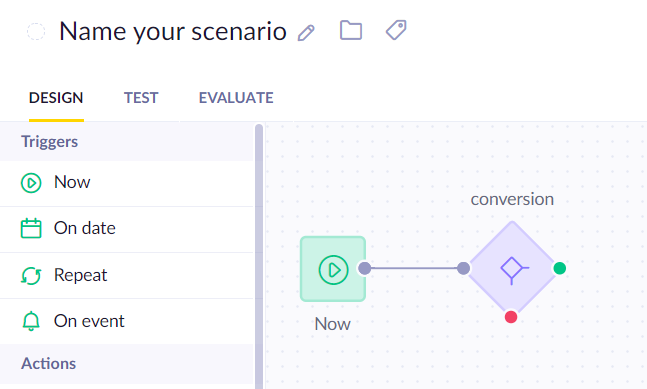
A new scenario created from a funnel step with a pre-populated condition.
For more details on building scenarios, see the Scenarios guide.
Analyze conversion trends
The funnel conversion trend shows how a specific conversion rate has changed over time. Use it to understand how changes you've made to your website or customer journey have affected performance at a particular step.
The trend chart appears below the main funnel analysis and shows the conversion history between the first and last step of the funnel.
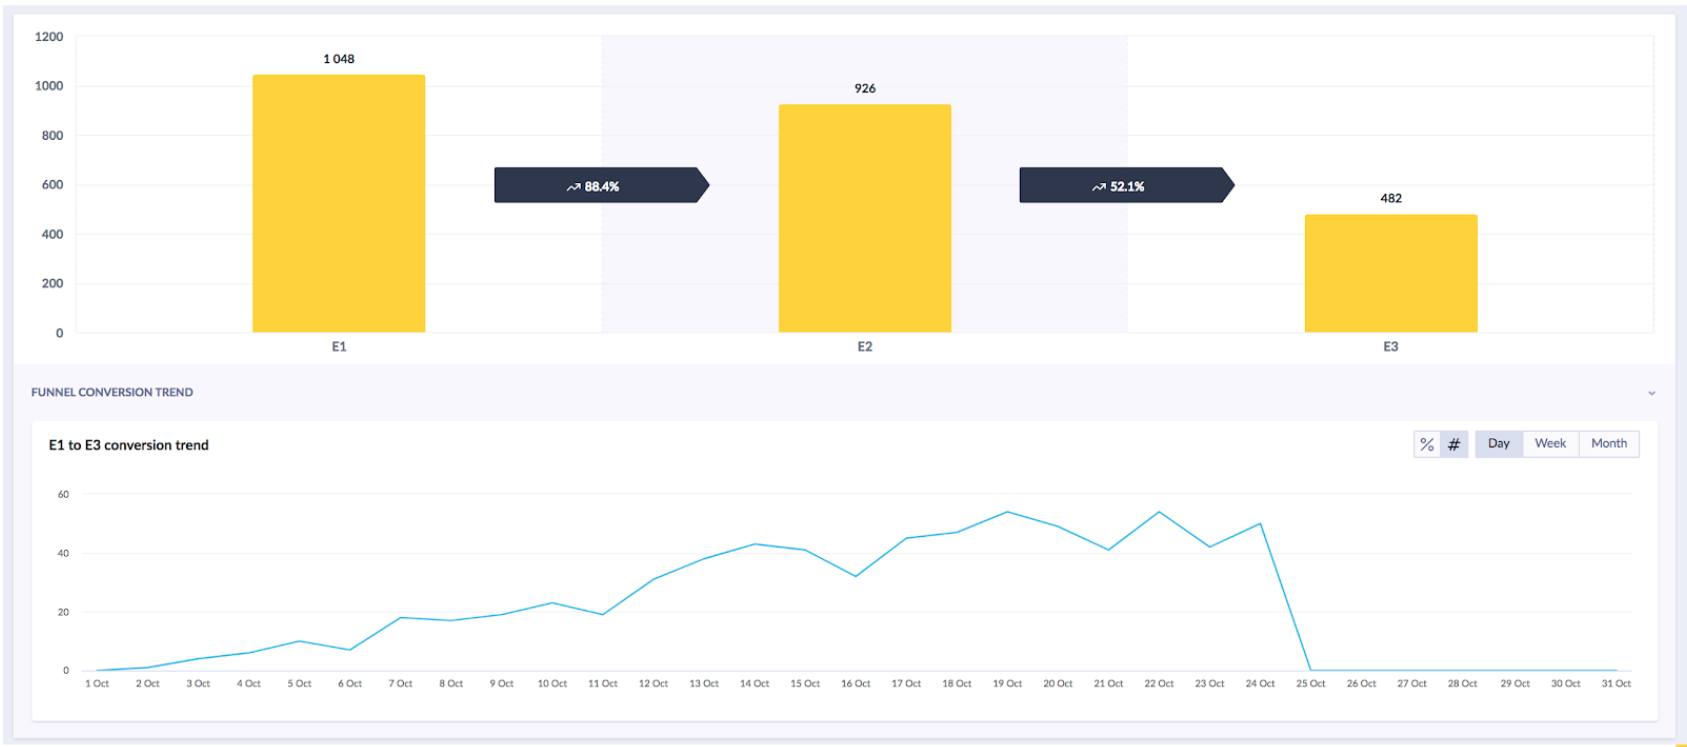
A funnel analysis with overall conversion rates and a conversion trend chart below.
What a funnel conversion trend measures
The trend always counts uniquely converted customers per day — not the total number of events. If a customer completes the last step multiple times in one day, it counts as a single conversion for that day.
Chart display settings
The trend chart can display either the number of customers or the percentage of customers who completed the funnel. Percentages are calculated against the total number of customers present in the funnel at that time.
Updated 12 days ago