

Interpret prediction results
Before using a prediction model in a campaign, check that it's performing well. This article explains the quality metrics available in the Results tab, how to interpret the decision tree to understand what drives your model, and how prediction values are calculated and updated over time.
Model quality evaluation
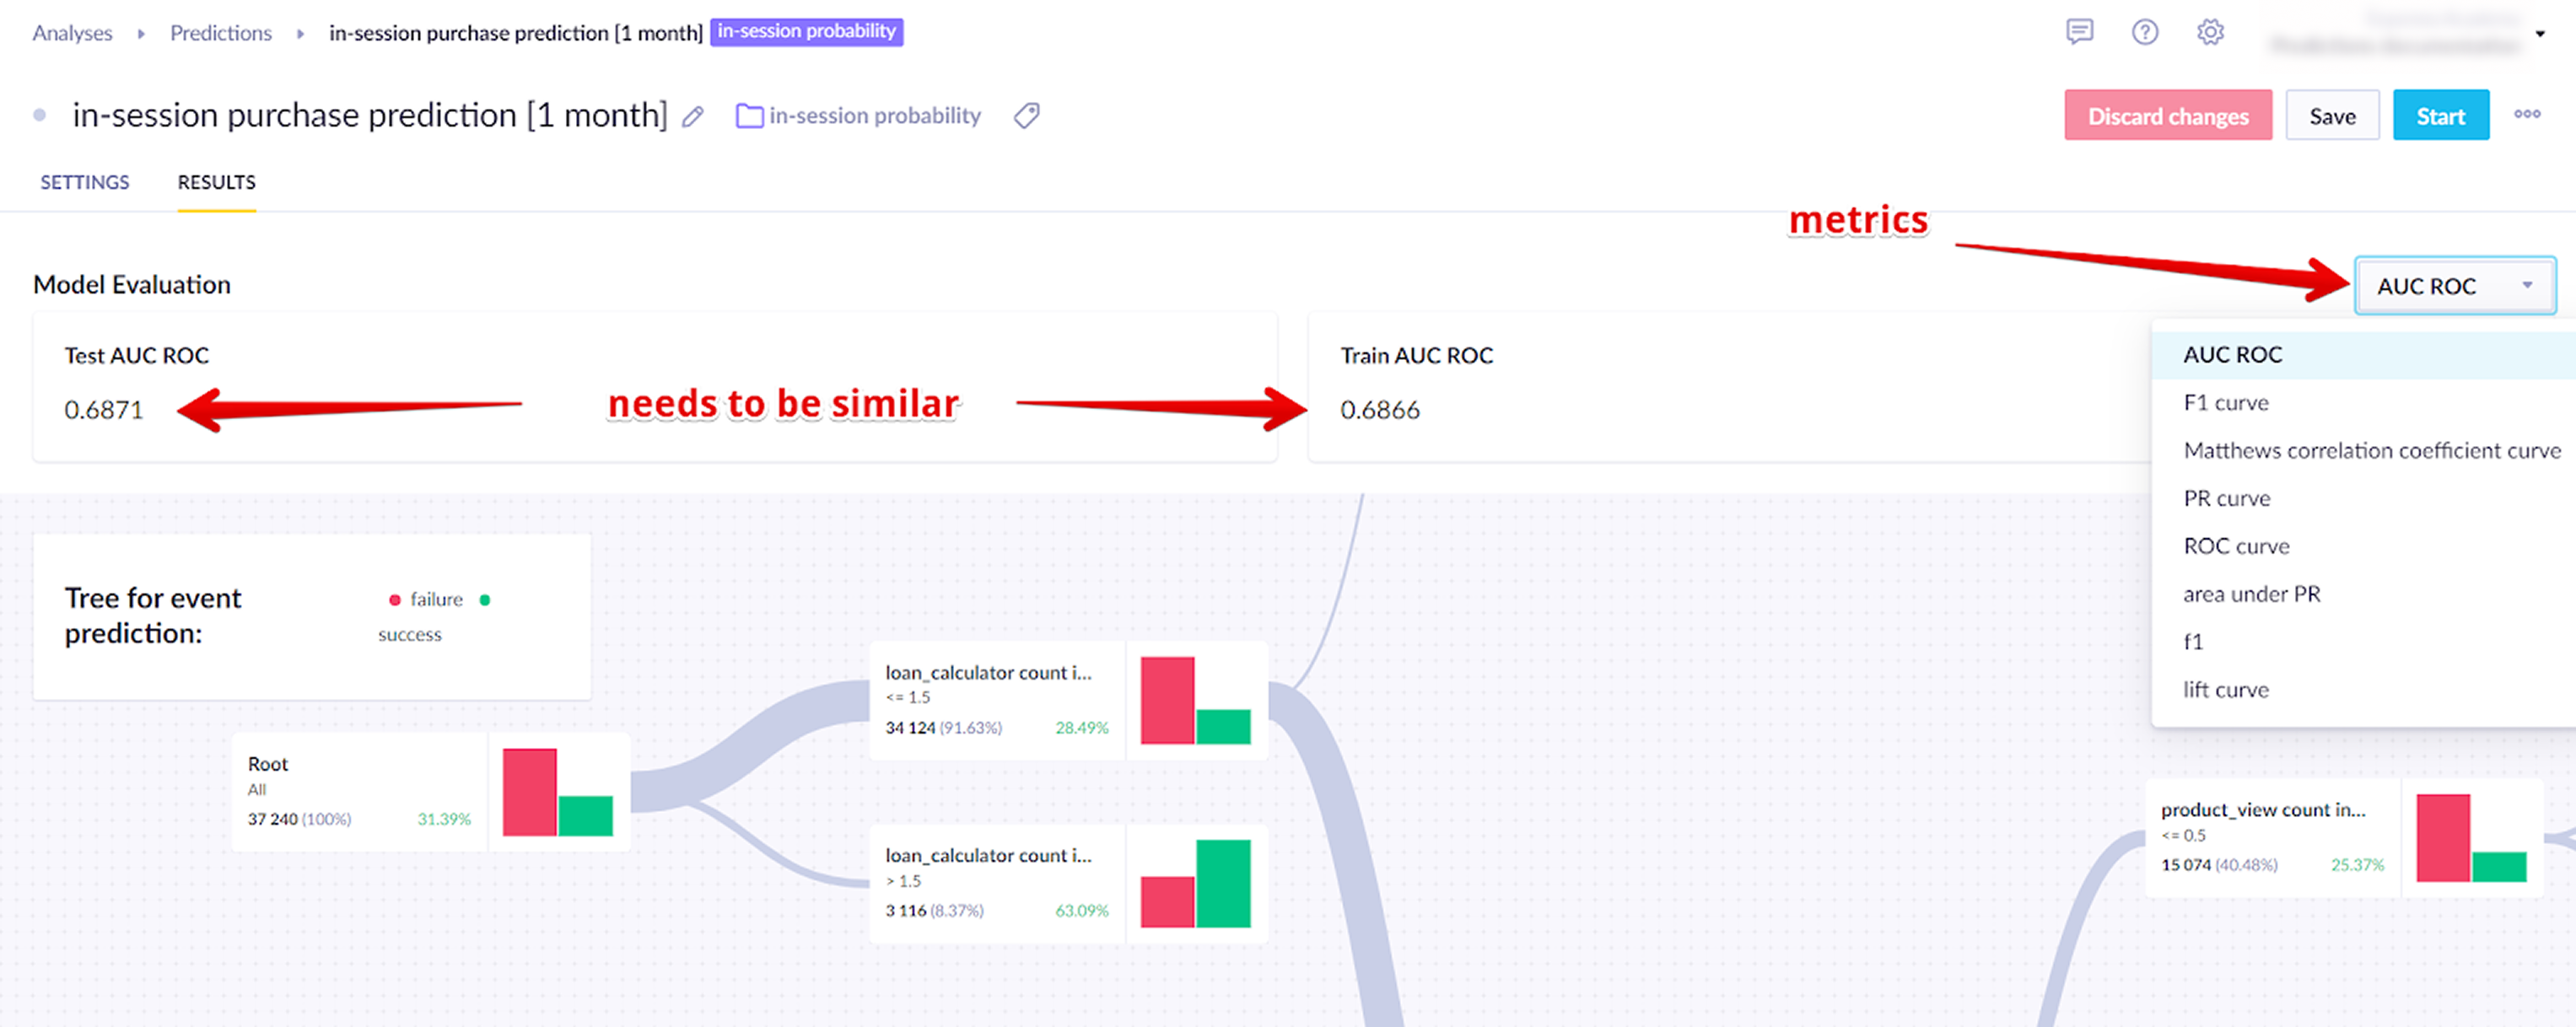
Go to the Results tab to check the machine learning metrics for your model.
| Learning metric | Description |
|---|---|
| Area under the curve (AUC) | AUC measures how well the model distinguishes between customers who will reach the target and those who won't. It ranges from 0 to 1 — a perfect model scores 1, and a model with no predictive power scores 0.5 for binary classification. For multiclass classification it scores 1/k, where k is the number of distinct classes. |
| F1 | The F1 score is the harmonic mean of precision and recall. It's useful for imbalanced classification, which is typical in prediction use cases. The range is 0 to 1 — 1 is perfect classification and 0.5 is random. |
| Matthews correlation coefficient (MCC) | MCC measures the quality of a binary classification by accounting for all four outcomes — true positives, true negatives, false positives, and false negatives. It ranges from -1 to 1, where 1 is a perfect prediction, 0 is no better than random, and -1 is a completely wrong prediction. |
| Mean squared error (MSE) | MSE is the squared difference between the predicted value and the actual (ground truth) value. It's used for regression predictions. Lower values indicate better performance — there's no fixed range, so compare against a baseline or previous model runs. |
Use AUC for binomial classification, F1 for multinomial classification, and MSE for regression. MCC is an alternative to AUC for binary classification when class distribution is imbalanced.
Testing dataset
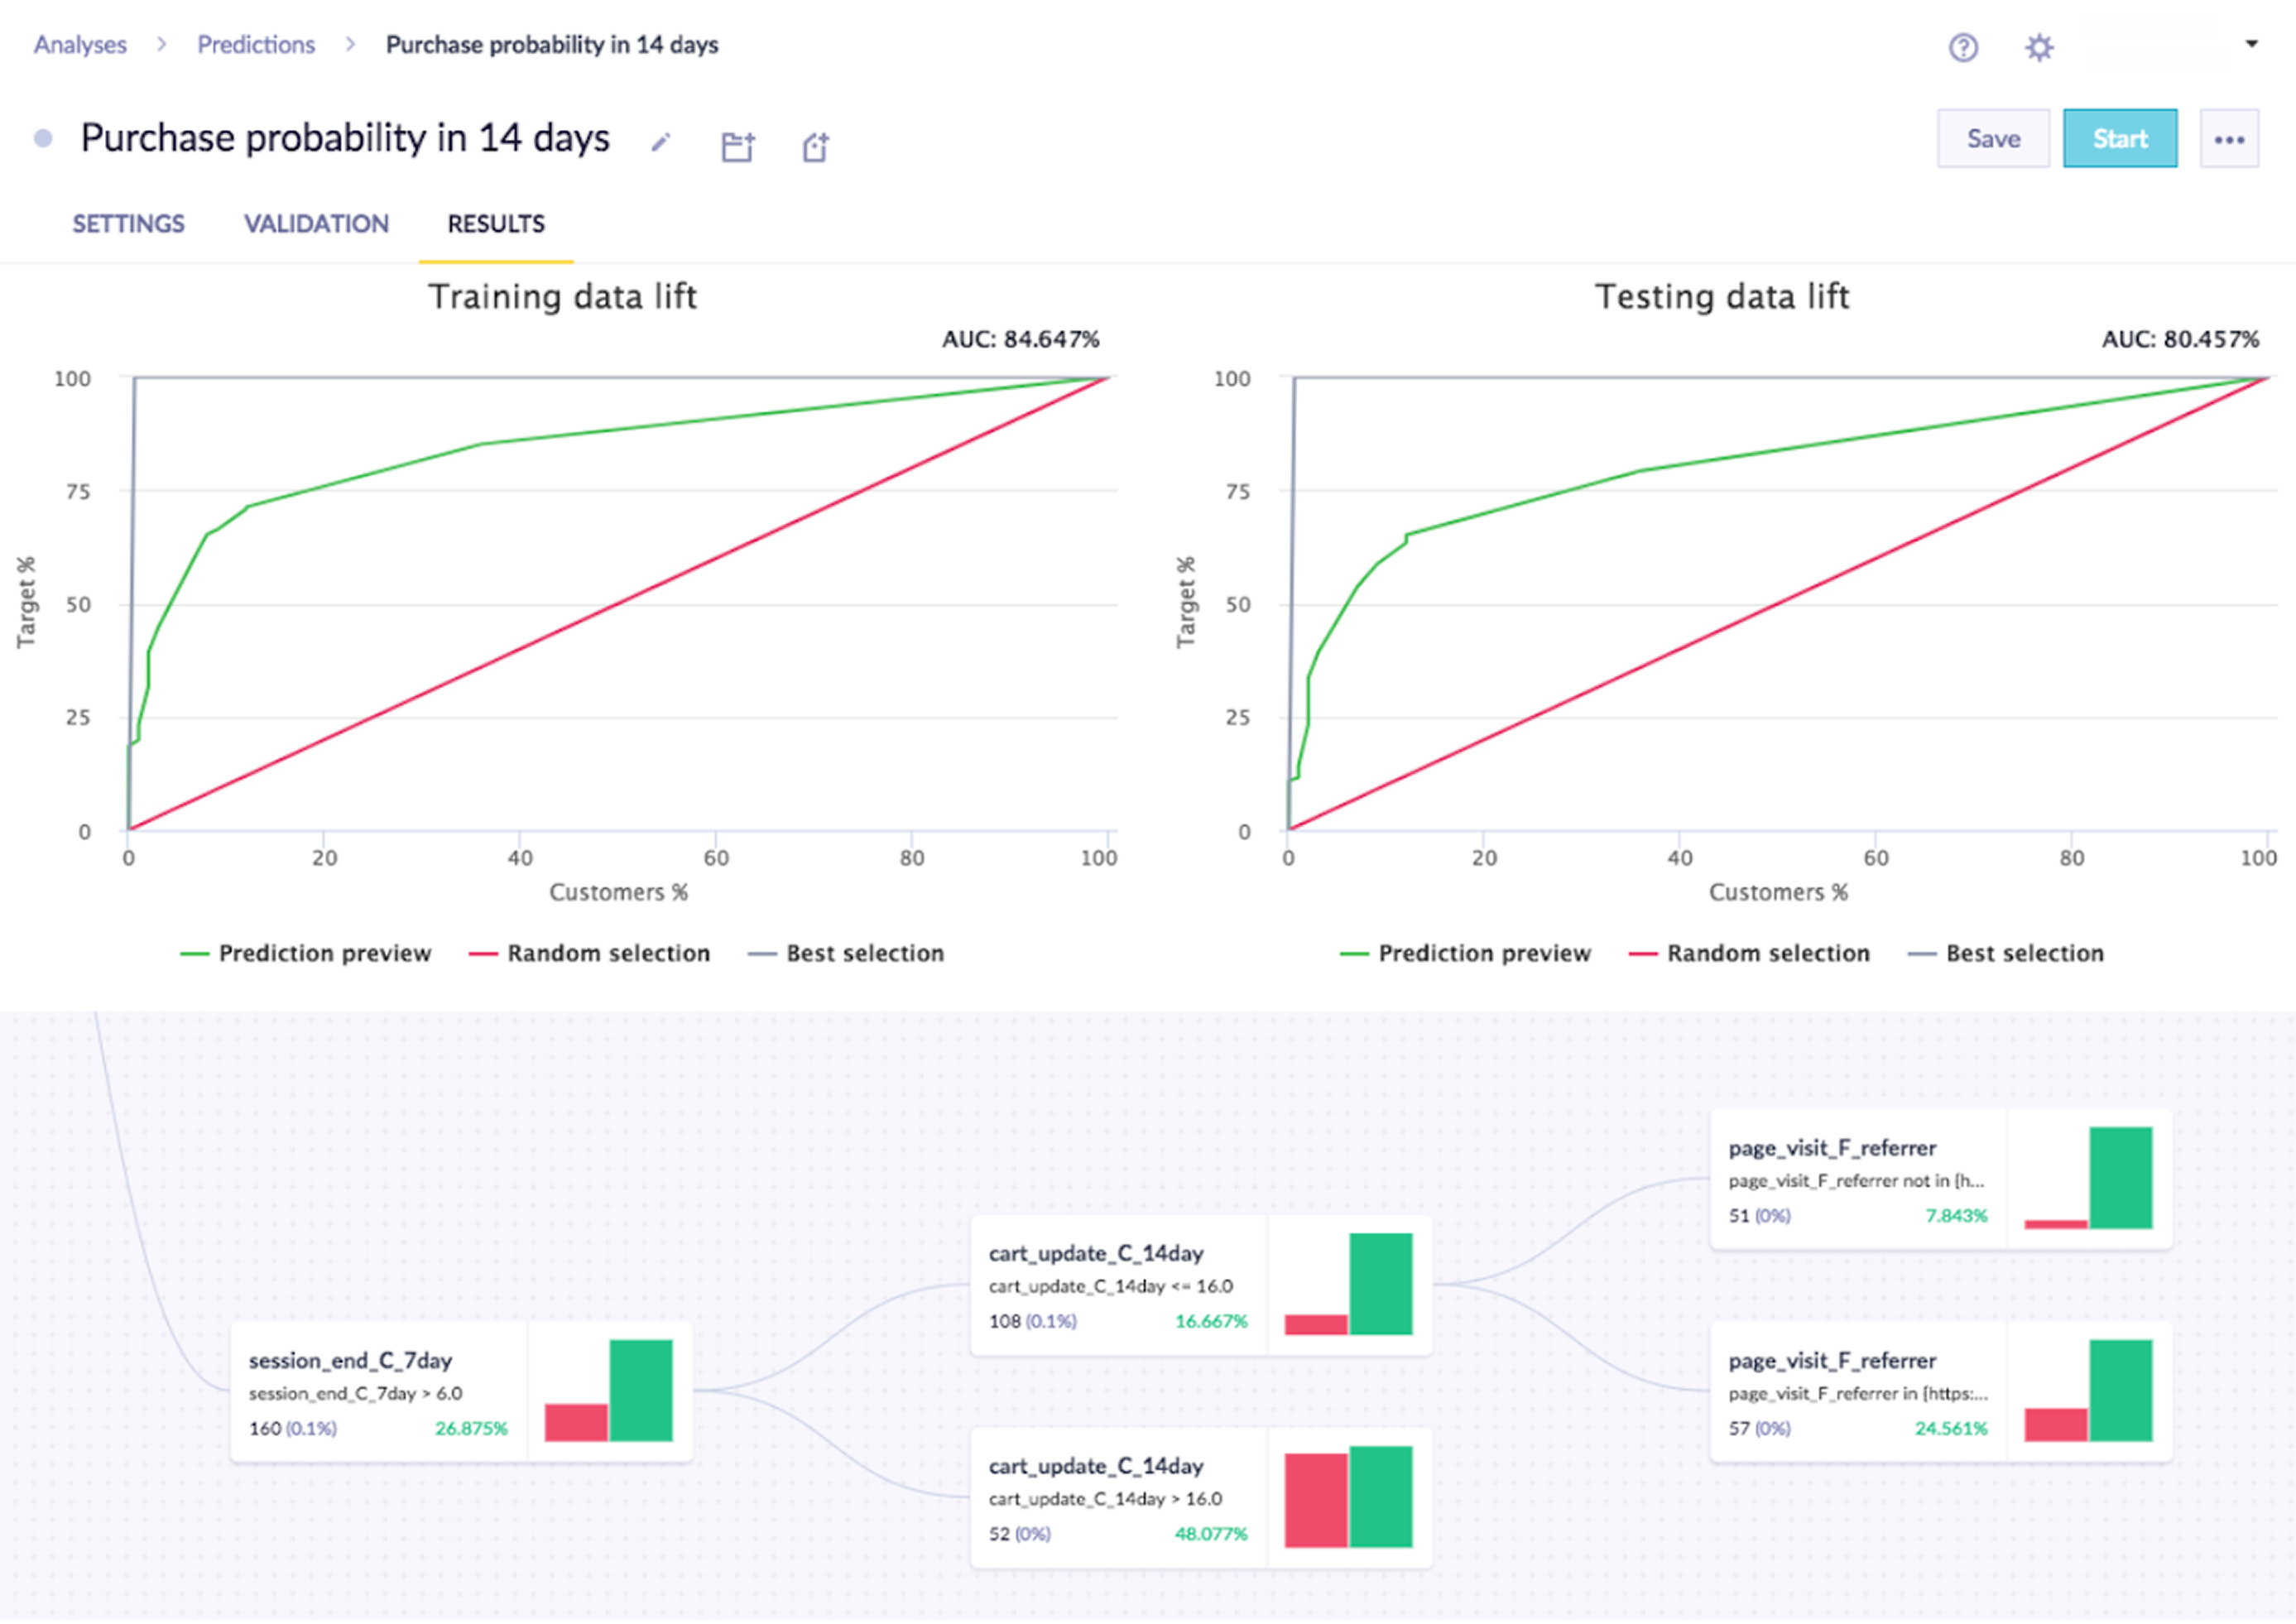
Models are trained on historical data and then tested on a separate, more recent dataset that wasn't used in training. This intentional split lets you verify accuracy against data the model has never seen.
The scores on both datasets should be close. A gap above 10% usually means the model is overfitting — learning the training data too specifically rather than identifying general patterns. If this happens, try broadening the training window, reducing the number of features, or adjusting the algorithm settings.
The accuracy required depends on the context. A model predicting which customers will churn from a paid subscription needs higher accuracy than one predicting whether a customer will click a promotional banner.
Read the prediction tree
Read a prediction node
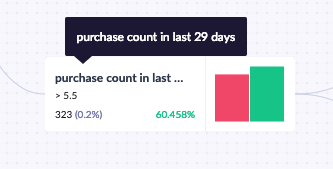
Each decision node shows the rule it applies in the top-left corner. In the example below, the rule includes only customers who purchased at least 6 items in the last 29 days. Below the rule, you can see how many customers match (323, or 0.2% of all tracked customers) and what percentage of those customers achieved the goal (60.5%).
Read a prediction tree
Predictions return a decision tree — a set of rules that filters customers based on their behavior and calculates the probability that each group will reach the target goal.
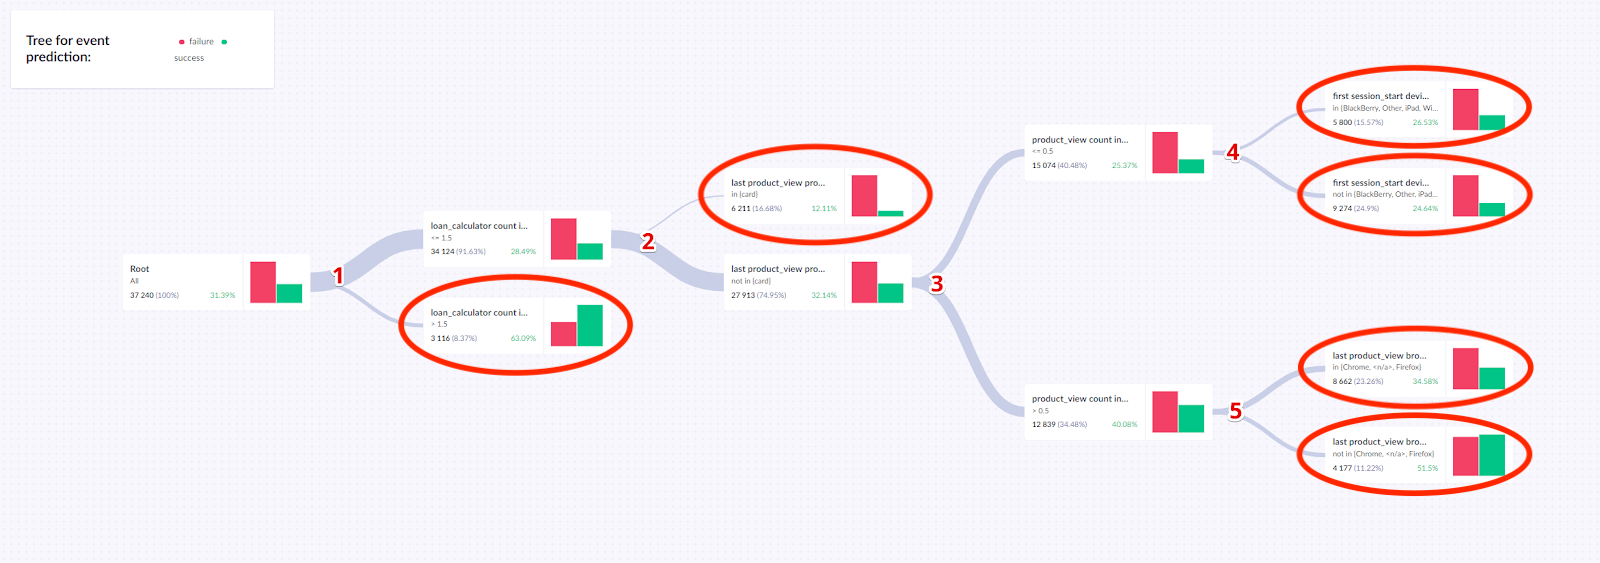
The example below shows a decision tree for an event prediction model. It has 5 splits:
loan_calculator: If > 1.5, the probability of success is 63.09%. Otherwise, 28.49%, and the customer continues to split 2.- Last
product_view: If in (card), the probability is 12.11%. Otherwise, 32.14%, and the customer continues to split 3. product_viewcount: Based onproduct_viewcount, the customer continues to split 4 or 5.first_session_startdevice: Ff the device is in the listed group, the probability is 26.53%. Otherwise, 24.64%.- Last
product_viewbrowser — if the browser is in the listed group, the probability is 34.58%. Otherwise 51.5%.
The tree has 6 terminal nodes. These form the basis for the final probability assigned to each customer based on their journey through the tree.
Create vs. serve a model
Understanding the difference between creating and serving a model explains how prediction values get updated.
How a model is created
Creating a model builds a decision tree from historical data. The model isn't rebuilt automatically — if you don't manually retrain it, the same model continues to be used even as time passes.
How model serves predictions
Serving a model retrieves a predicted value for a specific customer. This value is always calculated using the customer's most current profile data, even if the underlying model is older. Each time the system needs a value — whether in a customer profile or a campaign — it runs that customer's latest data through the existing model.
Model creation uses all data tracked regardless of expiration settings. Serving a model only uses data visible in the app, so data expiration settings affect served values.
Related articles
Evaluate predictions: Use a four-group testing structure to measure the separate contributions of your model and your campaign incentive.
Updated 2 months ago