How to Generate a HAR File
Usually Bloomreach Support asks customers for the HAR (HTTP archive) file to closely investigate the issue reported. You can follow the below steps depending on the choice of the browser.
Google Chrome
- Open the web page where the issue occurred.
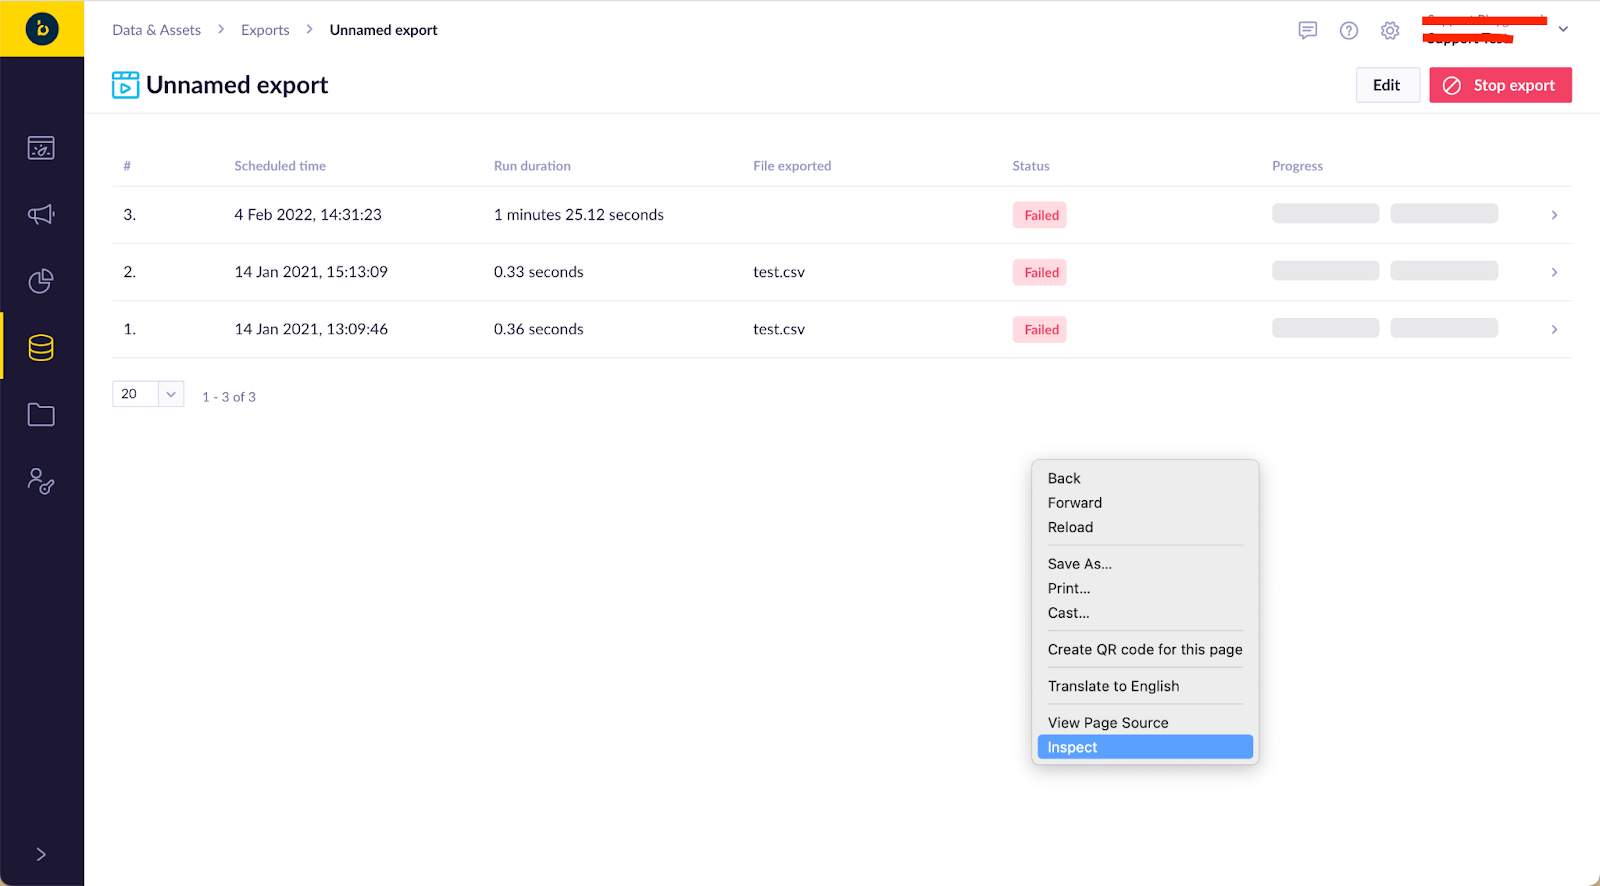
- Right-click on the page and select Inspect Element/Inspect. This opens Developer tools . (Shortcut for Windows: CTRL + Shift + i, and for Mac:CMD + opt + i ).
- Go to the Network tab.
- Keeping the Developer tools tab open, replicate the issue you are facing.
- You can see some files in the Developer tools tab. One of the files is highlighted in red. That is the error we are looking for.
- Download the file by clicking on the Export button and send it to our support team.
Mozilla Firefox
- Navigate to Open menu > Web developer > Network.
- Perform a request or reload the page to start capturing the traffic between browser and server.
- You can replicate the issue while leaving the tab open.
- Right click and choose Save all as HAR and send this file to the support team.
Microsoft Edge
- Open Developer tools by using the F12 keyboard shortcut (or CMD + opt + i for Mac).
- Refresh the page, so it starts capturing the traffic between the browser and the server.
- Replicate the issue while leaving the tab open.
- Click on the Export as HAR to save the HAR file and send this file to the support team.
Safari
- You have to display the Develop menu in the menu bar. In order to do this go to Safari > Preferences > Advanced. Check the box, so the Develop menu is displayed.
- Open the Develop menu on the menu bar.
- Choose Start Timeline Recording.
- Refresh the page and replicate the issue.
- Click the Save button, to download the HAR file, and send the file to the support team.
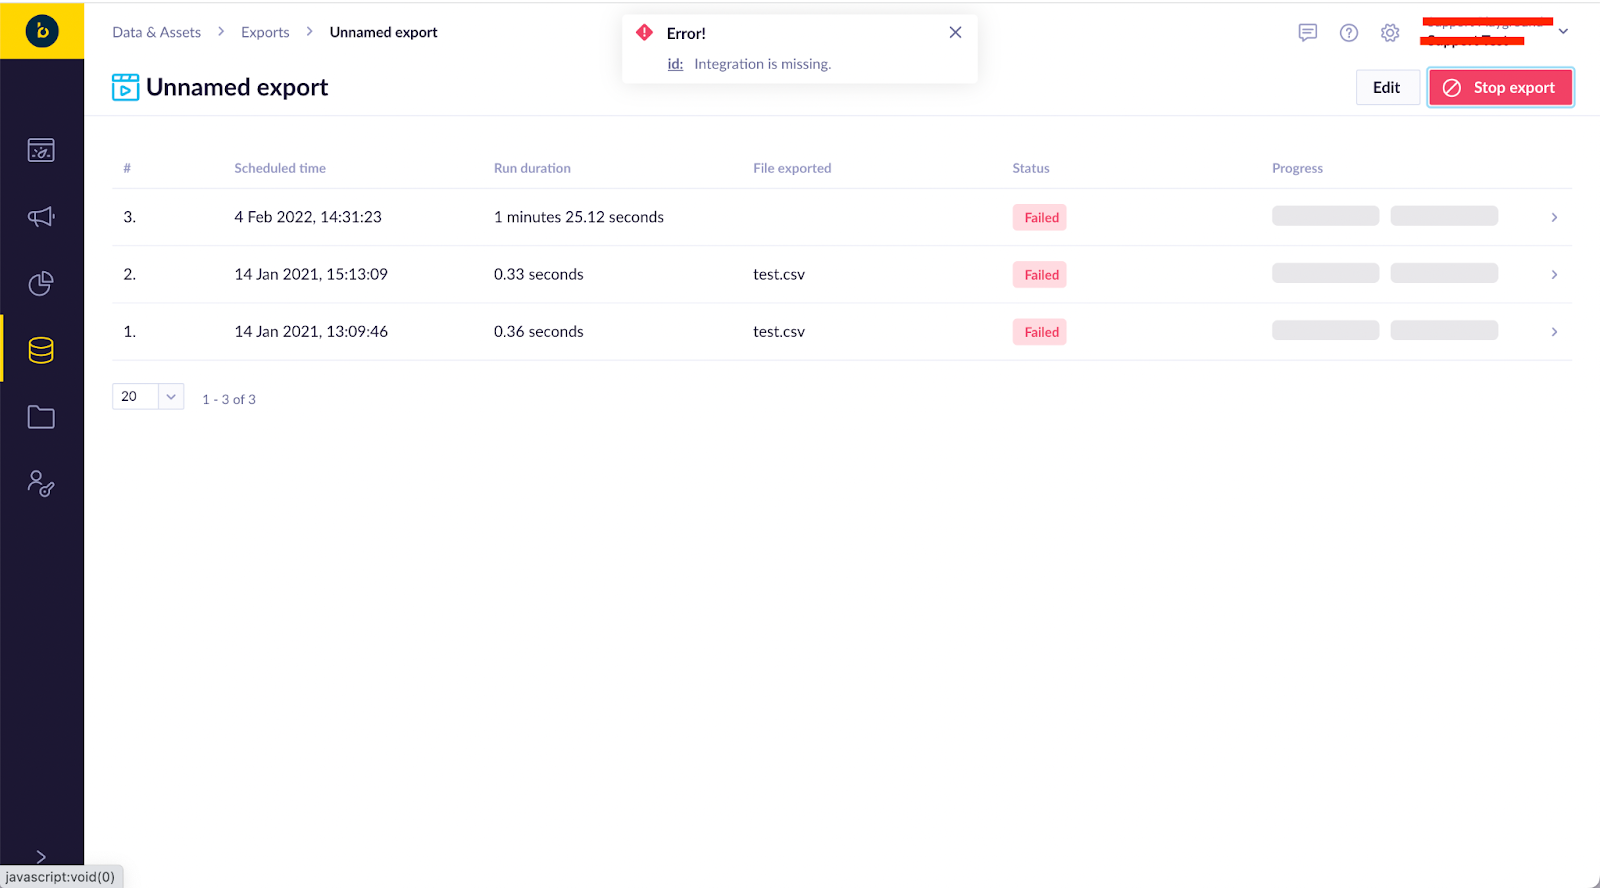
For example, you want to record the following error on this page, which occurs when the Stop Export button is clicked.
Open Developer Tools as mentioned in the steps above for Chrome using right click and the Inspect option.
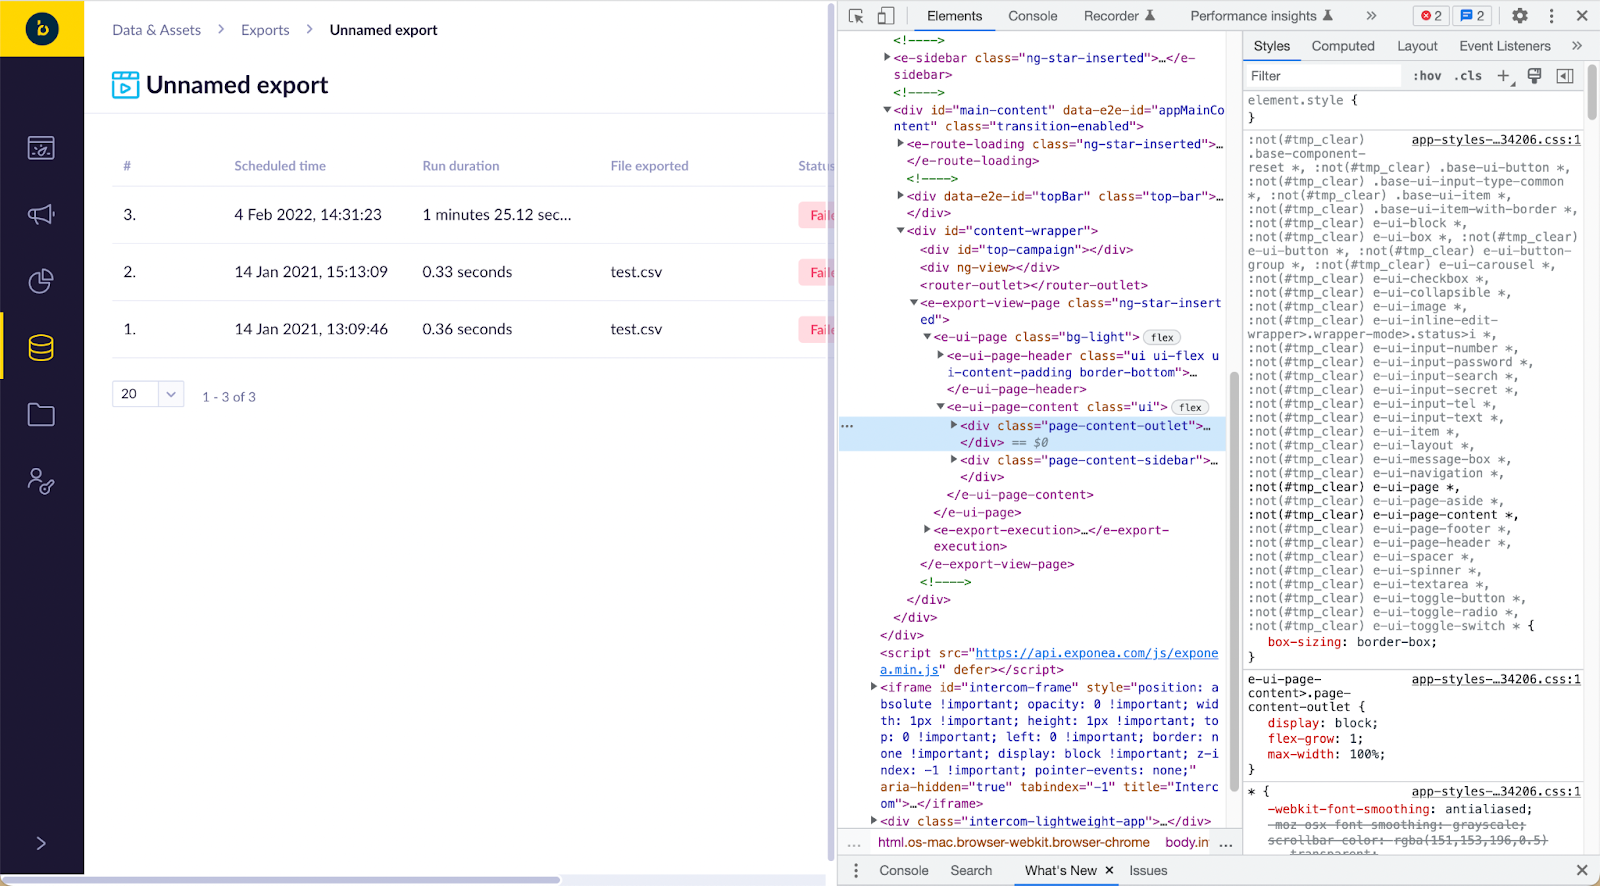
The Developer Tools panel is displayed on the right.
You can also pin it to other sides as well by clicking corresponding button you see in the 3 dots menu of the Developer Tools panel.
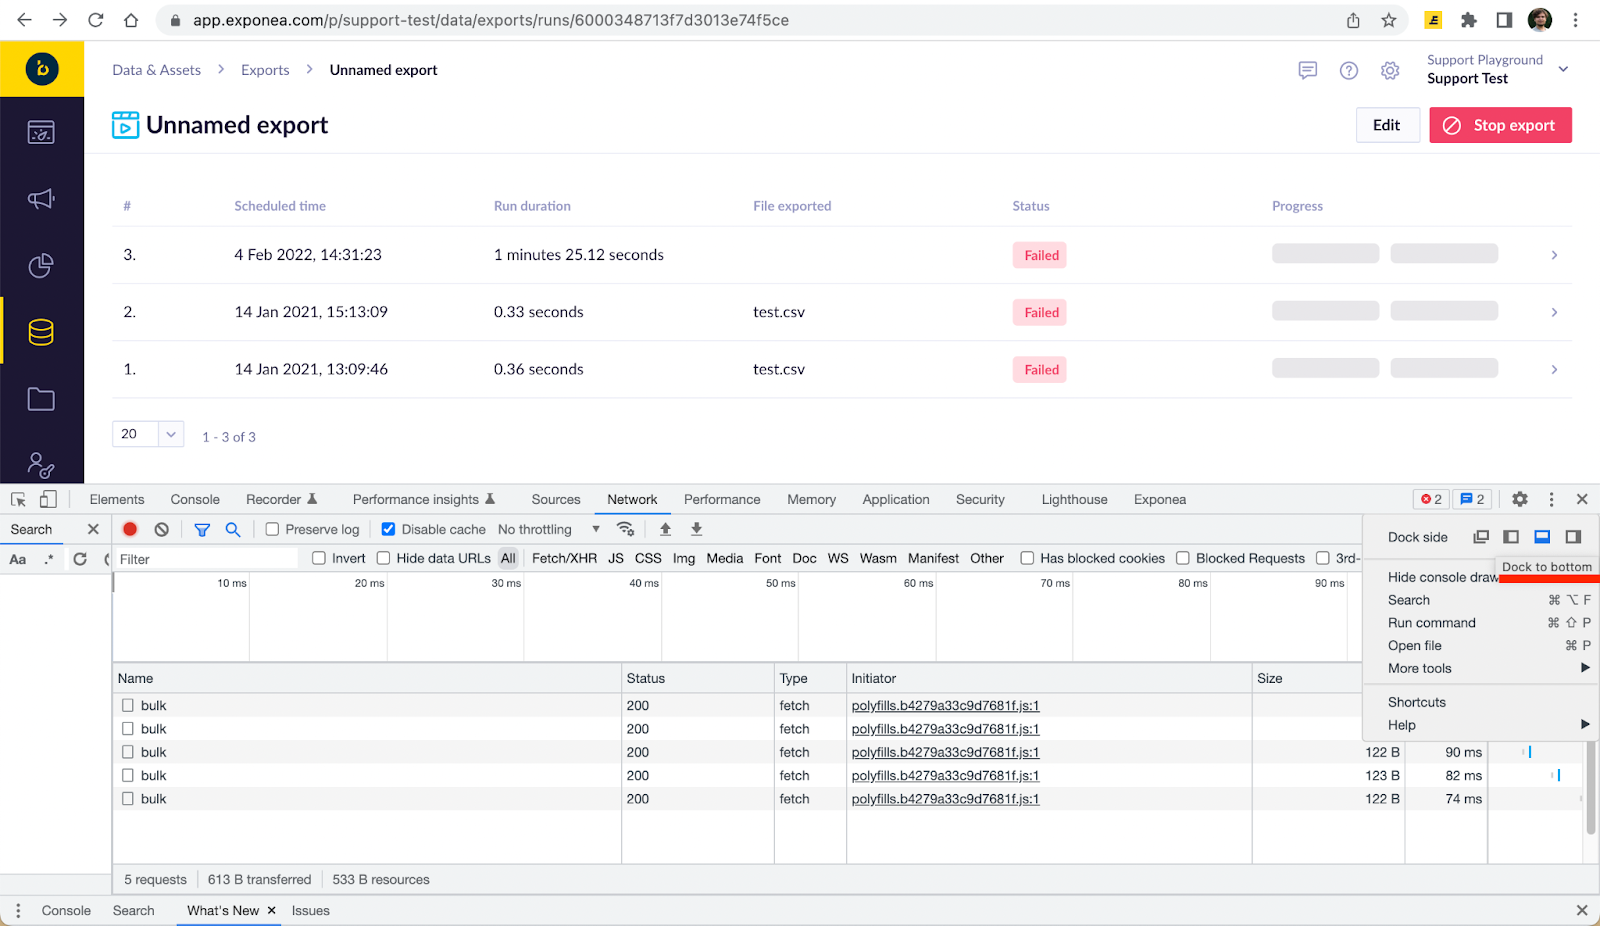
Switch to the Network tab of the Developer Tools panel.
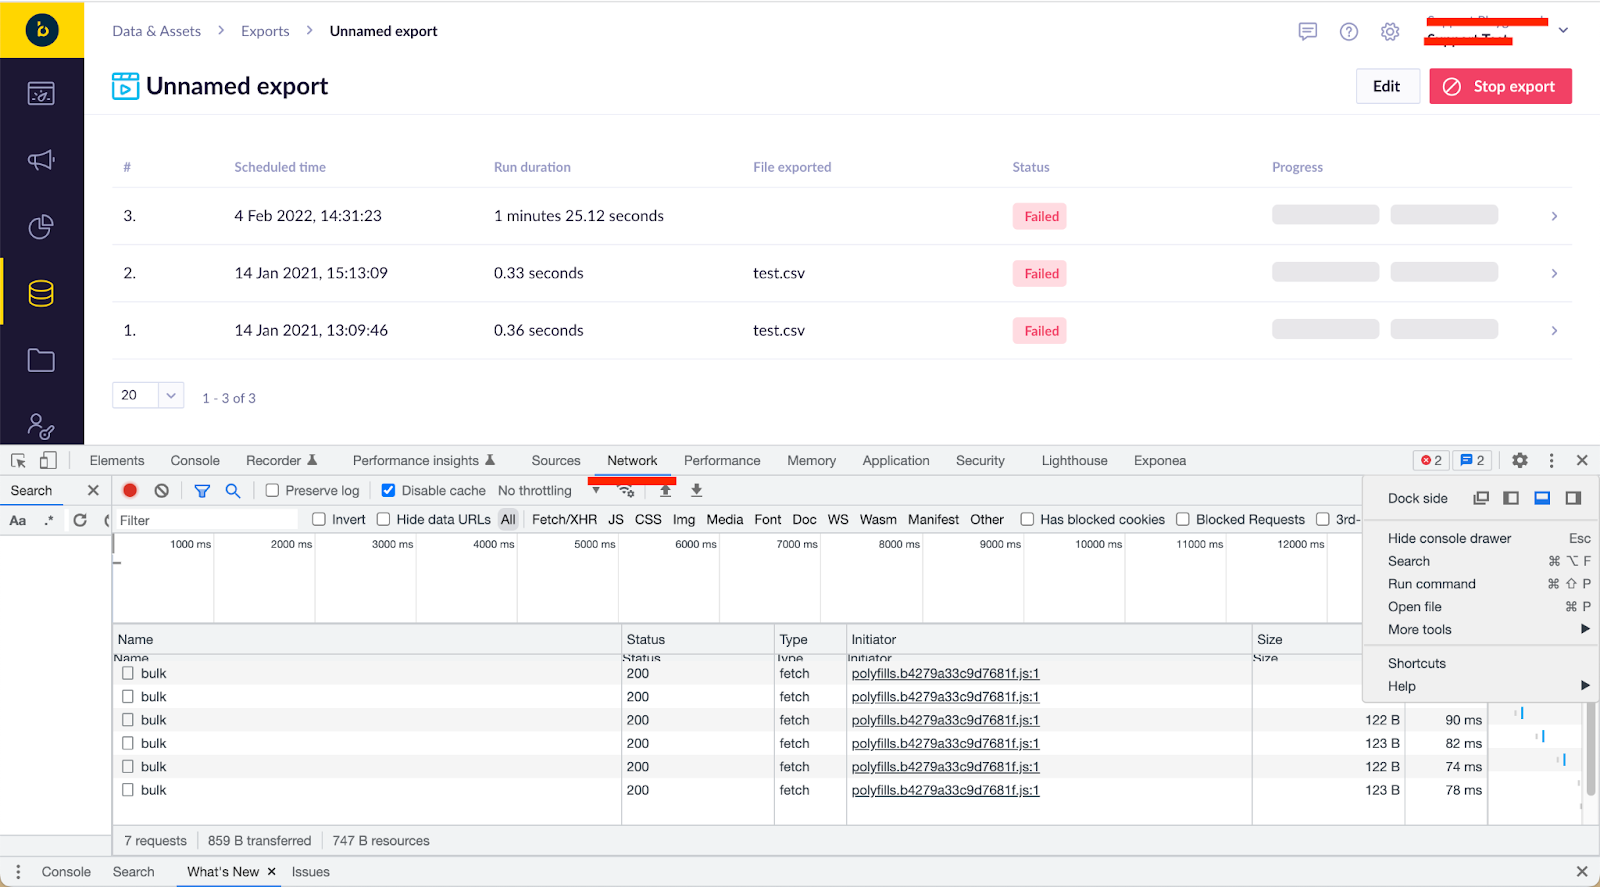
In the Network tab, you can see requests of the browser in the current session.
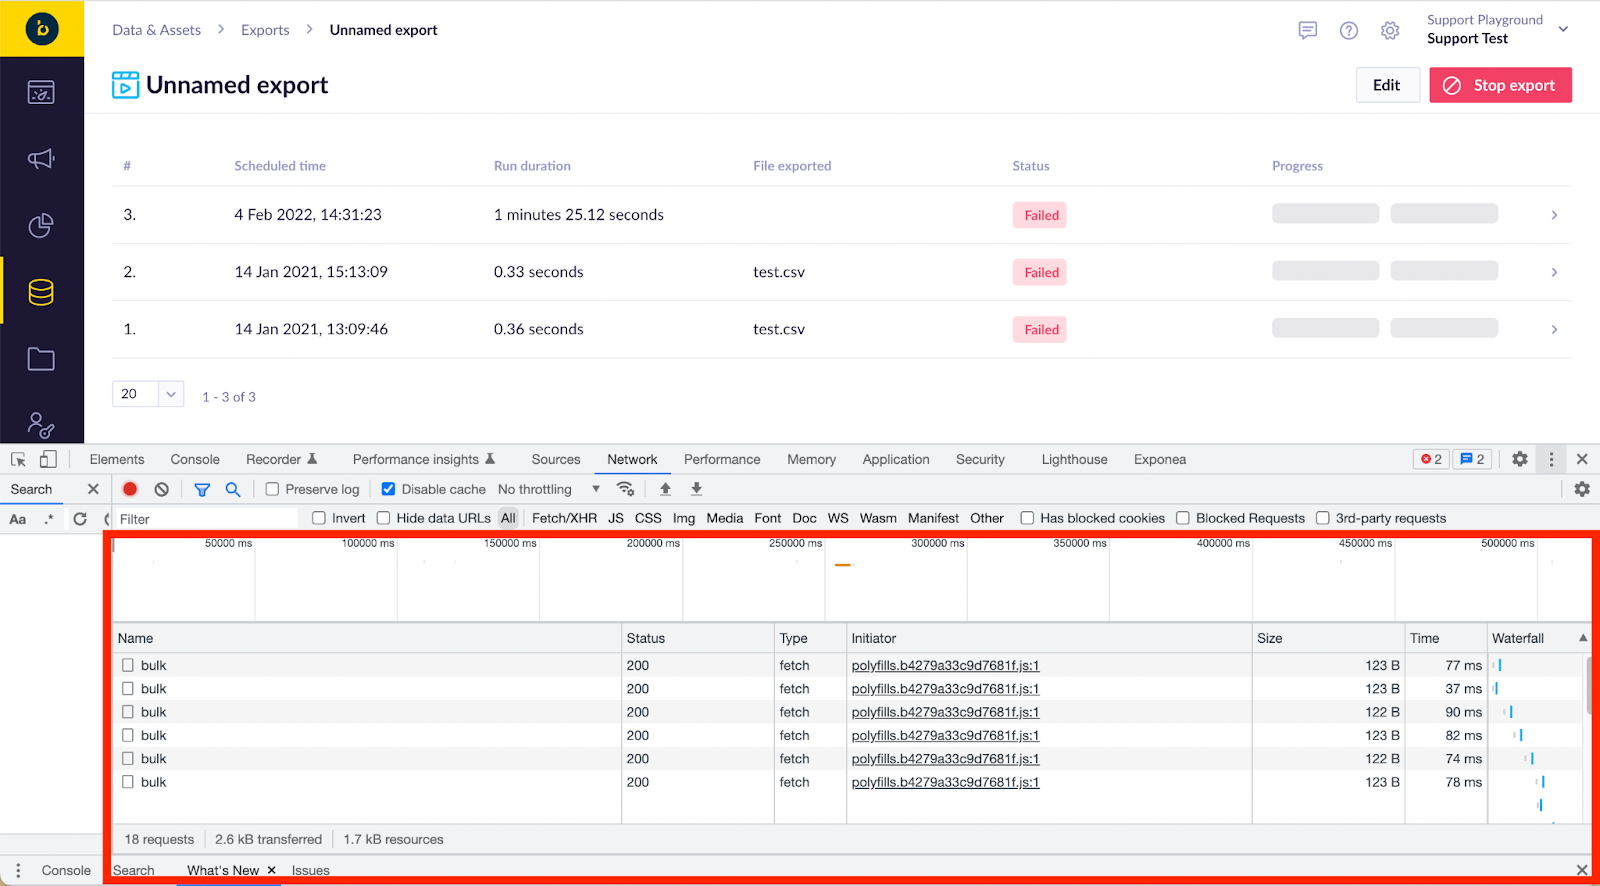
Click the button that generates the error, you can see an error request in session history.
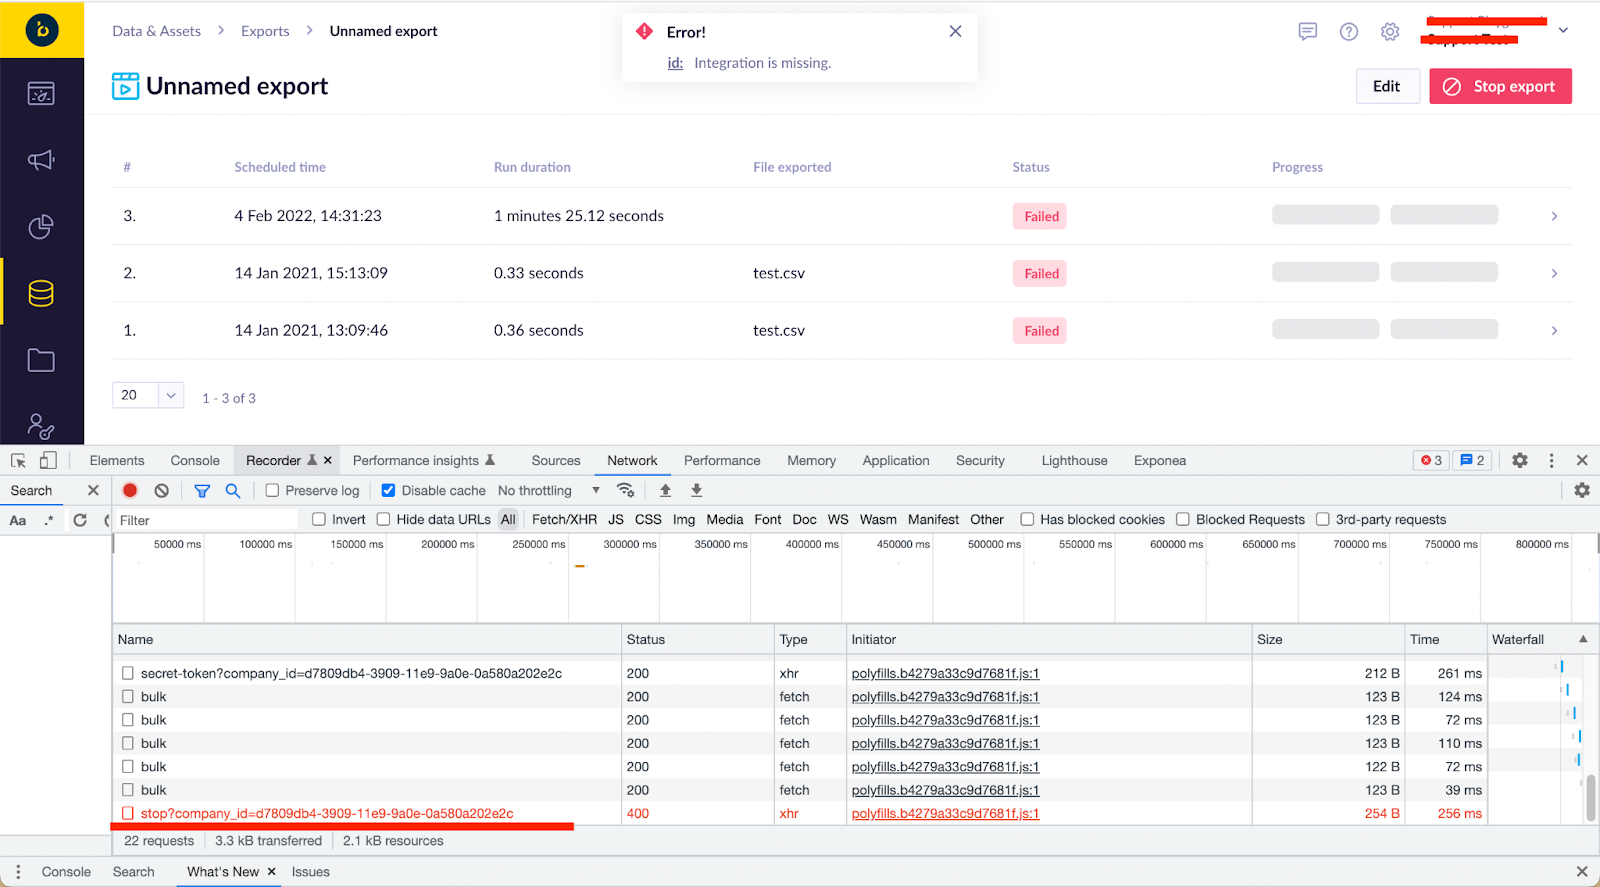
These requests are usually marked in red and have a status code that starts from 4 or 5 such as 400 in this case.
You have captured the error in the session history.
Save the session as a HAR file. Export the HAR file by clicking on the corresponding button and send it to the support team.

Did this article help you?
Please provide your feedback. We would like to know if our help center is effective in solving your queries. You can also leave comments and suggestions on how we can make our help articles better. You can also suggest topics you’d like us to cover.
Updated 5 months ago
