

Site search metrics
This guide explains how to use the Site search tab to monitor search performance, find your top-performing queries, and access relevant preset reports to optimize keyword searches.
What the Site search tab shows
The Site search tab displays performance for the queries your shoppers are running. It combines metric cards, a chart, and a queries performance table, so you get both a summary and query-level detail in one view.
Above the metric cards, a scope selector shows All search traffic by default. Use Custom scope to narrow every card, chart, and table to a defined set of queries.
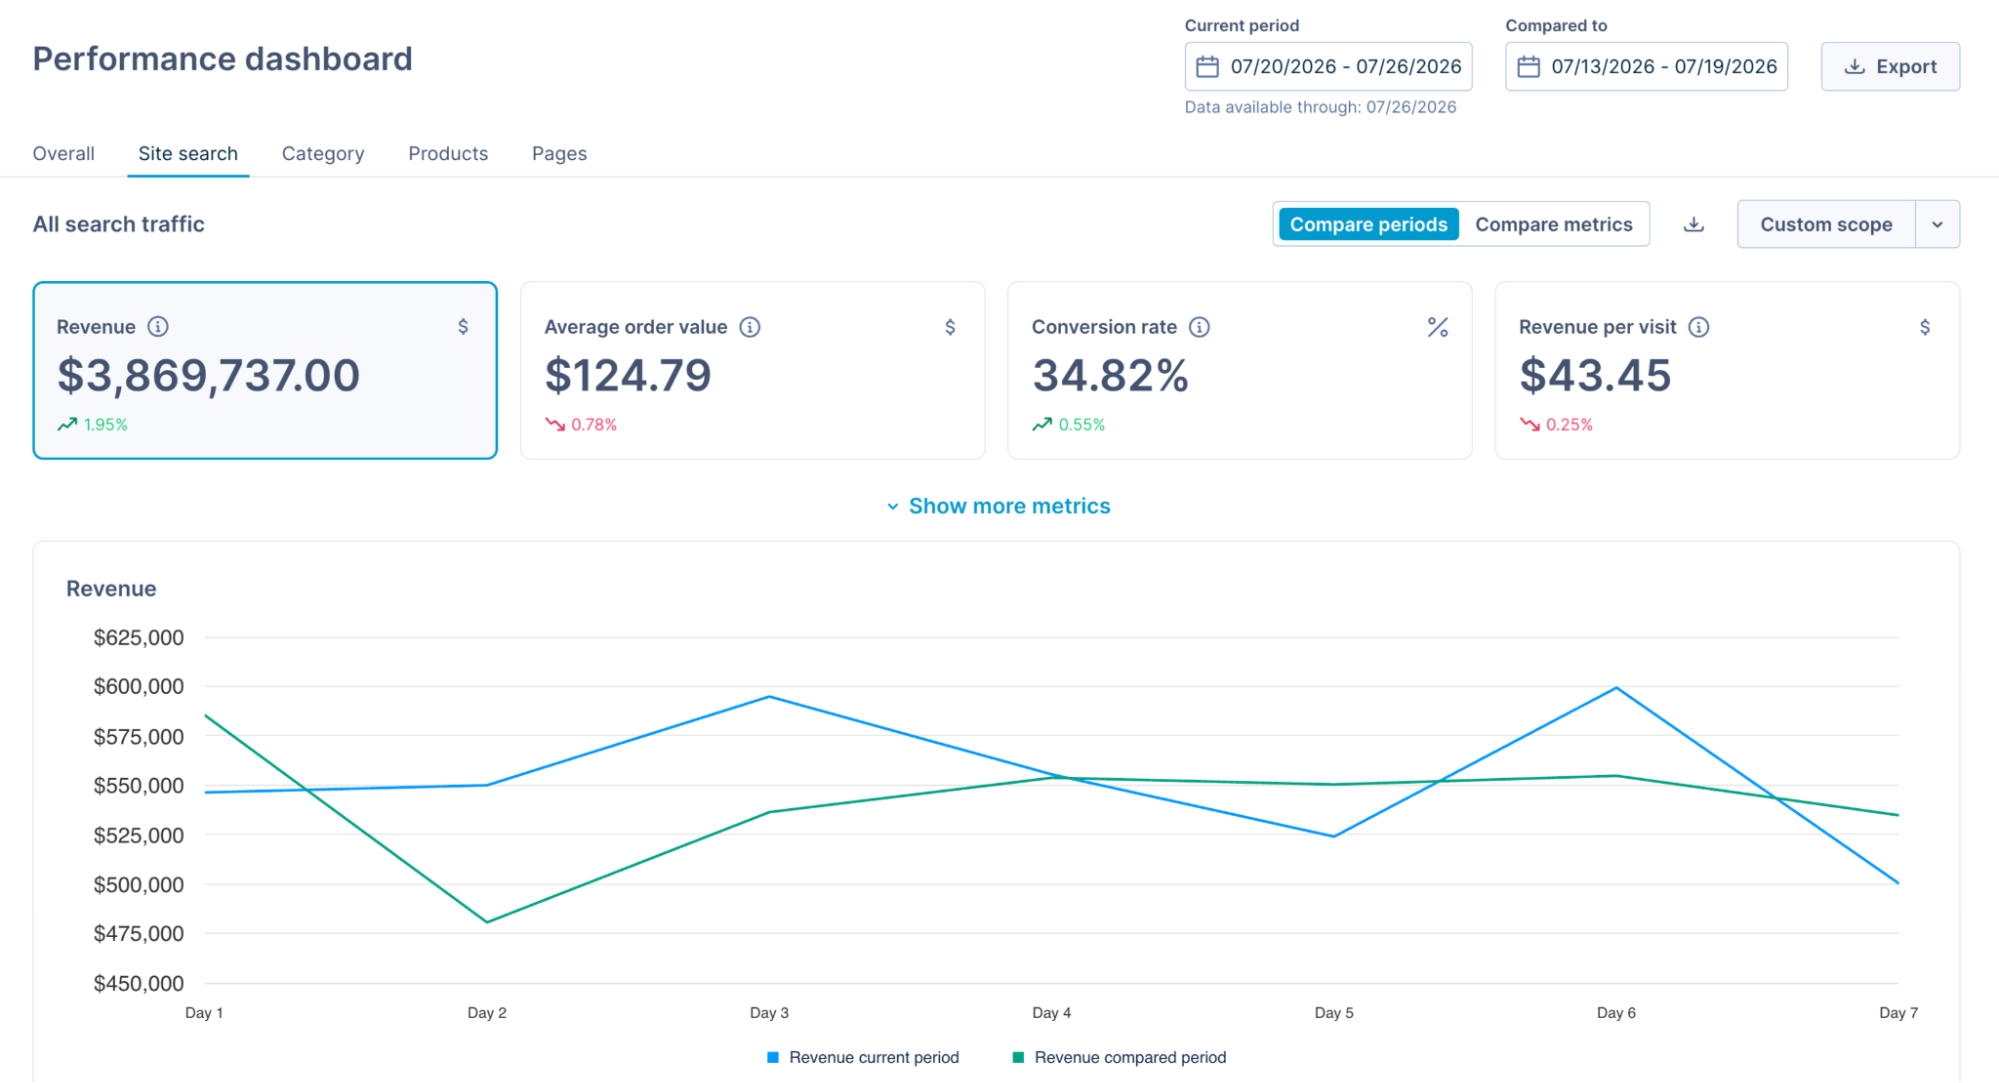
See the Performance dashboard overview to work with the date range, trends, metric comparisons, and exports.
Metric cards
The Site search tab displays the key metrics for all search traffic. To work with the cards:
- Select Show more metrics to expand the full metric set.
- Select the information icon next to a metric name to view its definition and formula.
- Select the download icon to export the one-time CSV data.
Metrics chart
The chart plots your selected metrics over the selected period.
Query performance table
View all queries searched during the selected current period. The queries performance table shows which search terms drive the most traffic, revenue, and conversions. Use it to find your highest-performing queries, spot underperforming terms, and decide where to focus your merchandising.
Sort by any column, and turn on Show trends to display period-on-period change next to each value.
Drill down into a query
Select any query in the table to open a detailed view for that search term. The drill-down shows how that query performs in isolation, including its revenue trend over time. It includes:
- Metric cards scoped to that query, each showing its share of search traffic.
- A chart for that query over the selected period.
- A products performance table listing the products participating in that query — the products that drive its performance. Filter and search the table, sort by any column, and turn on Show trends for period-on-period change.
- Previous paths and Next paths tables, showing the pages shoppers visited immediately before and after this query.
For example, for the query "Leather Jacket", see which products contributed the most to revenue, add-to-carts, and conversions. Sort by revenue for your highest earners, sort by conversions for your best closers, or apply a custom filter to define top performance on your own terms.
Analyze previous and next paths
Previous paths show the action that happened just before the search, meaning what the shopper viewed or did right before they searched. Next paths show the action that happened just after the search, meaning what the shopper did or viewed next.
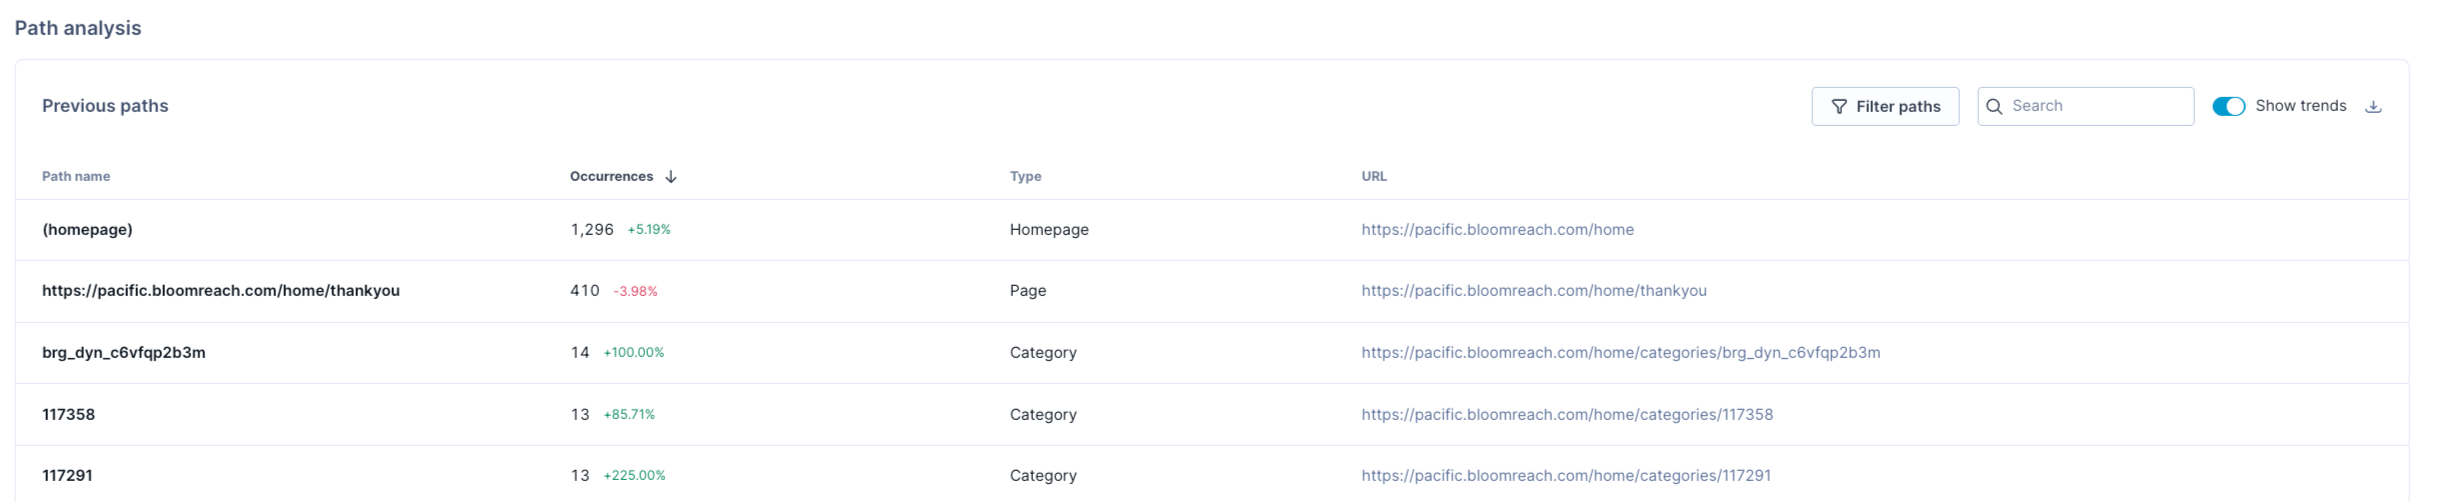
Each table shows only the event on either side of the query, not the shopper's full journey.
How previous and next paths are determined
Each time a shopper interacts with your site, the Bloomreach pixel records an event, such as a search, a category view, or a product page view. The previous path is the event recorded just before a search. The next path is the event recorded just after it.
Previous path examples
| What the shopper did | Previous path for query |
| Searches on Google → lands on your search results page for query "sneakers" | The page they came from, not your homepage |
| Views your homepage → searches "sneakers" | Homepage |
| Views your homepage → opens the "Sneakers" category → searches "running shoes" | Category "Sneakers" |
Next path examples
| What the shopper did | Next path for "sneakers" |
| Searches "sneakers" → views a product → adds it to the cart | Product |
| Searches "sneakers" → searches "white leather sneakers" | Query"white leather sneakers" |
View trends
To view trends data starting from February 15, 2026 in Paths reports, turn ON the Show trends toggle.
ImportantPath data uses pixel events for trends. If page view pixels are missing or broken in that period, paths can be incomplete or inaccurate.
| Column | Description |
| Path name | The event that happened just before the search (Previous paths) or just after it (Next paths). |
| Occurrences | In Previous paths, how many times this event happened just before shoppers searched for the query. In Next paths, how many times it happened just after. |
| Type | The kind of event: Query, Category, Product, Page, or Homepage. |
| URL | The page address the pixel recorded with the event, including any parameters, such as locale or UTM campaign parameters. |
Filter and review paths
Use Search to find a path by name, or Filter paths to narrow a table. For example, to see paths from a campaign, filter by URL that contains utm_campaign=summer_sale, then click the download icon to save the results.
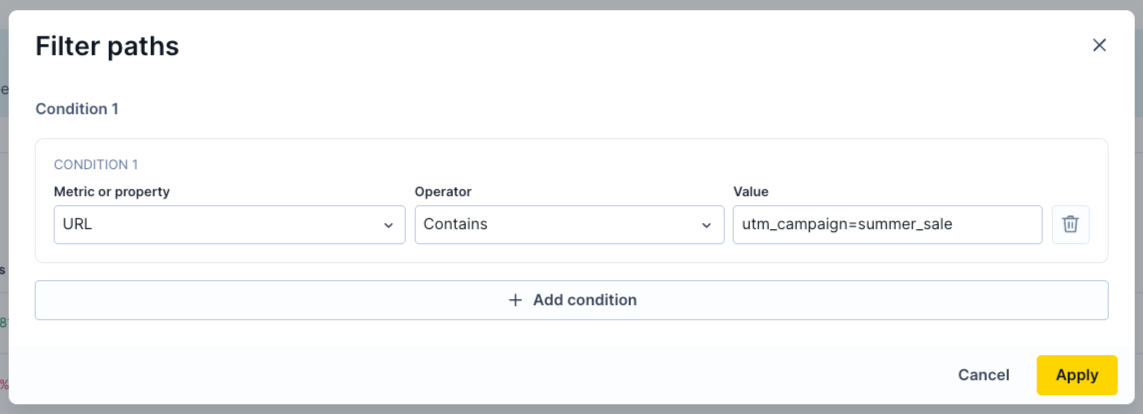
Use Filter paths to narrow a table by type, path name, occurrences, or URL.
The same path name can appear in more than one row when its URLs differ, for example:
- Letter case: one URL has "Christmas lights," and another has "christmas lights".
- Locale: one URL has
/nl/and another has/en-us/.
Compare the URL column to see which locale or campaign shoppers came from.
Drill down by device
View the site search performance metrics for each device type: desktop, mobile, and tablet. Compare how site search performs across different devices.
Build search reporting use cases
Find queries that need attention
Surface searches with traffic but weak conversion, so you know where to focus merchandising.
- Build a custom filter that combines conditions. For example, Visits greater than 300, Product page views greater than 100, and Conversion rate less than 2%.
- Save the filter by name for later reuse.
Fix zero-result and zero-revenue searches
Find searches that return no results or earn no revenue, then add synonyms, redirects, or merchandising.
- Apply the No search results or No revenue keywords preset filter.
- Work down the list and act on each query.
Find your highest-bounce queries
Rank searches by bounce rate to see where shoppers give up. With no filter applied, sort the queries table by Bounce rate, highest first.
Find fast-moving queries by trend
Spot the queries gaining or losing ground the fastest — something raw-number reports can't show.
- Build a custom filter on a trend instead of a raw value. For example, Revenue trending up more than 5%.
- Click Save and apply to surface items by momentum, not just totals.
Track a seasonal or campaign spike
Group event-related searches and watch them as a single set throughout the event.
- Create a custom scope with the contains operator. For example, contains "father's day".
- Monitor the scope's metric cards, chart, and table across the campaign.
Measure the impact of search ranking rule
See how the queries you re-ranked performed after the change.
- Create a custom scope listing the affected queries.
- Set the Current period to start on the rule's launch date. The comparison period auto-selects the matching prior window.
- Monitor the trends to see the lift.
For a pre/post view of a change, open the rule in the Impact measurement tab.
Find your top products for a query
Decide what "top" means for you, then rank the products behind a search.
- Select a query to open its drill-down.
- Sort the participating-products table by Revenue, Conversions, or another metric to define top performance your way.
Updated 4 days ago