

Measure impact of changes
This guide details how to use the Impact measurement tab in the Performance dashboard to measure how your merchandising changes affect site performance. The tab tracks the changes you make most often: ranking rules for queries and categories, synonyms, and redirects.
Prerequisites
Permissions: Your Users Admin must assign you the Insights reports editor permission.
Review merchandising changes
The Impact measurement tab logs every change automatically and compares performance after it with performance before it. Metrics for a change appear the day after you create or update it and stay in the tables for 45 days.
The system removes a change from the tables after 45 days. If you made no changes in the last 45 days—for example, during a holiday period—the tables remain empty.
-
Go to Insights > Performance dashboard and select the Impact measurement tab.
-
Changes are grouped into Ranking rules, Synonyms, and Redirects.
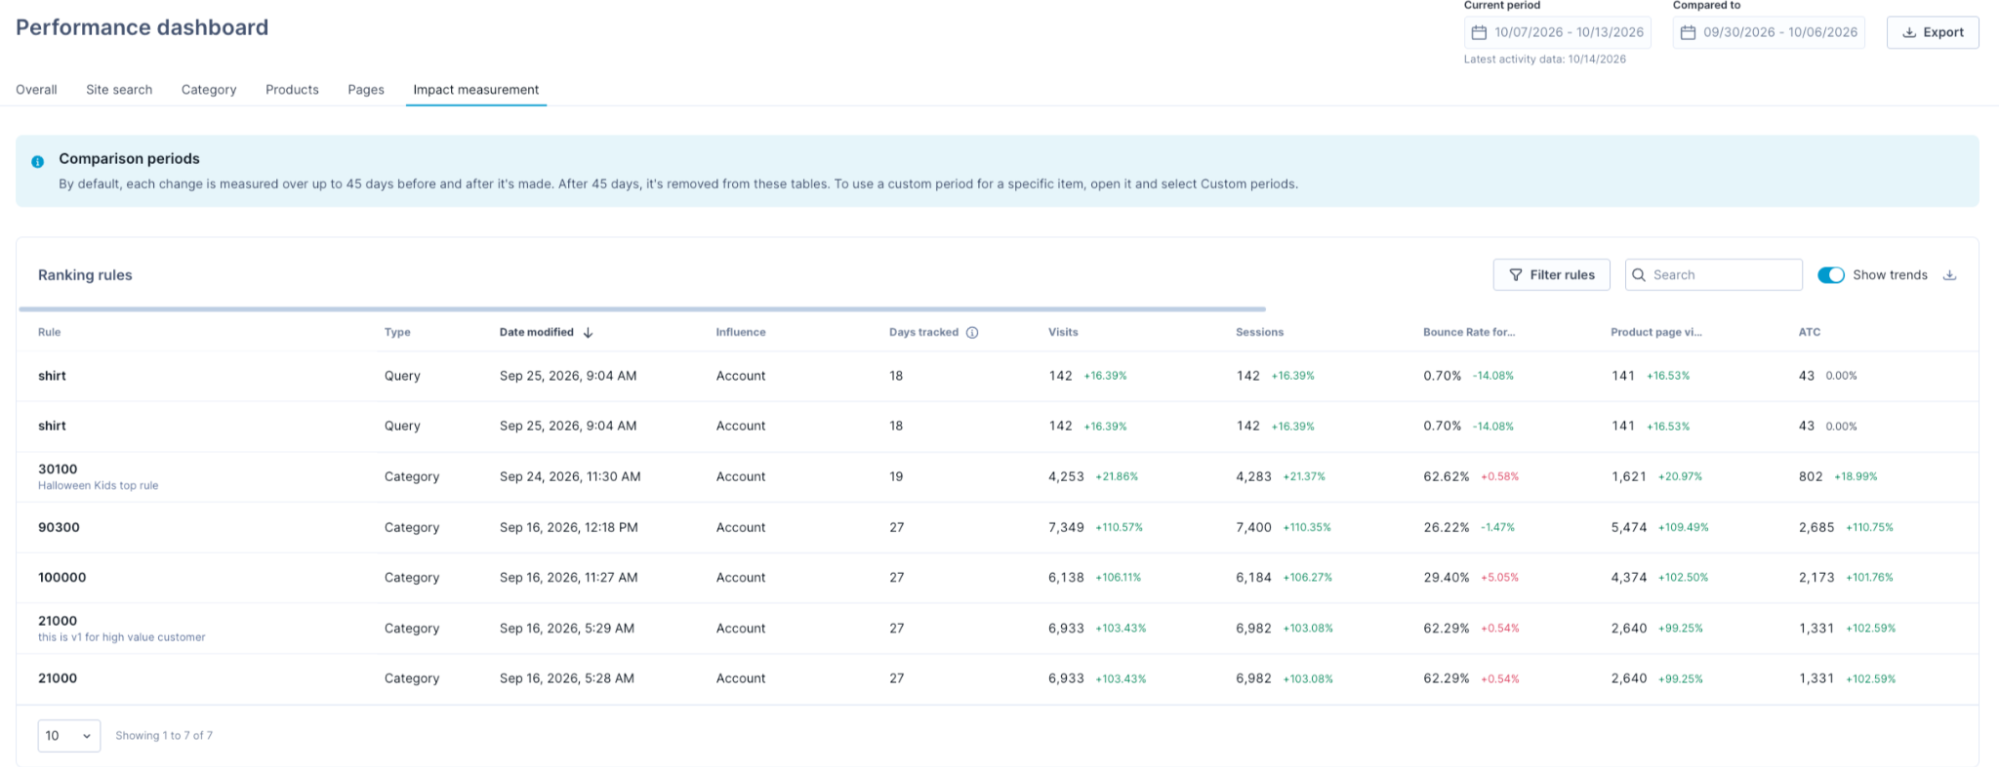
| Column | Description |
| Rule, Synonym, or Identifier | The rule name and its note, the synonym terms, or the redirect name and its destination URL. |
| Type | Query or Category for ranking rules, One way or Two way for synonyms. |
| Date modified | The date and time of the latest change, in your local time. If you update a rule again, its entry moves to the new date and tracking restarts from there. |
| Influence | The level where the change was made, such as Account or Site. Changes made at the account level apply to every site under it. |
| Days tracked | Days since tracking started (the day after the last change). |
| Metric columns | Visits, Sessions, Bounce rate, Product page views, ATC, Conversions, Revenue, AOV, ATC rate, Conversion rate, and RPV for the period after the change. |
NoteRules running in an A/B test don't appear in the tables. Use the A/B test results to assess them.
Search and filter rules
- Search for a rule, term, or redirect.
- Click Filter rules to filter the table. See Filter tables.
- Toggle Show trends ON to show the change against the period before it next to each value. See View trends.
- Click the download icon to export the table as a one-time CSV. See Export your data.
Measure impact of a specific change
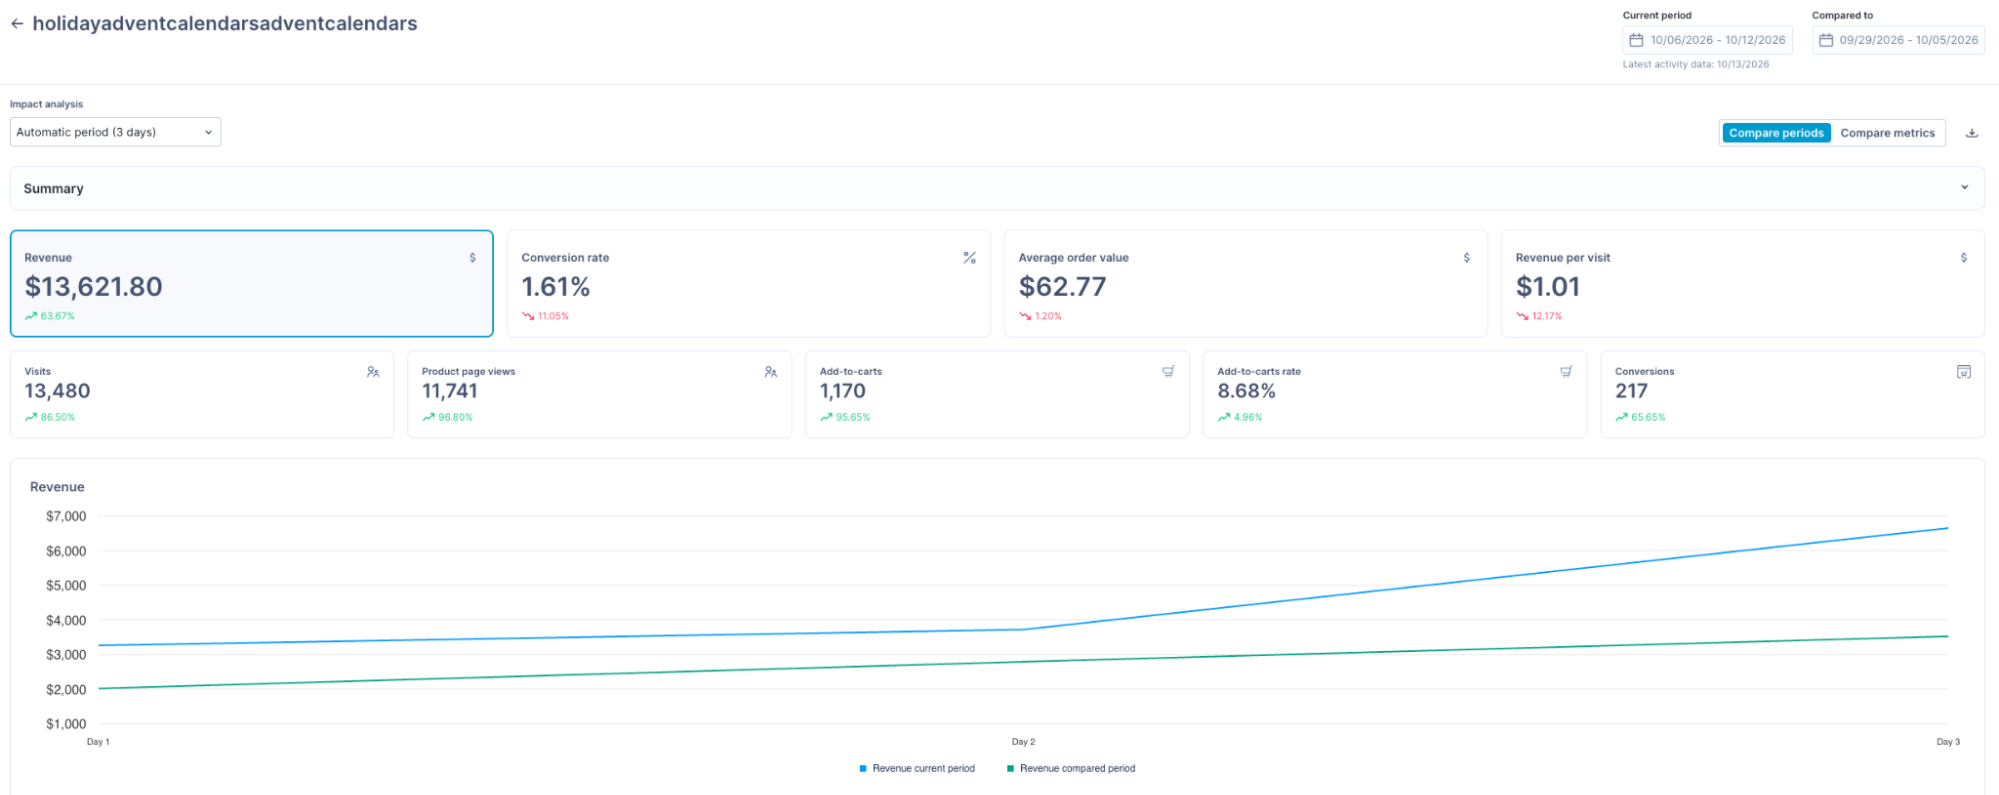
Hover over a ranking rule or synonym and click View to open the details of that change. The details page includes:
-
Impact analysis: The comparison method for the change.
-
Summary: The details of the change.
-
Metric cards: Revenue, Conversion rate, Average order value, Revenue per visit, Visits, Product page views, Add-to-carts, Add-to-carts rate, and Conversions, each with its trend against the compared period.
-
Metrics chart: The selected metric for the current period and the compared period, plotted day by day.
-
Breakdown: For multi-query/category rules and two-way synonyms, the performance of each term, shown below the chart.
To assess a redirect, use its row in Redirects. The metrics measure the destination page, usually a category page, before and after the redirect. They don't measure the query itself.
Choose comparison period
Both periods are counted from the Date modified. The current period starts the day after the change, and the compared period ends the day before it. Select how to compare the periods in the Impact analysis drop-down:
-
Automatic period (default): Compares the days since the change with the same number of days before it, up to 45 days. For example, 13 days after a change, you see Automatic period (13 days). The date pickers at the top of the page don't apply.
-
Custom periods (Date selector): Keeps the start of the Current period fixed and lets you choose when it ends. Pick any Compared to range that ends before the change. Use it to compare against a longer period before the change, such as 1 month.
NoteDate modified shows in your local time, while data is processed per calendar day. If your team is collaborating across different time zones, you may see different timestamps, but the underlying data remains identical.
Read summary
Click the arrow on Summary to expand or collapse the change summary.
Compare metrics in chart
Select a metric card to plot it. Use Compare periods or Compare metrics to change how the chart plots the data. See Compare metrics in chart. Click the download icon to export the data as a one-time CSV.
Build impact measurement use cases
Pick the metric that matches the goal of your change, such as visits, add-to-carts, conversion rate, or revenue per visit.
Check if a ranking rule change performs well
See how a query or category performed after you re-ranked its results.
- In Ranking rules, search and open the rule.
- Select the metric card that matches your goal and compare the current period against the compared period in the chart.
Validate a new redirect
Check whether the traffic you redirect helps the destination page. For example, you redirect queries with no results to a sale page, or queries with few results to a category page so shoppers can browse.
- In Redirects, find the redirect by its term or phrase.
- Compare the destination page's Visits, Conversion rate, and RPV against the period before the redirect.
Compare a change against a longer period
Holidays, sales, or low-traffic days before a change can skew a same-length comparison. Compare against a longer period to even them out.
- Open the change from its table.
- In Impact analysis, select Custom periods (Date selector).
- Set Compared to to a longer range before the change, such as the previous 1 to 3 months.
Analyze a change after 45 days
After 45 days, analyze the change in the Site search or Category tab. Create a custom scope for the affected queries or categories, and set the Current period to start the day after the change.
Updated about 2 hours ago