

Retrieve and evaluate A/B test results
While the test runs, you can return to the A/B tests page anytime to check the results by clicking the Open / View button that appears when you hover over a test in the list.
When are the results visible?
Results will be available 24 hours after starting the test and will continue to show updated results. The update schedule can vary for different customer groups. The data might reflect updates from a few hours ago or, at most, 24 hours prior.
Roles to access test reports
You must have at least one of these IAM roles to view the A/B test reports:
- Categories merchandising editor
- Global merchandising editor
- Search merchandising editor
- SEO thematic pages editor
- SEO widgets editor
Steps to interpret A/B test results
Following are the steps to interpret the A/B test results:
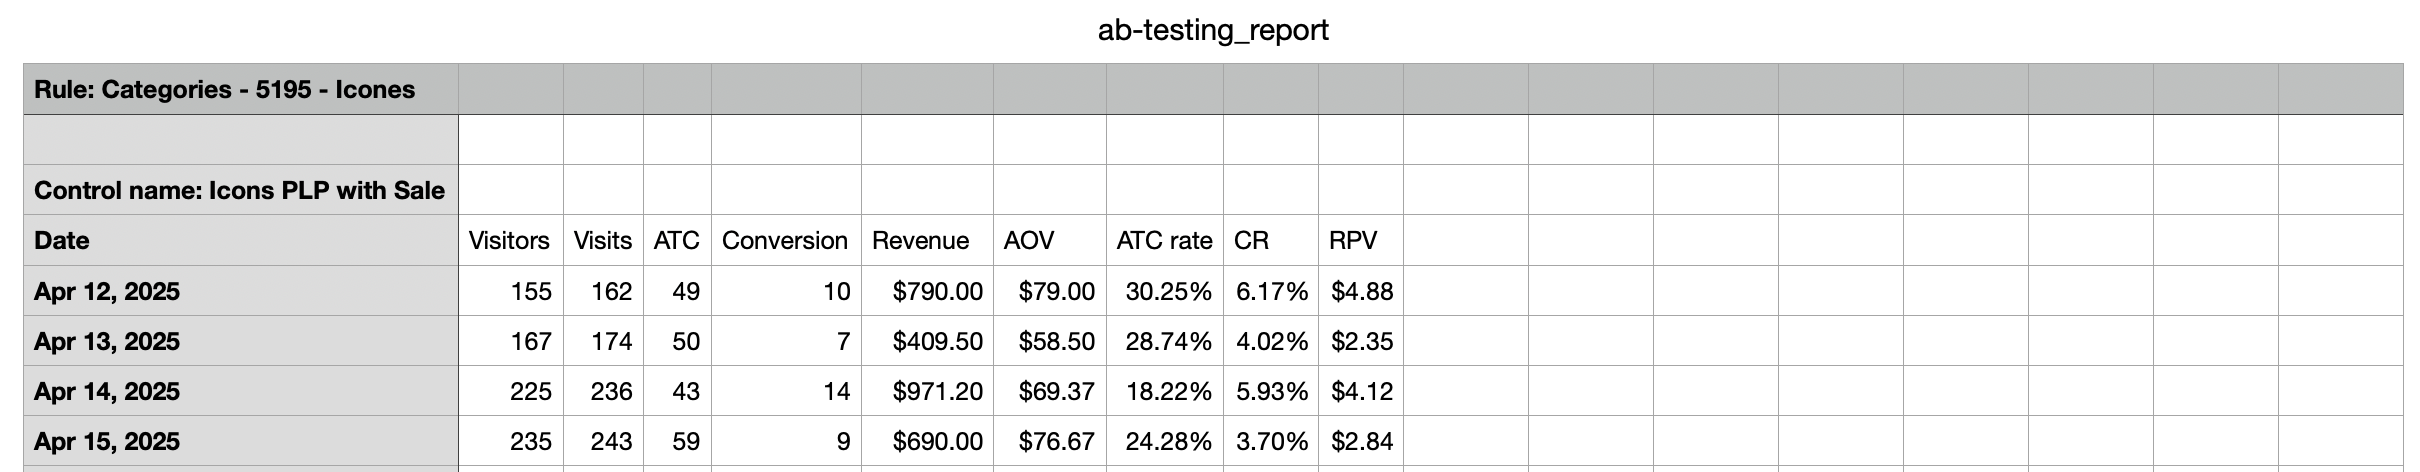
1. Review metrics
Check key metrics that are relevant to your business goals. Compare the metrics between the test variant and the control group.
Each metric displayed in the dashboard has an informational tooltip that shows the metric’s definition or what it calculates.
The available metrics are listed below:
- Visitors - The number of unique shoppers that visit and interact with a test bucket during the experiment.
- Visits - The total number of times a test bucket was visited during the experiment. One unique visitor can have multiple visits.
- ATC - The number of times a product was added to the shopping cart in a test bucket.
- Conversion - The number of orders (identified by unique order IDs) placed in a test bucket.
- Revenue - The total revenue generated from the sales in a test bucket.
- AOV (Revenue | Conversions) - The average amount spent per conversion.
- ATC rate (ATC | Visits) - Percentage of visits that resulted in adding items to the cart.
- CR (Conversions | Visits) - Percentage of visits that resulted in a conversion.
- RPV (Revenue | Visits) - Revenue per visit.
Exclude outliers automatically
While A/B testing, any visit/session with an abnormally high number of searches (behavioral outlier) or anomalously high-revenue orders (monetary outlier) is considered an outlier. These anomalies can interfere with the calculation of key metrics and significantly skew the results.
For example, a bot scraping your site can trigger a large number of search requests or other actions, without generating any revenue.
Excluding outliers improves the representation of actual user traffic by excluding undesirable sources of traffic, ensuring more reliable test results.
On the A/B test results report, you can check the Exclude outliers checkbox to automatically identify and exclude outliers from the test results computation. When outliers are excluded, the data in the table as well as charts change accordingly.

A visit qualifies as a behavioral outlier if the user made at least 100 searches, and had a z-score greater than 7 (the number of searches performed by the user is 7 standard deviations more than the mean number of searches per visit for the A/B test).
If a user's order revenue from a visit falls in the top 0.1% of all your order revenues, the visit is identified as a monetary outlier. This prevents the skewing of metrics like AOV and RPV.
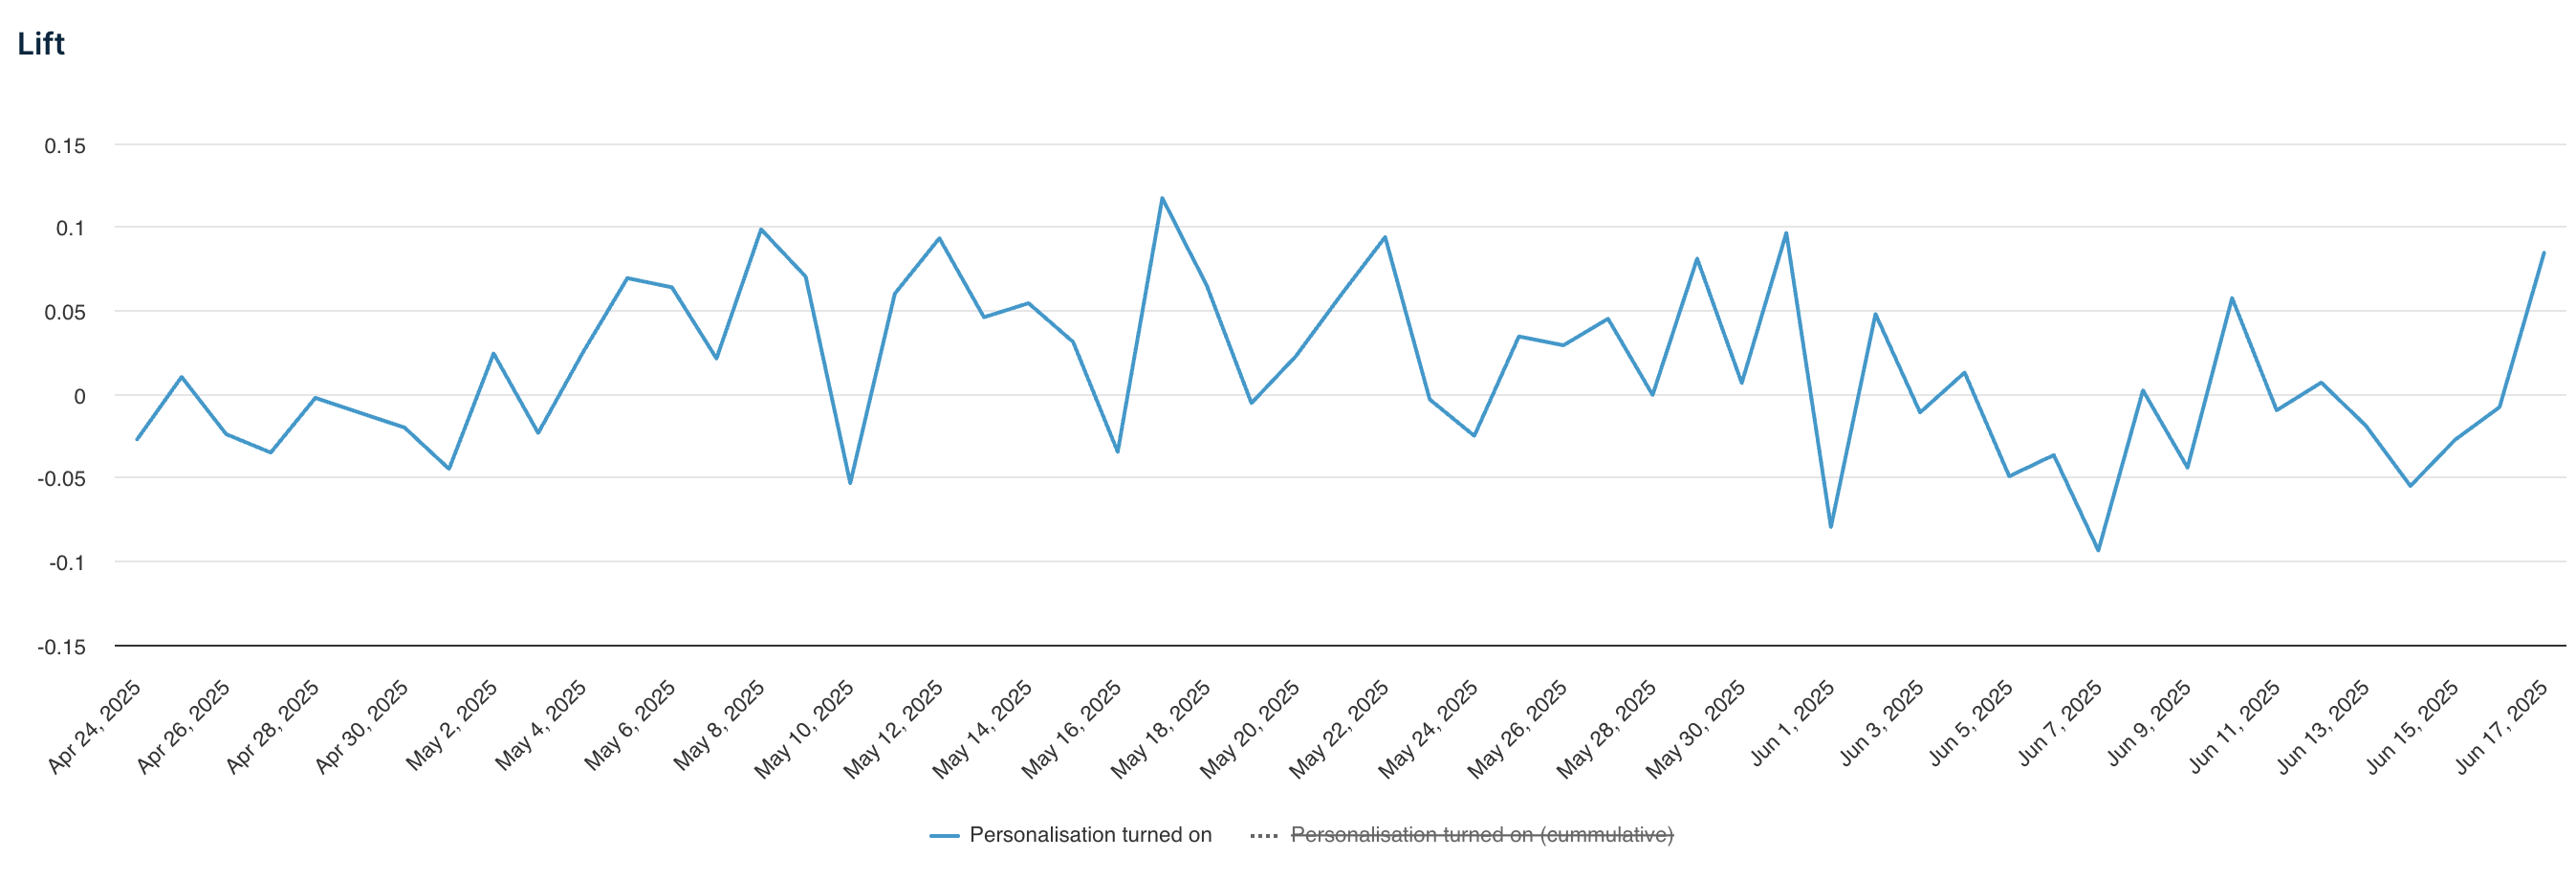
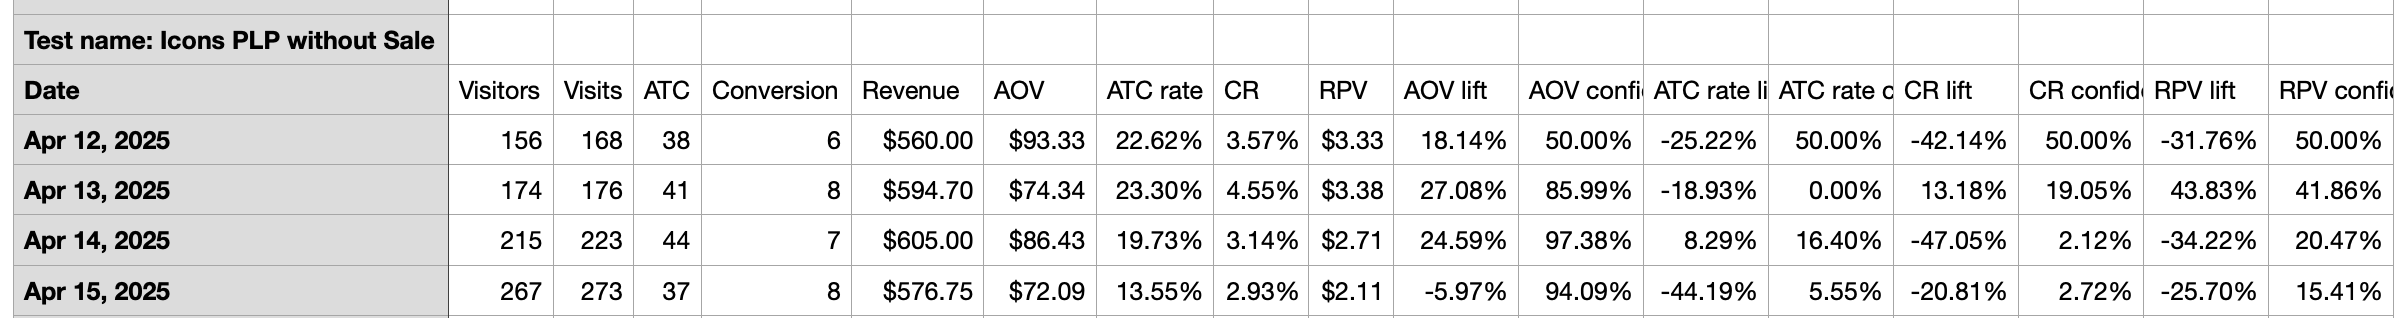
2. Examine the Lift
You can find the Lift values with the absolute value for the performance measures.
Look at the lift value to see how much the test variant improved over the control. The lift displayed in the table is averaged over the report period. Lift can be positive or negative.
The Lift plot under CHARTS indicates the changes in lift on the value of success metrics (like AOV, ATC, CR, RPV) over time. It shows different lines for the daily lift (change from the previous day), and the cumulative lift (total change from the start of the test). Observing these trends can help identify periods of very high/low lift.
The lift chart is only visible if success metrics like AOV, ATC, CR, or RPV are selected.
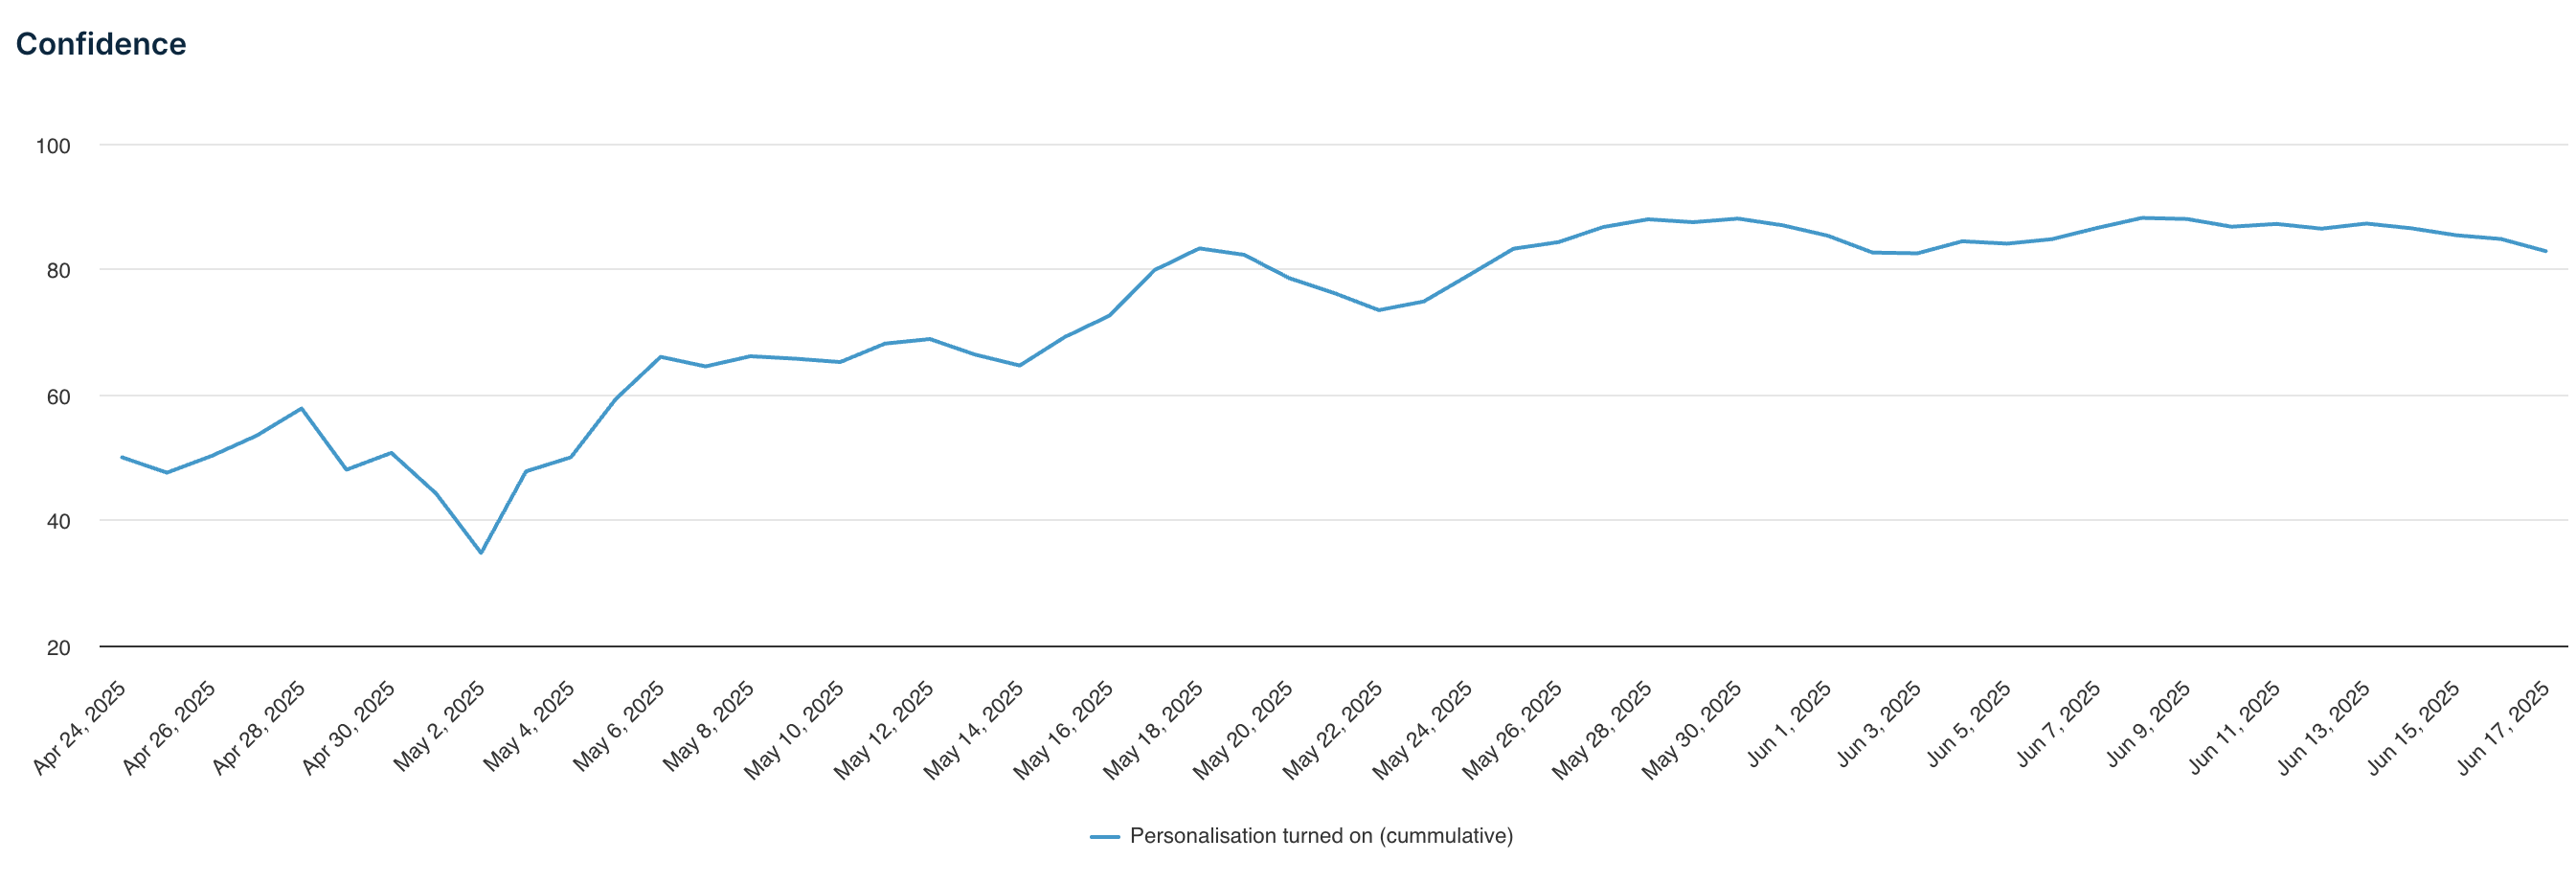
3. Check the confidence levels
The confidence level in the results panel indicates the statistical certainty of the lift. A higher percentage (more than 85%) suggests the results are reliable. The confidence in the table is of the latest day in the report period.
The confidence score and chart are generated after 2 days of test runs, and a minimum of 1000 visits to the test buckets.
The Confidence plot under CHARTS indicates the change in the value of confidence over time. Observing these trends can help identify anomalous behavior and periods where the confidence was extremely high/low.
4. Analyze charts
Use charts to see trends of different metrics over time and spot any patterns.
By default, only the trend chart of the test’s selected success metric is shown. Using the Select charts to display selector, multiple charts for different metrics can be selected and viewed at once.
Hover over any line to view the exact value of the metric at a specific point. You can also toggle the visibility of hidden trendlines by clicking on the labels under the x-axis.
5. Make decisions
- If the lift is positive and the confidence level is high, consider implementing the changes from the test variant on your site.
- If results are inconclusive, consider ending the test and starting a new one.
You can export the daily test results as a CSV file using the Download or Copy data buttons next to the date selector.
Downloaded file format
Test result values (including Lift and Confidence) for all A/B test buckets are available in separate columns.
New file format
Earlier this downloaded report stored Lift and Confidence values in the same cells as the success metric:
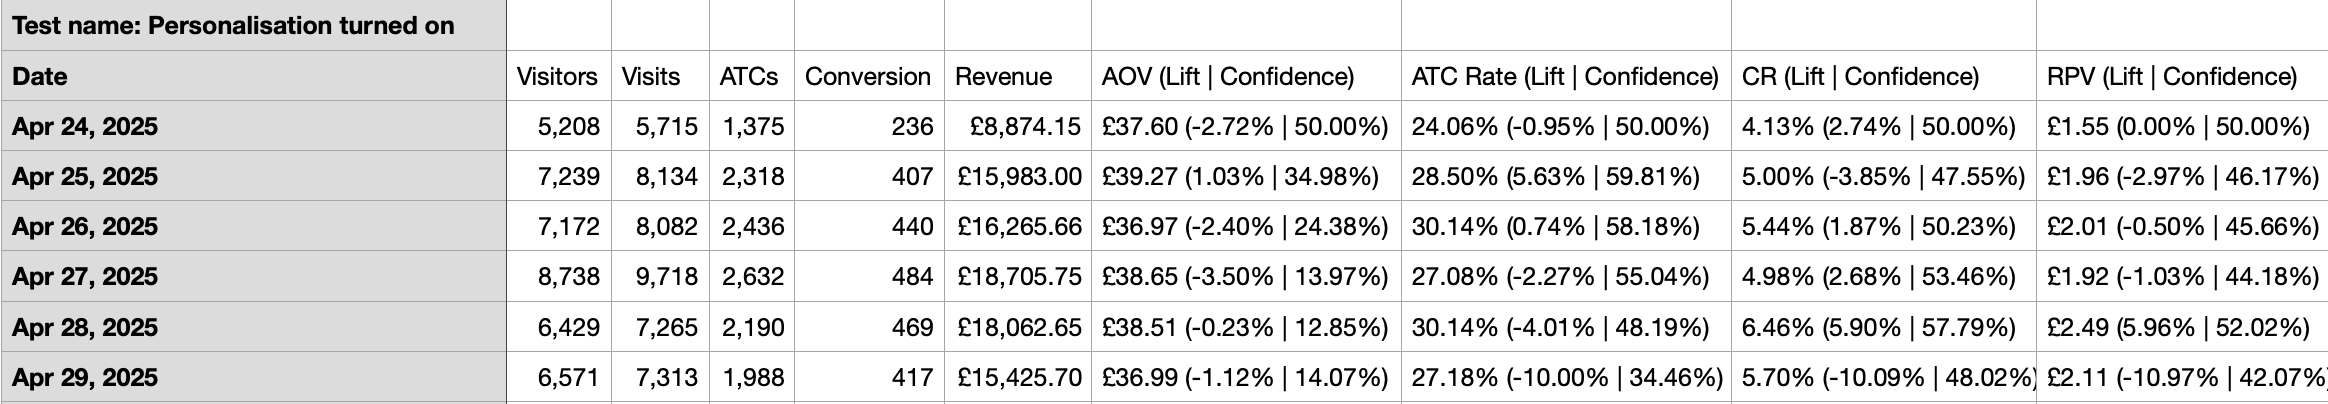
Old file format
Copy button format
Copies the high-level metrics from the results table in a CSV/TSV compatible format.
A/B test metadata in API response
The Product and Category Search API response includes metadata of the active A/B tests that the particular search request participates in. This can be used to analyze which A/B test experiments and variant audiences a user was part of.
The response data includes the experiment and variant names. The _br_uid parameter (cookie) for that API request helps identify the user.
Here is an example of the response metadata with A/B test data:
{
  "metadata": {
    "query": {
      "query_tags": {
        "untagged_tokens": [
          "watch"
        ]
      },
      "precision": {
        "configured": {
          "value": ""
        },
        "applied": {
          "value": "text_match_precision"
        }
      }
    },
    "experiments": [
      {
        "ab_test_experiment_name": "Search\+ vs Keyword",
        "ab_test_variant_name": "Variant A"
      },
      {
        "ab_test_experiment_name": "Category Ranking Rule - Global",
        "ab_test_variant_name": "Control"
      }
    ]
  }
}
The experiments field in the response shows A/B test metadata and has the following properties:
ab_test_experiment_name- The name of the A/B test experiment as set in the dashboard.ab_test_variant_name- The name of the assigned variant, as set in the dashboard.- It is only available if a valid
_br_uidparameter is passed in the API call, and the user falls into an active A/B test experiment.
This compatibility with the API enables you to monitor or log A/B test performance outside the Bloomreach dashboard. You can pass this metadata to your preferred or custom-built Analytics tools.
Updated 4 months ago