Heatmap
The Heatmap is a Bloomreach Google Chrome extension that allows you to see how your customers are shopping on your web page. This allows you to evaluate the business impact of your site layout based on what customers click on and what they don't.
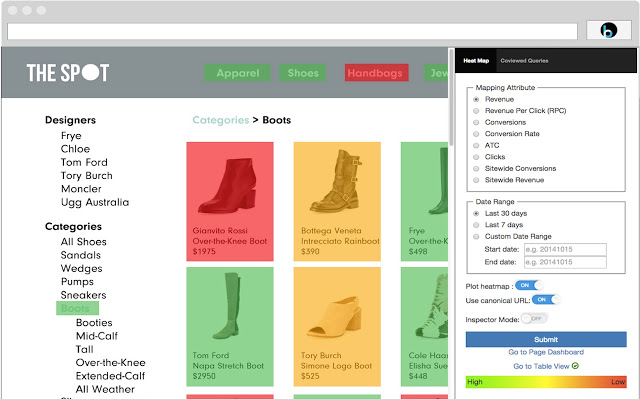
The extension exposes information regarding the performance of elements of your page (links, product images, etc.) relative to four performance metrics: add-to-cart, conversion, revenue, and clicks. Information is displayed using a gradient of color from red (low) to yellow (medium) to green (high) that reflect relative performance on that single page.

Using the Heatmap
To start using the Heatmap, you must download the extension from Chrome Web Store. Click here to directly go to the link. The exact steps are given below:
- Download the Heatmap extension Bloomreach Compass from the Chrome Web Store. Once the plugin is installed, you will see a Bloomreach icon in the toolbar next to Settings.
- Open the live site in your browser.
- Click on the Bloomreach Heatmap icon to see the statistics for the page.
Heatmap uses Bloomreach Dashboard to authenticate users. Therefore, you must ensure that you do the following:
- Log in to the Insights dashboard in the same browser window once it is installed.
- Navigate to any other Insights page (other than the Overview). This will trigger the user authentication.
Settings

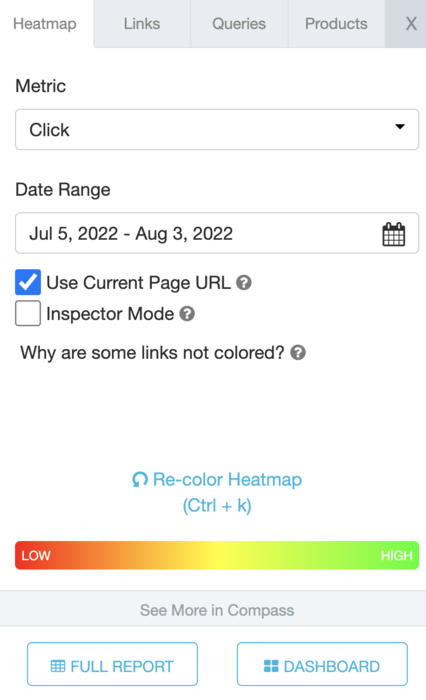
- Metrics: Choose to change the heatmap data based on any of the available engagement metrics: Revenue, Conversion, ATC and Click. When you select any of these metrics, make sure you are on the top of the page so that the heatmap can overlay properly.
- Date Range: Choose to change the date range to the last 30 days, 7 days, or a custom range. For custom range, enter the range in the format: year-month-date, eg. 20141230. Make sure to click on Apply after making a selection.
- Use Current Page URL: View heatmap data for the page URL exactly as shown in the browser. Most URLs have different variations for the same page. By default, heatmap will roll up the data for all these variations to provide you with a holistic view.
You must be at the top of the page until all the heatmap data is loaded so that it lines up with the links and images of the page. If you find the colors are not lined up, go back to the top of the page and reload the data.
- Inspector Mode: View heatmap data for a specific section of the page, such as the product grid or left nav. Use your mouse to select any selection.
- If you need to reference the tabled data for the heatmap, click on the link for the Full Report to view the Improve Page Layout report in the Insights dashboard.
- To view the complete page diagnostics, click on the Dashboard link from the Heatmap.
- To see engagement data for each colored block, hover over and a yellow popup should show all engagement metrics
- Links: The Links tab shows you the links associated with the Page.
- Queries: The Queries show you the queries associated with that page using the Association Score Metrics.
- Products: The products tab shows you all the products associated with that page using the Association Score Metrics.
Using Heatmap in Multi-site Accounts
If you have multiple sites, you must select the sub-site from within the Dashboard, as shown below. The heatmap will show the data on the live site for the subsite selected in the Dashboard.
To view site-level heatmap data:
- Go to the Dashboard > Insights.
- Click on Top Opportunities to see the list of Category pages.
- Select the domain name from the left drop-down menu selection as shown below.

- Click on the highlighted icon next to the name of the Category page you want to view the heatmap for. This will take you to the live site where heatmap will be displayed for the selected site.
![]()
Understanding the Data
Once you have the extension working you should see a range of colors light up your screen. With this information, you can choose to
- Change your top-level navigation, left-hand facets, category assortments, product assortments, promotions and more. Start with using “revenue” as your primary heatmap metric. The page is now colored by the links that generate the most revenue on the customers' conversion path.
- Look at what links are colored in yellow to green to understand what is best influencing the customer’s purchase.
- Focus on improving the layout of the page to providing more content that will drive conversions and removing or demoting content which is taking up valuable real estate and not driving revenue.
- To get an extra view of the data you can look at other metrics such as conversions or clicks. You may find that some links are getting a lot of clicks but don’t drive any revenue. You may want to remove that content or further investigate how to improve conversions on the next page they are clicking on.
Updated over 1 year ago
