

Track debug events in Integration mode
💡Prerequisite knowledge
We recommend that you review the following guide.
- Event diagnostics: This guide illustrates how to use the Event diagnostics tool.
Test pixel tracking with debug events
Setting up correct Pixel tracking is crucial. To ensure that the tracking works accurately, you can test using debug events in real-time. Debug events are special events sent with the parameter "debug=true" and treated as test data.
Event diagnostics provides two working modes: Integration mode and Live mode. Integration mode serves as your testing ground for tracking debug events.
Tracking debug events enables effective monitoring and troubleshooting of pixel implementations by developers and analysts. This guide illustrates how to use Integration Mode to track debug events and fine-tune your pixel setup before it goes live on your website.
Integration mode vs. Live mode
Refer to the table below for guidance on effectively using the two modes of Event diagnostics in your pixel implementation workflow.
| Integration Mode | Live Mode |
|---|---|
|
|
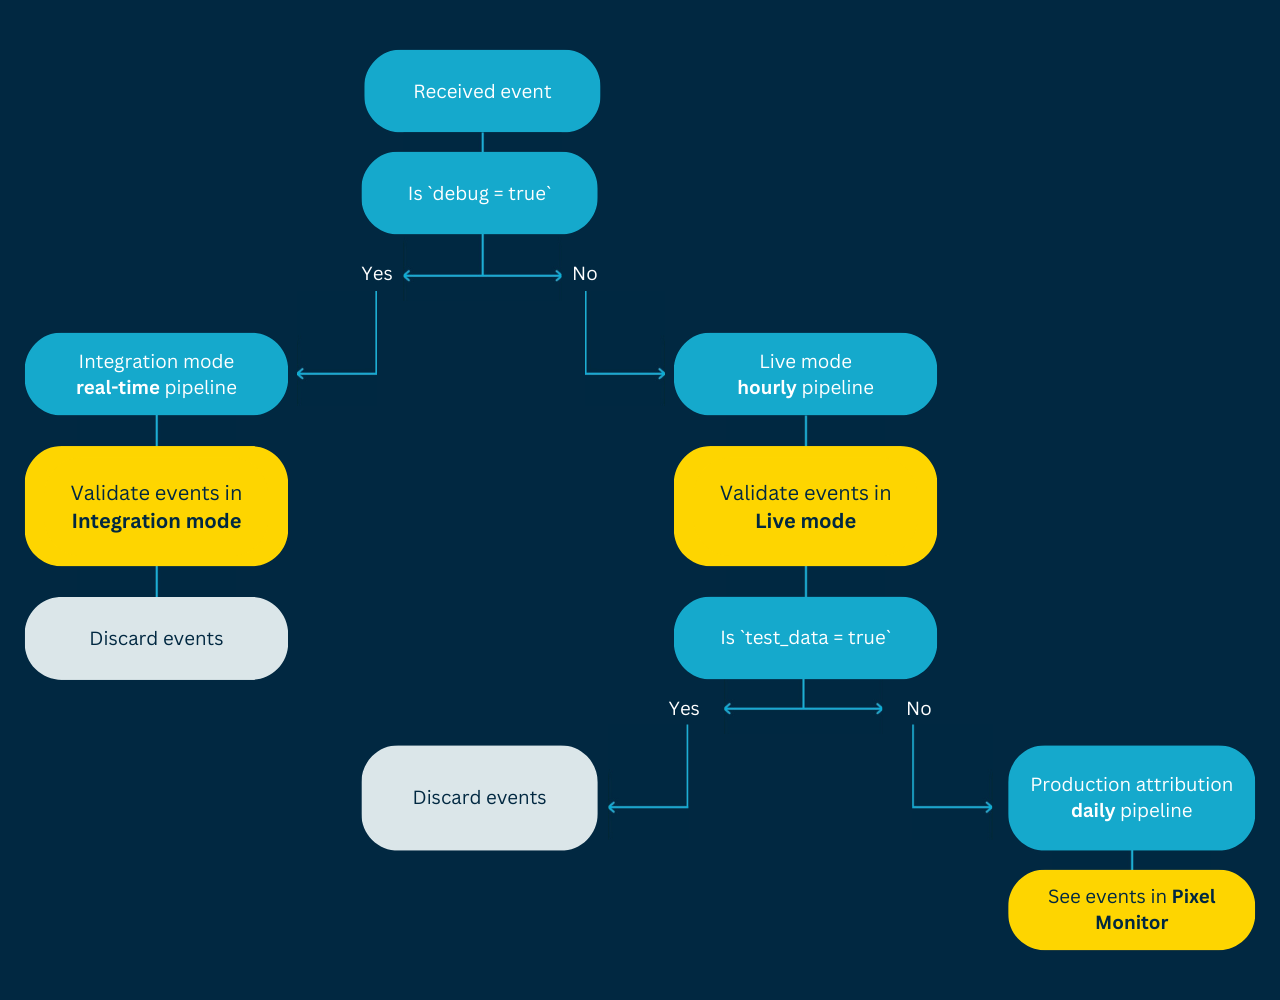
Here’s a visual that illustrates how debug events are tracked.
How to send and view debug events in Integration mode
1. Sending debug events
Follow the steps mentioned as per your implementation.
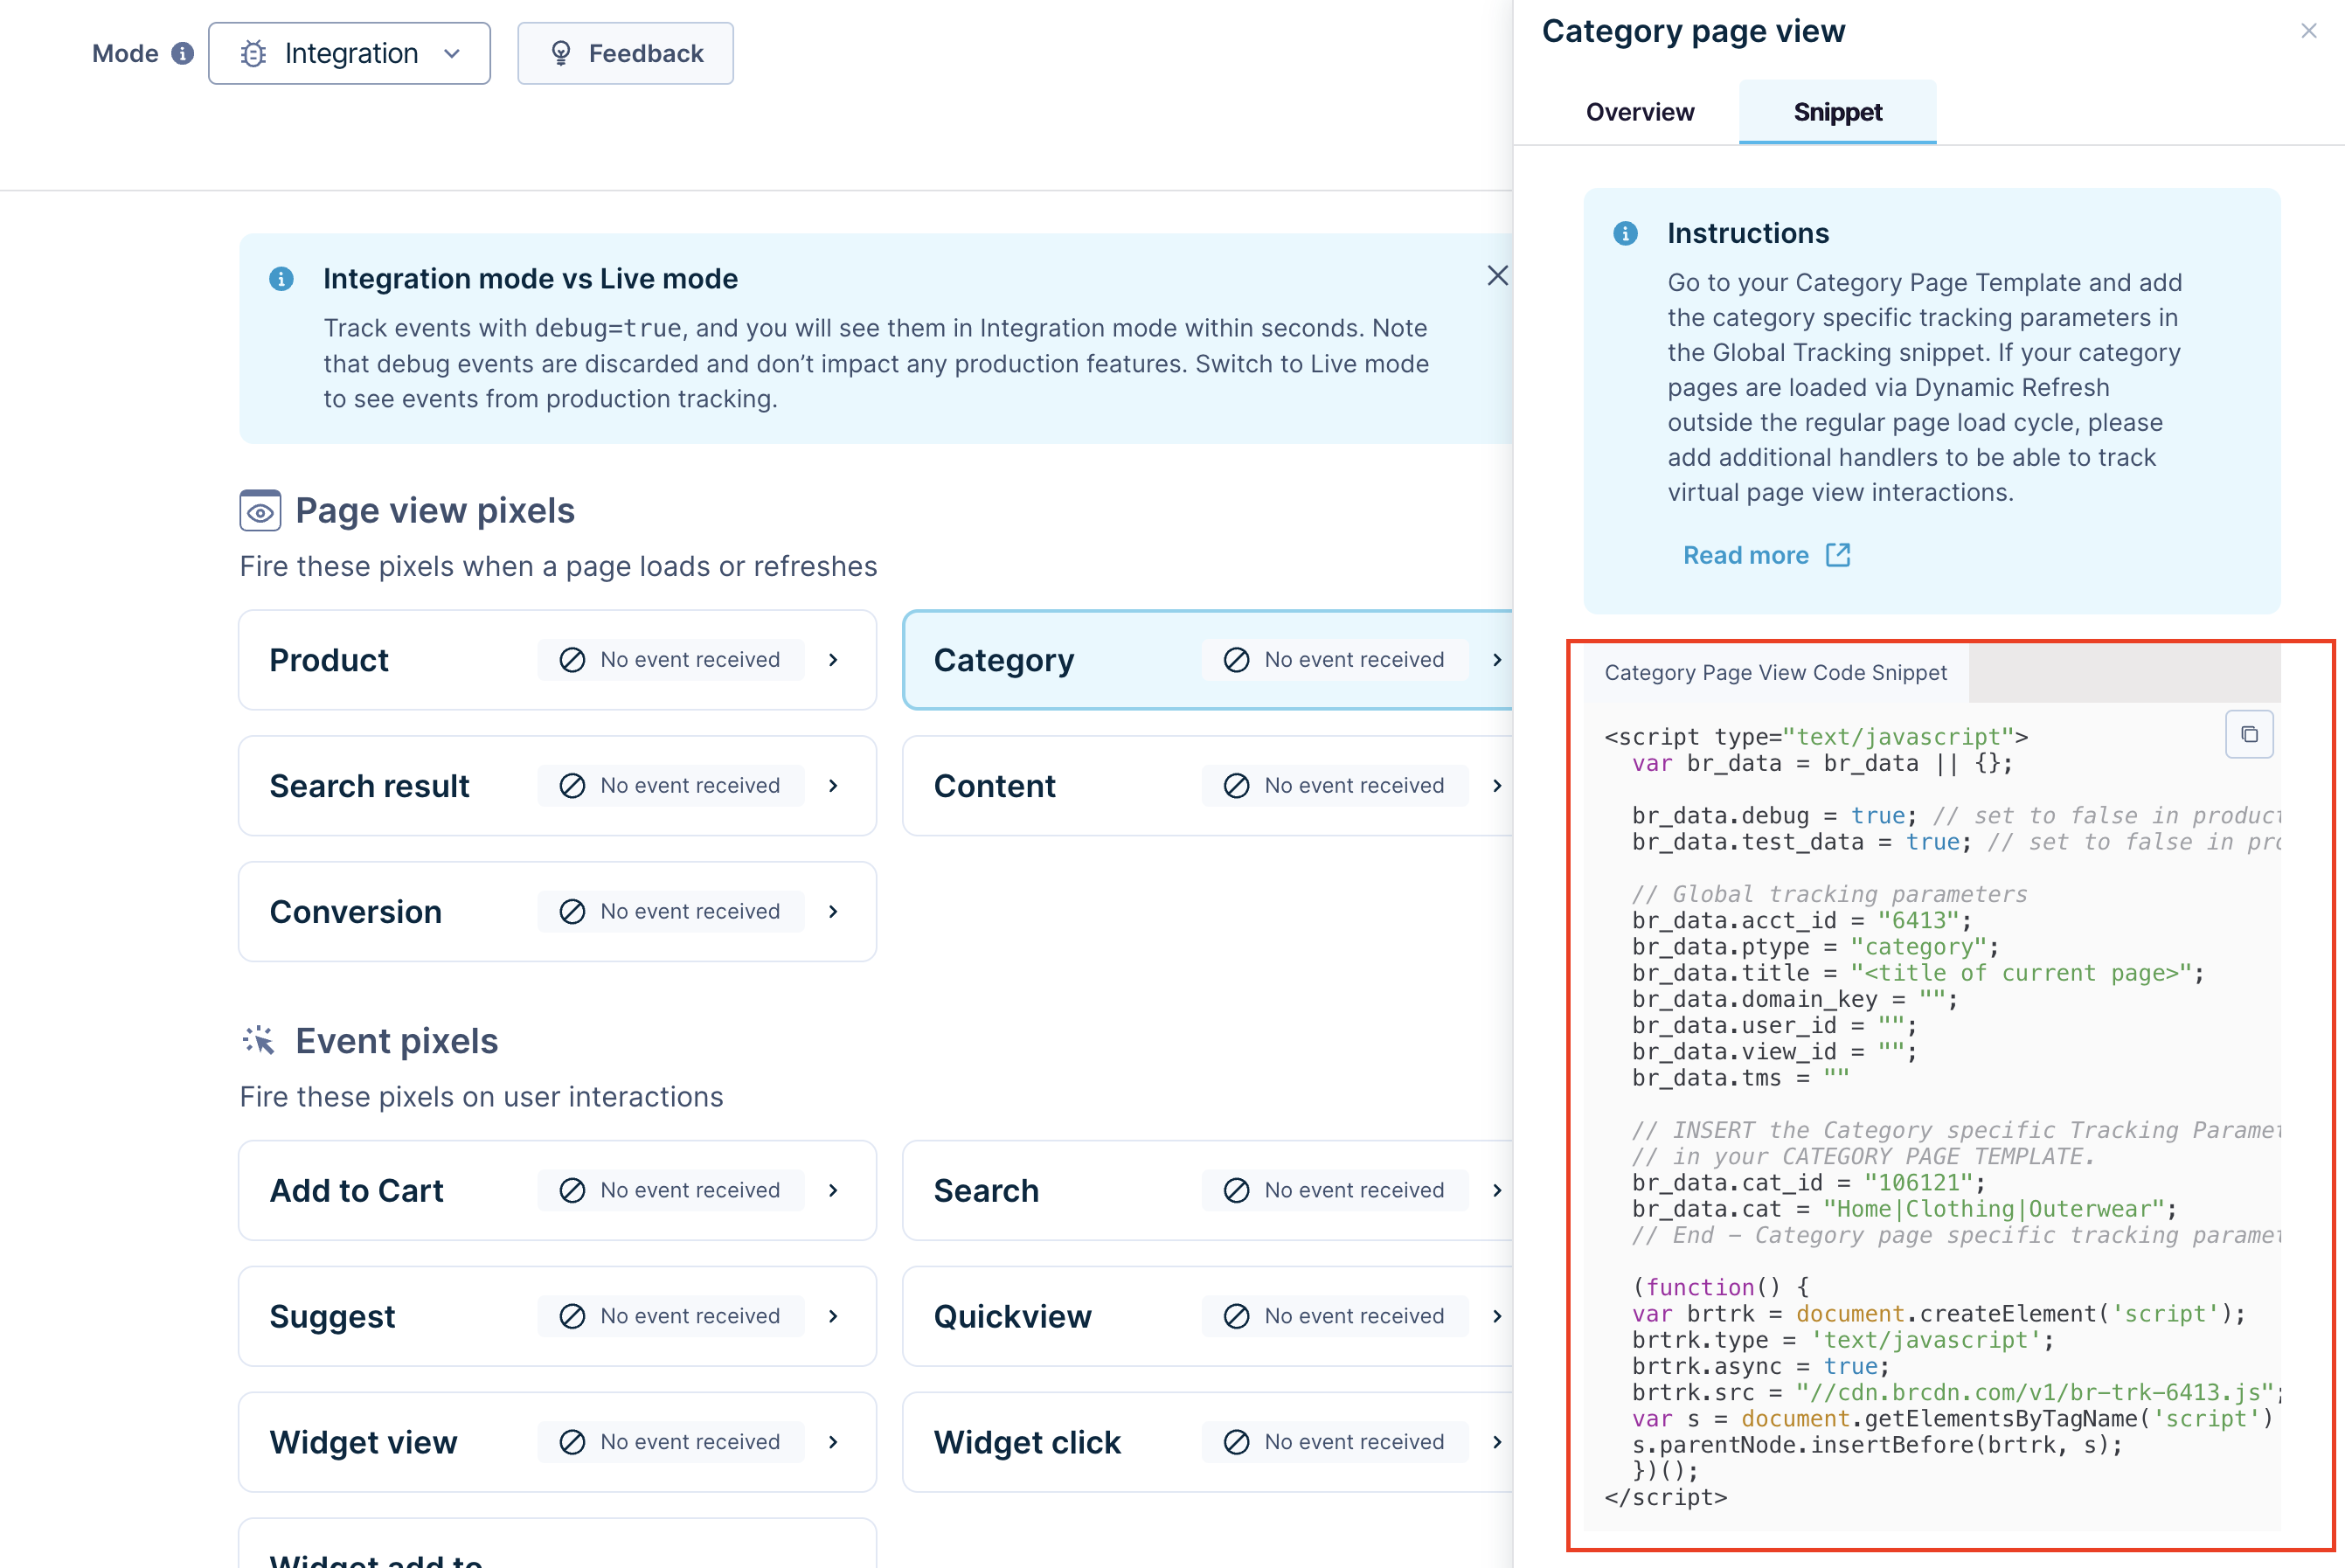
Send your events with the parameter “br_data.debug=true”. This indicates that the event is meant for debug tracking and will be available in the Integration Mode.
Non-JavaScript implementation
- Android_ SDK and iOS SDK_
Set the parameter “debugMode“ to “true“ during the initialization of the SDK. This indicates that the event is meant for debug tracking and will be available in the Integration Mode. By default, the parameter value is set to “false”. - Direct API request
When sending events through an API request, append the “debug=true” parameter to your request URL. This indicates that the event is meant for debug tracking and will be available in the Integration Mode.
https://p.brsrvr.com/pix.gif?
acct_id=6092
&debug=true
&type=pageview
&title=Blue+Lace+Dress
&url=http%3A%2F%2Fhomeoasis.bloomreach.com%2Fproduct%2Fblue%2520lace%2520dress
&ref=http%3A%2F%2Fhomeoasis.bloomreach.com%2Fcategory%2Fdresses
&ptype=search
&search_term=Blue+Lace+Dress
&sku=123-45
&domain_key=dk
&view_id=vi
&cookie2=uid%3D6448508923596%3Av%3D12.0%3Ats%3D1707916973094%3Ahc%3D4
https://p-eu.brsrvr.com/pix.gif?
acct_id=6092
&debug=true
&type=pageview
&title=Blue+Lace+Dress
&url=http%3A%2F%2Fhomeoasis.bloomreach.com%2Fproduct%2Fblue%2520lace%2520dress
&ref=http%3A%2F%2Fhomeoasis.bloomreach.com%2Fcategory%2Fdresses
&ptype=search
&search_term=Blue+Lace+Dress
&sku=123-45
&domain_key=dk
&view_id=vi
&cookie2=uid%3D6448508923596%3Av%3D12.0%3Ats%3D1707916973094%3Ahc%3D4
2. Viewing debug events in Integration mode
Go to Setup > Event diagnostics. To inspect the debug events, go to the Events Stream tab and view them within seconds.
Points to note
-
We validate the events with the “debug=true” parameter in real time and exclude them from any production features (e.g., attribution processes, search performance, analytics, insights). This ensures that you get a focused debug experience for troubleshooting and analysis.
-
Debug events have an API rate limit of a few requests per second. If the limit is exceeded, the HTTP 429 error is returned. We recommend you monitor this in your website’s Application Performance Monitoring tool (APM), such as New Relic, DataDog, Sentry, Splunk, or others.
Updated 4 months ago