

All widgets performance dashboard
What is the widgets performance dashboard?
The widgets performance overview dashboard provides statistics on how different Recommendation widgets perform and drive key business metrics like Revenue and Conversions on your site.
The dashboard displays an aggregated, interactive report of the overall performance of all the widgets on your site.
Accessing the Dashboard
The Widgets Performance Overview can be accessed inside the Bloomreach Dashboard by navigating to “Insights -> Recommendation analytics -> All widgets summary”.
Performance Metrics
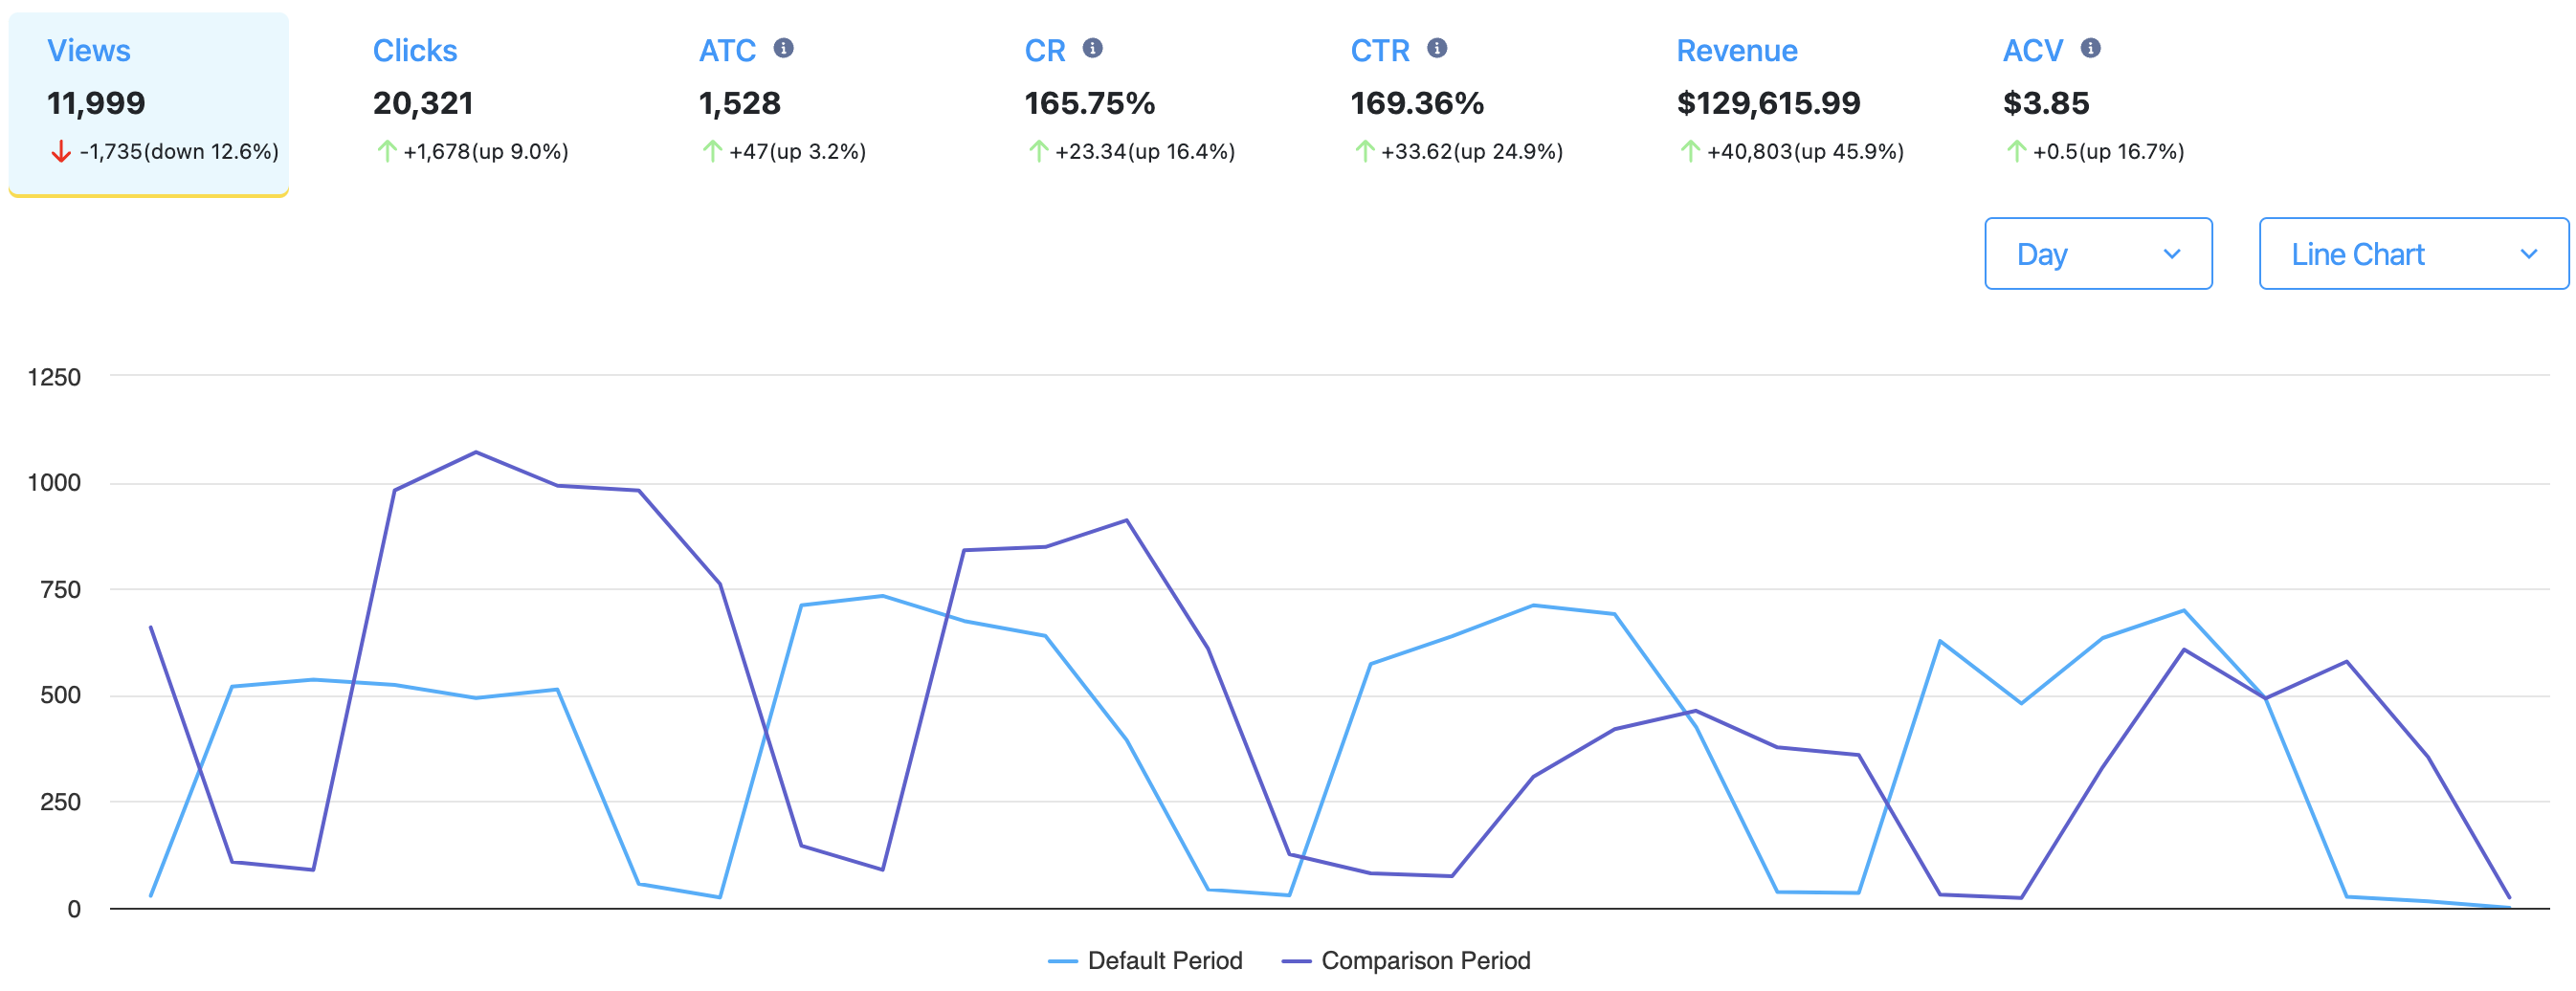
We report important metrics that help understand the performance of widgets easily.
The trends of change in the selected metric are displayed through a visual chart, where each bar/point represents the value of that metric over a time duration (day/month).
You can hover over the graph to view the exact values at different points.
The following metrics are tracked and displayed for the widgets. You can click on any of these metrics to select it and view its trends:

- Views - Number of times the widget has been viewed by shoppers
- Clicks - Number of times a shopper has clicked on a product in the widget
- ATC (Add To Carts) - Number of times shoppers have added a product(s) to the cart from the widget
- CR (Conversion Rate) - Ratio of the number of conversions from the widgets to the total clicks on the widgets (Conversions / Total clicks)
- CTR (Click Through Rate) - Ratio of the number of clicks on the widgets to the total views on the widgets (Clicks / Total views)
- Revenue - Total revenue generated by the selected widgets
- ACV (Average Conversion Value) - Ratio of the total revenue generated by the widgets to the number of conversions from the widgets (Total revenue / Conversions)
By default, these metrics are displayed for all widgets enabled for the selected account and catalog. However, you can select specific widgets/widget types using the checkboxes in the tabular view.
The table provides the metric values for different widgets and widget types separately.
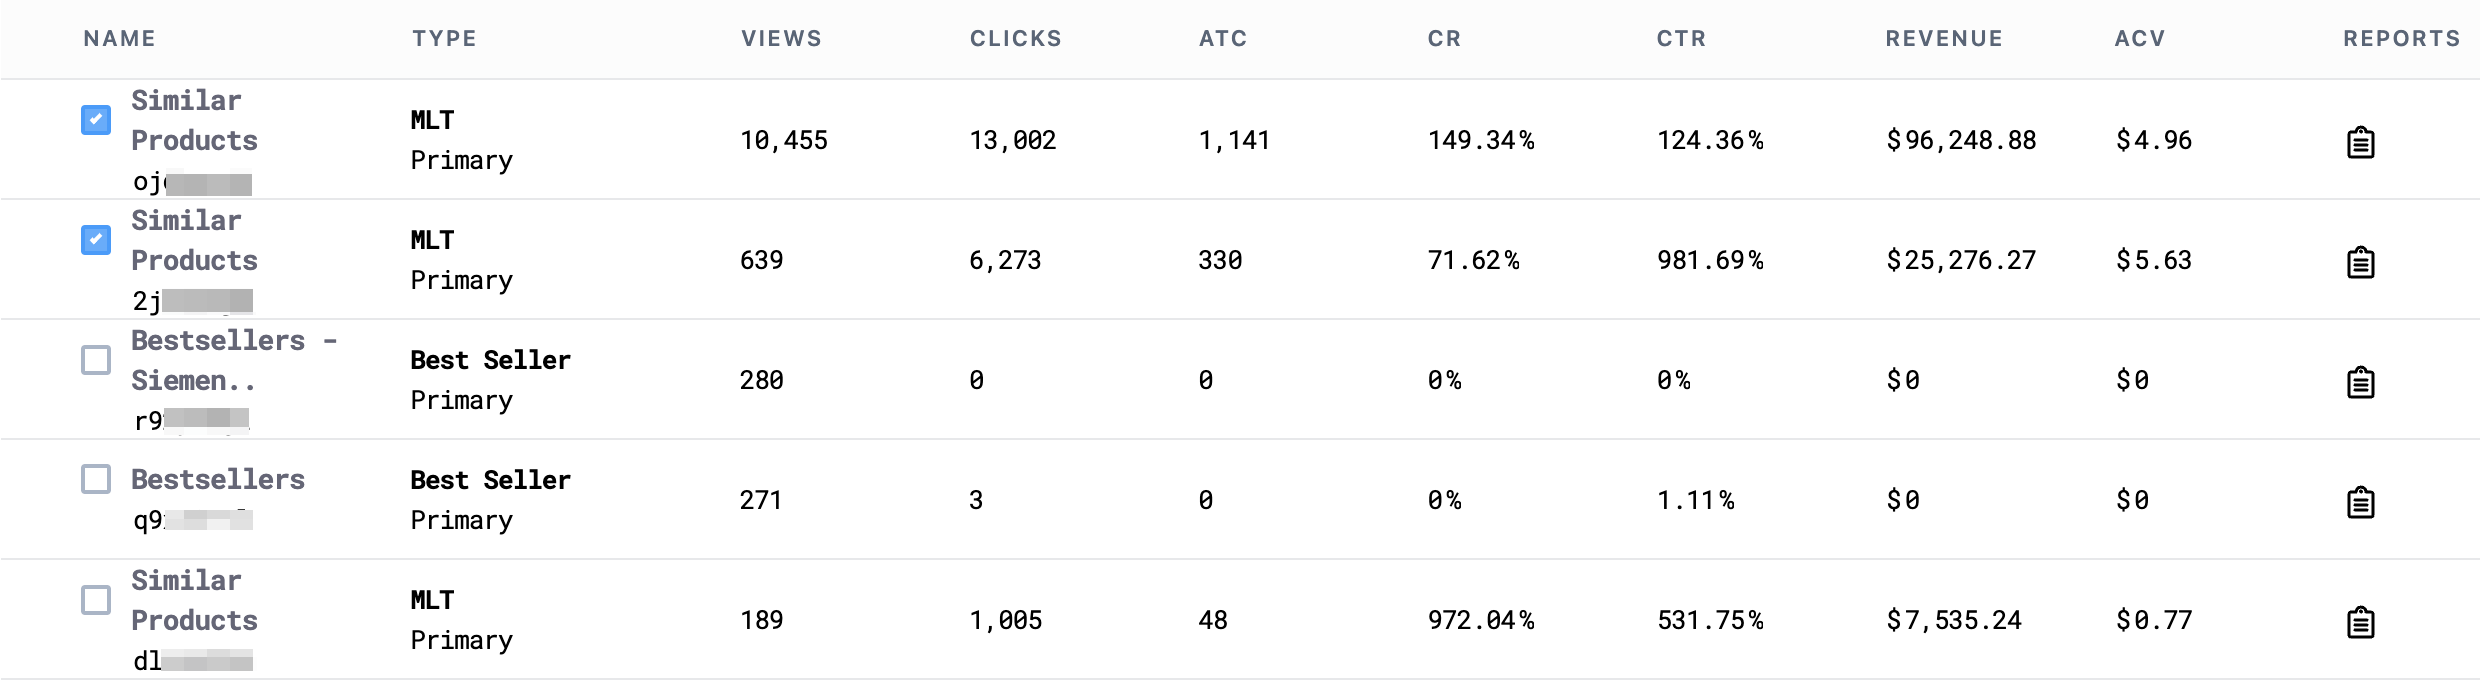
Export as CSVWe offer the option to download the All Widgets Performance report as a CSV file for local usage. Just click on the CSV button as highlighted below, to export the report:

If you see Not Available under any of the metrics in the table, your widget name might be configured incorrectly in the Pixels.
Individual Widget Performance
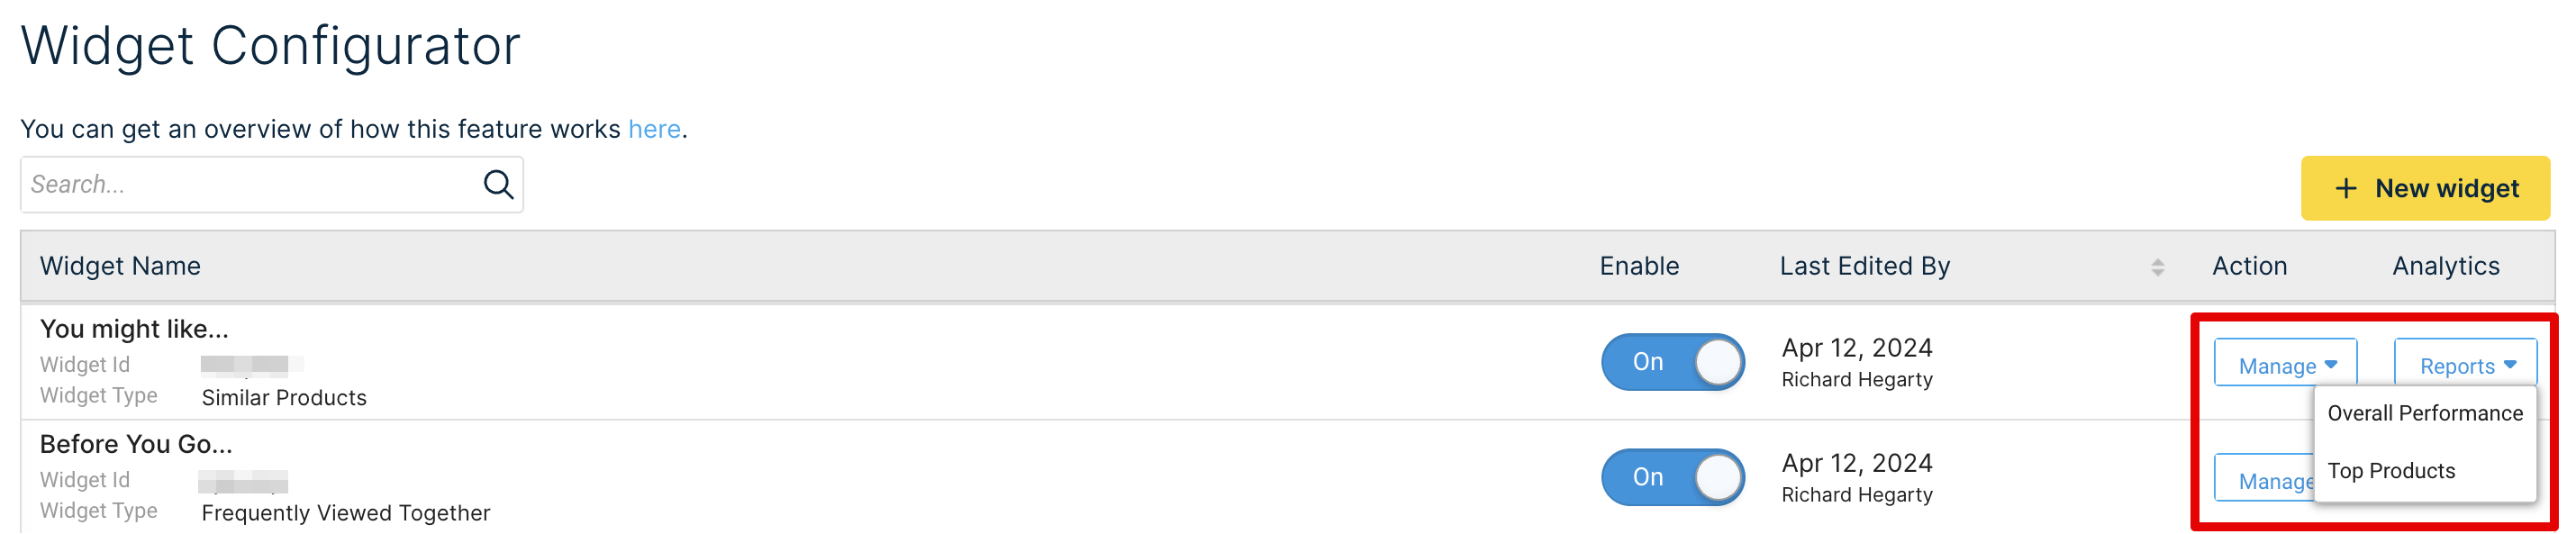
The Reports column in the table allows you to access detailed performance reports for each widget individually. There are two types of individual reports available for each widget:
- Overall Performance: Displays the trends in the overall performance of different key metrics.
- Top Products: Displays the top-performing products and their metrics from the selected widget.
You can also view the individual widget performance reports under widget analytics inside the Widget Configurator tab in your Bloomreach Dashboard.
Customizations and Filters
In addition to selecting specific widget types, you can apply other customizations and filters to modify the view or narrow down the data.
Chart Customizations
Duration
This allows you to view the data by day or month. Each bar/point represents one unit of the selected duration type.
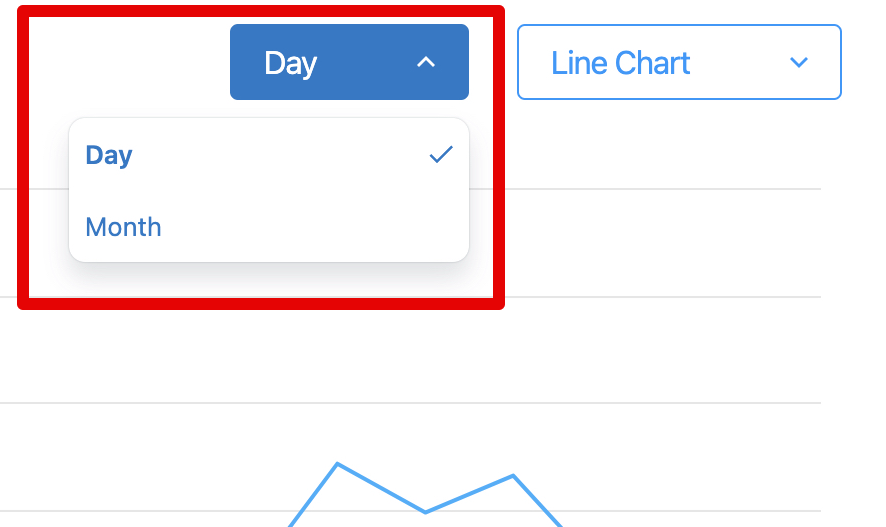
Chart Type
This setting allows you to view the data as a line chart or a bar graph.
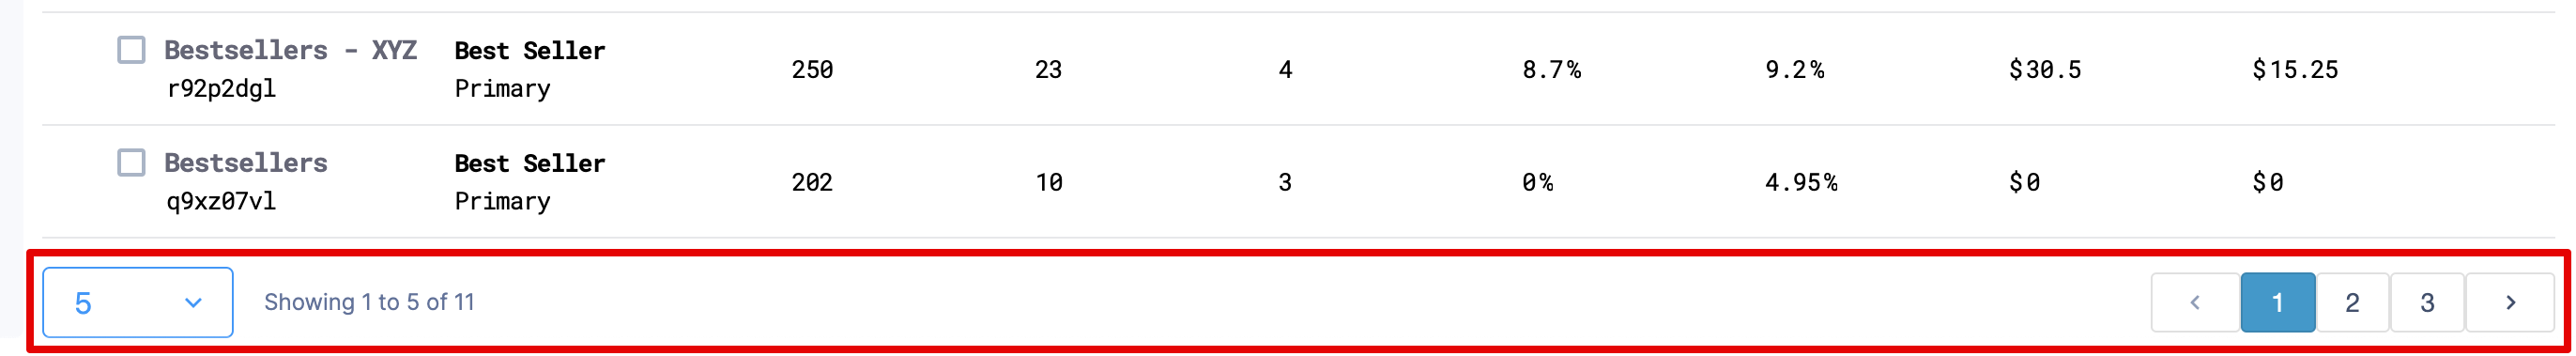
Pagination
This helps you control the number of widget items displayed on one page in the tabular data so that you can move through the pages accordingly.
Search & Filters
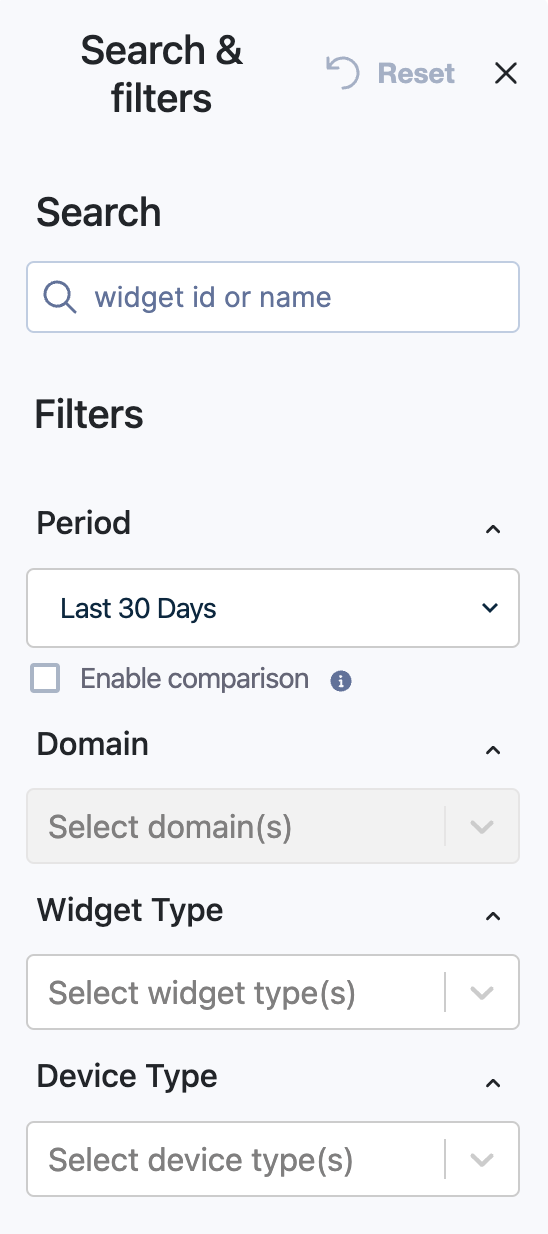
Search
The search bar allows you to find a specific widget by entering its name or Widget ID. This will only show the stats for that particular widget.
Period
This filter allows you to select the time period from which the data is derived. You can also choose to select a custom time duration through specific dates.
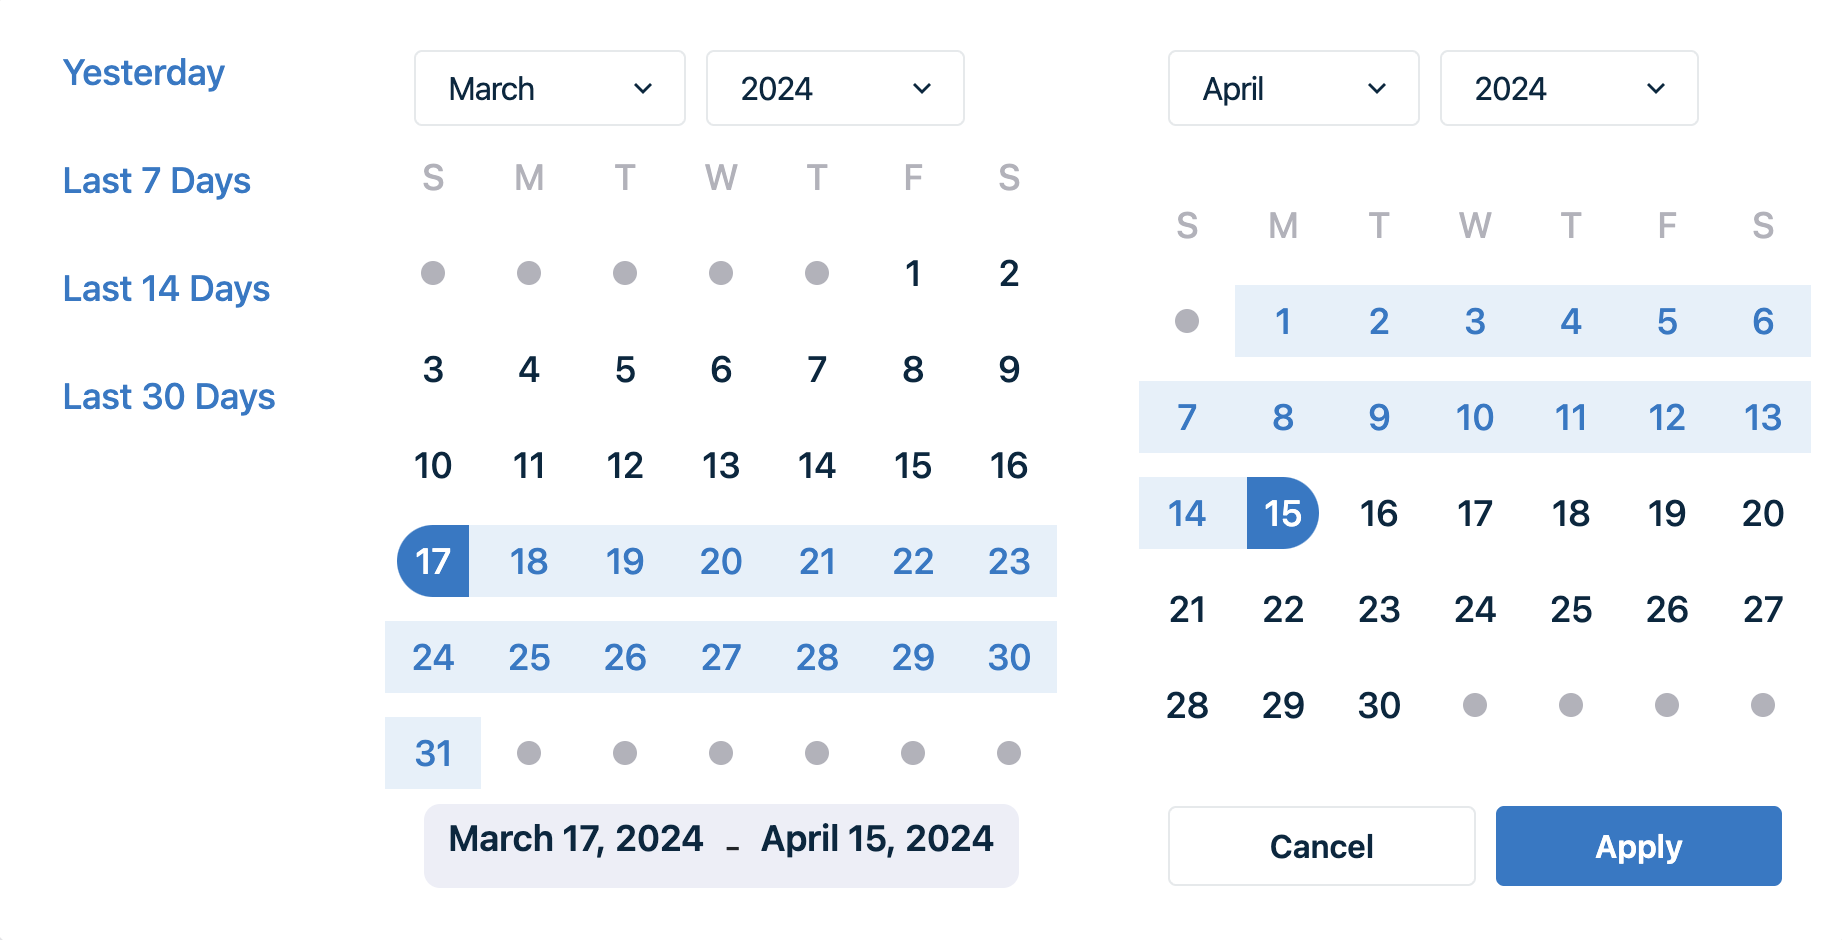
Selecting "Enable comparison" lets you compare the current data with the data from the same preceding period. For example, if you choose the time period as "Last 30 Days", and enable comparison, we will compare the data from the last 30 days and the 30 days before.
In this case, the performance metrics also display the percentage increase or decrease in the value between those two time periods.
Domain
If your site has multiple domains configured with Bloomreach, we allow you to view the data per domain. You can also select multiple domains to view their aggregated data.
Widget Performance analytics are only showed at the domain (or catalog) level, and not for the site level.
Widget Type
This lets you filter the data by particular native Bloomreach widget types. You can also select multiple widget types to view their aggregated data.
Device Type
This filter distinguishes the data collected from different channels (devices), such as mobile, tablet, desktop, etc. You also have the option to select multiple Device Types to combine the results.
Updated 6 days ago