Content Search Event alerts
💡Prerequisite Knowledge
This guide will be easier to understand if you review the following guides:
- Content Search: This guide introduces you to the Content Search feature.
- Content Page View Pixel: This guide walks you through the process of integrating pixel parameters required by Content Search.
- Event alerts: This guide explains how Event alerts work.
Content Search - Brief Overview
The Content Search feature allows you to make content searchable on your e-commerce site. With this, your customers can browse not only through products but also through content based on the same search query.
What are Content Search Event alerts?
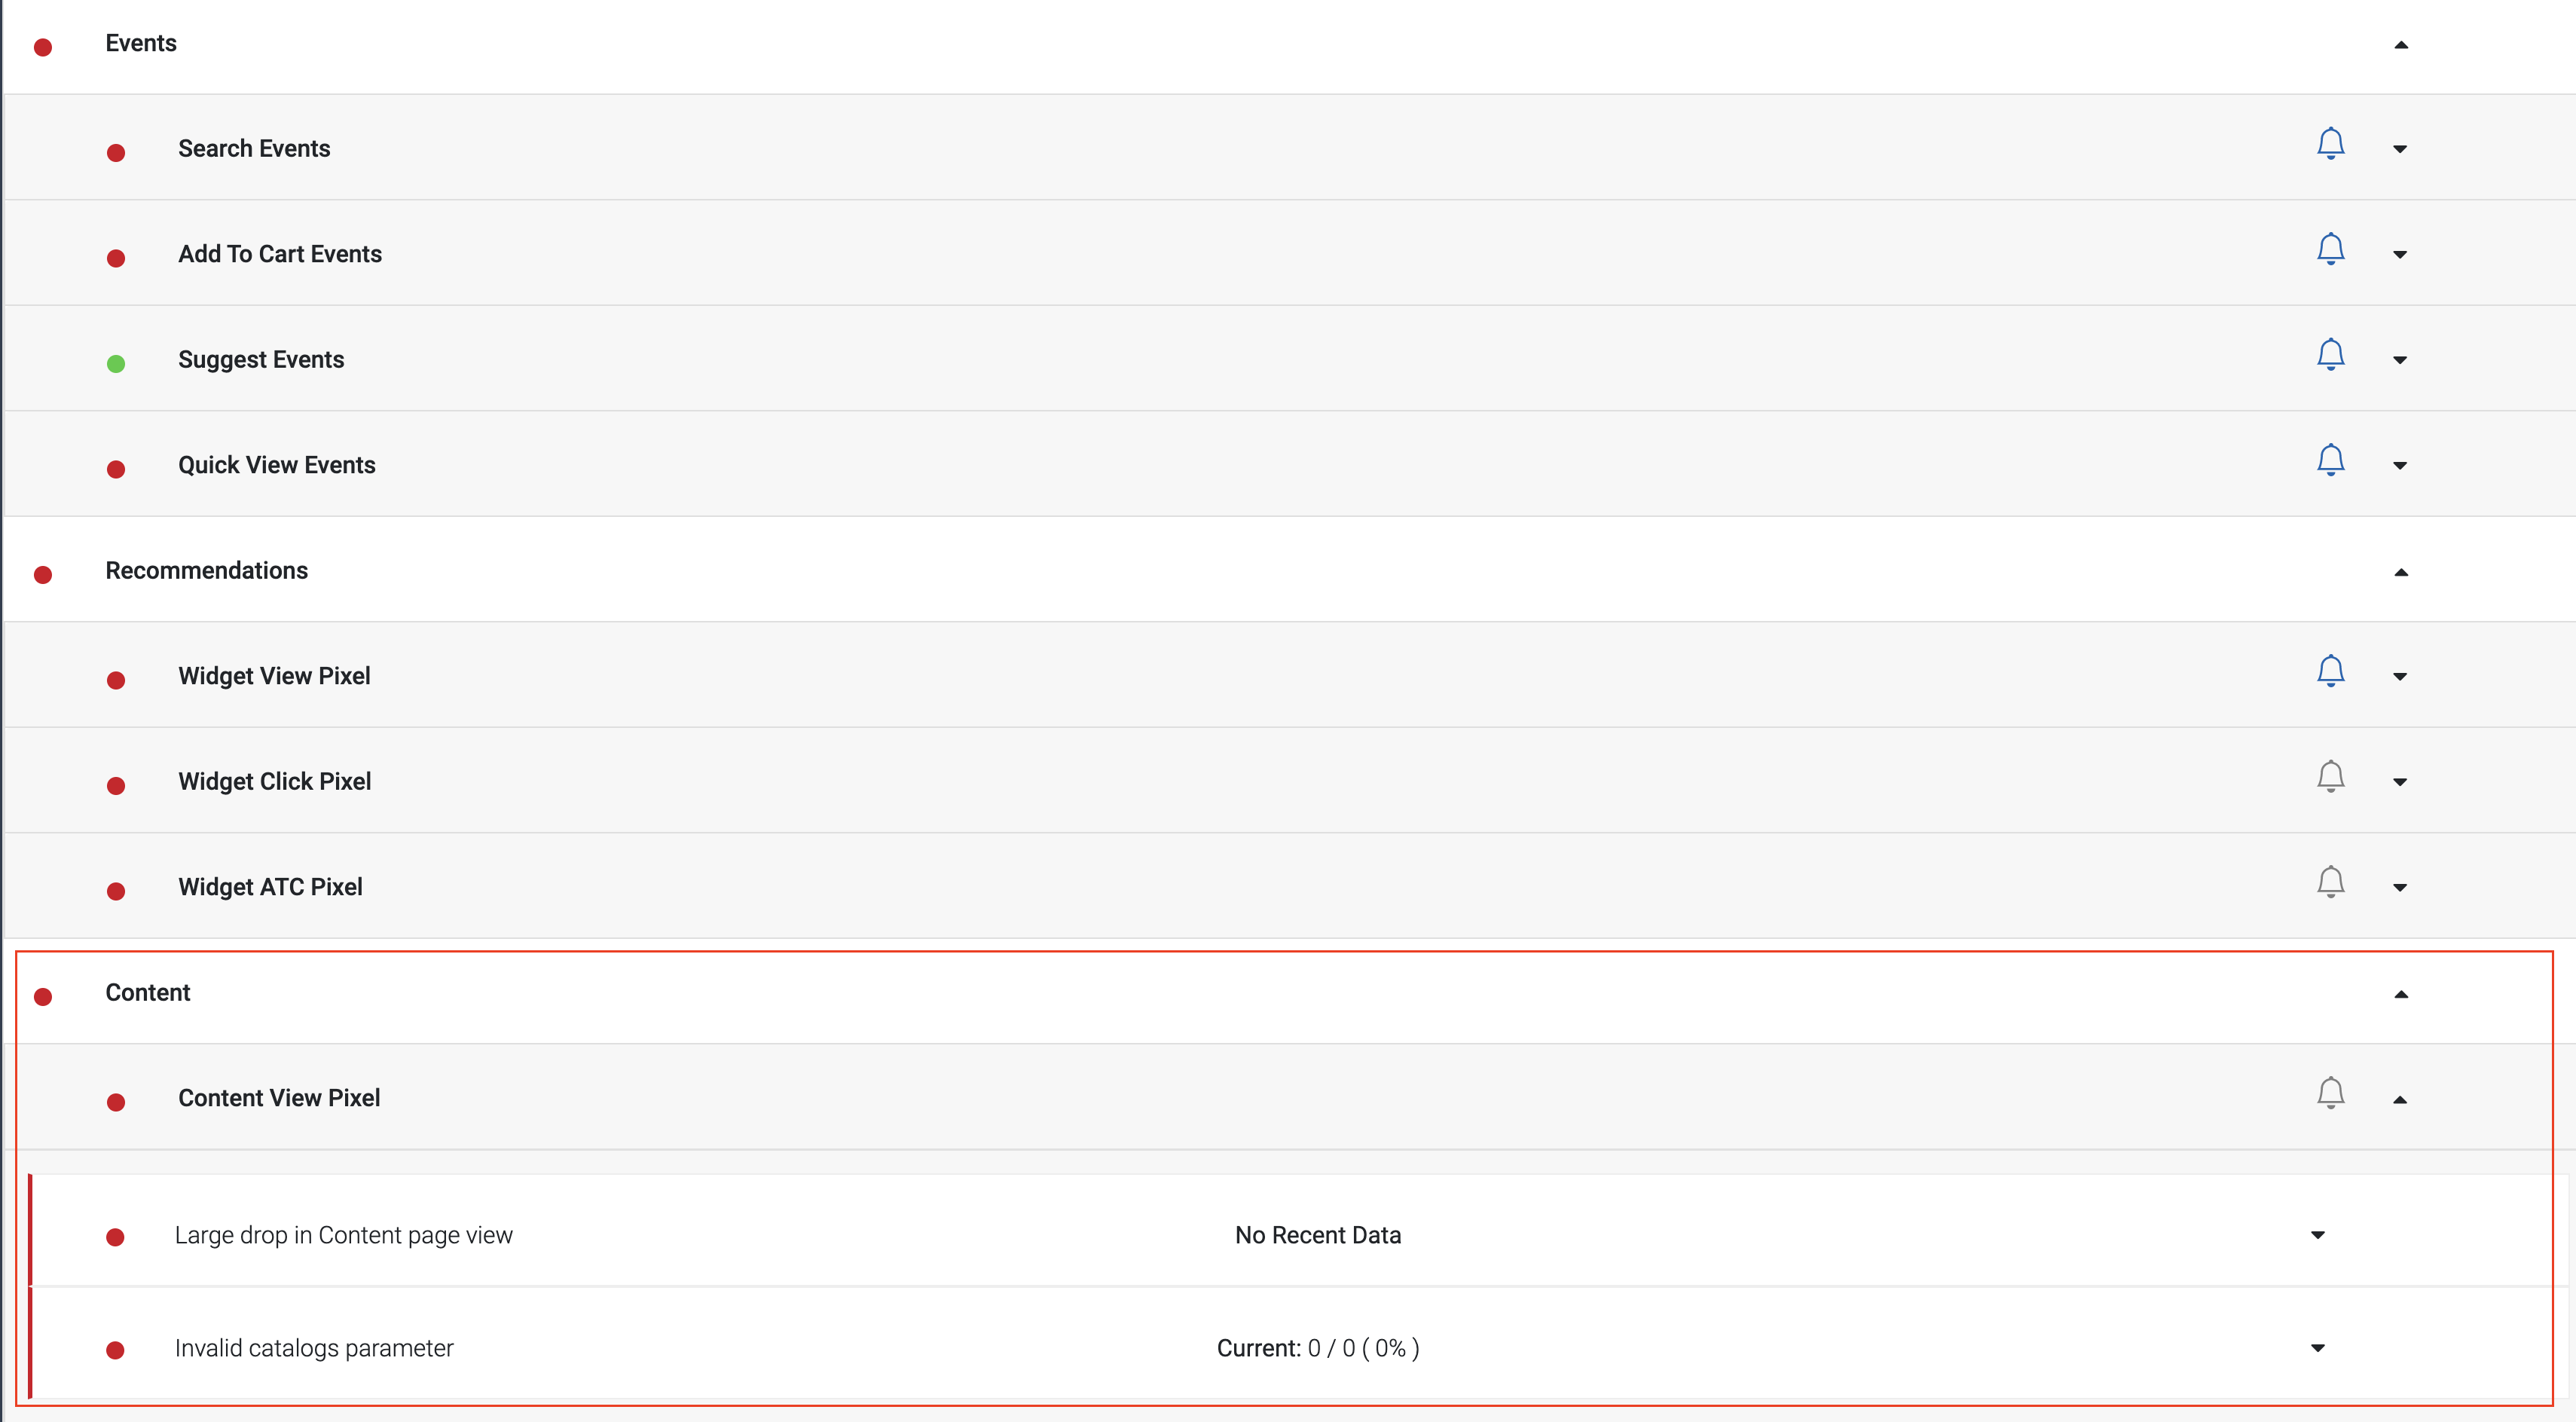
Content Search Event alerts allow you to monitor the health of Bloomreach Pixel integration required by the Content Search feature.
How can I use Content Search Event alerts?
This can be used to detect pixel integration issues and prevent the recurrence of pixel failures. You can configure alerts that are sent via email on a daily or weekly basis about any pixel issues that may arise.
Where can I view Content Search pixel issues?
The navigation path is as follows:
- Setup > Event alerts.
- Scroll down to see the Content header for Content Search pixel alerts.

Diagnosing and Debugging Pixel Issues
For Content Search, you can come across the following alerts:
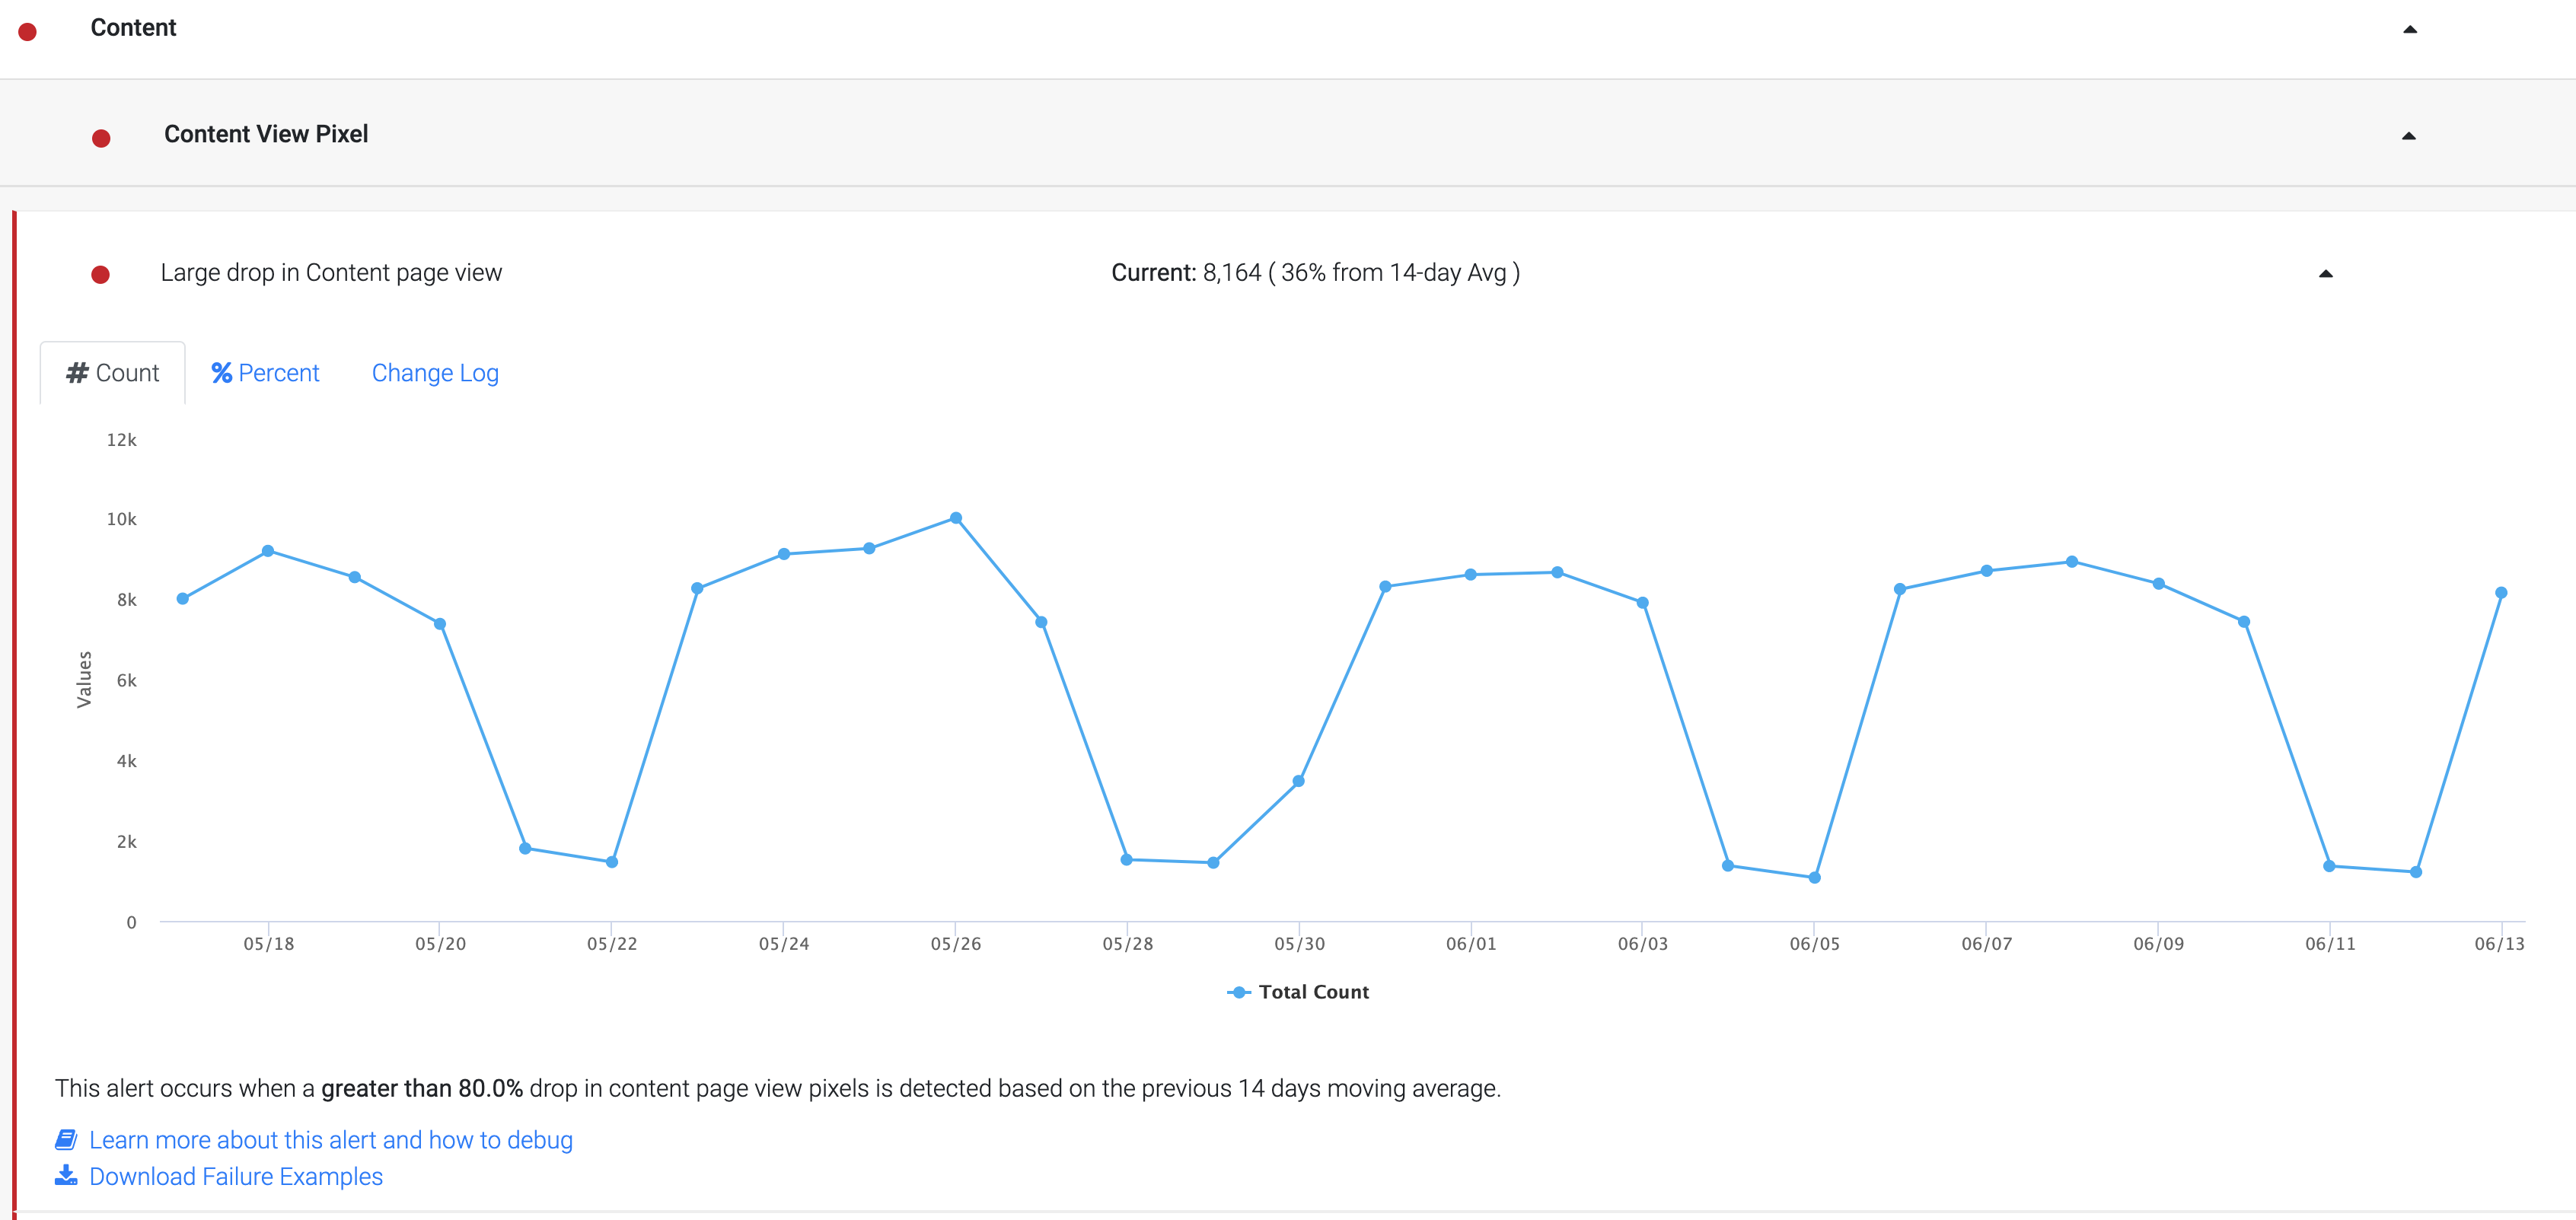
Large drop in Content page view

When this alert occurs: This Traffic Monitor compares the average number of page views over the past 14 days of a particular page type (e.g. Product Page, Category Page, etc) and alerts when there is more than 80% drop in page views.
Root Cause and Debugging
To debug this traffic alert, it is important to understand the source of the drop in page views. In some instances, your site might have fewer views or conversions on that day, so you should verify with your in-house analytics system if this is the case.
If your site does not have a significant drop in visits for that day, you can go into the next level of debugging other potential root causes.
➡️ The Bloomreach Pixel dropped on all Pages
Root Cause: Traffic Drop shows for a particular Page Type only
Debugging Steps
If you can confirm that the Bloomreach Pixel no longer fires:
- Make sure that the Pixel is still integrated.
- If the Pixel is still integrated but does not fire, check if there is an error that prevents the Bloomreach Pixel from firing (e.g. a script or other 3rd party pixel errors out before the Bloomreach pixel can fire).
➡️ The Bloomreach Pixel dropped on Top Traffic Pages
Root Cause: The ptype parameter in the Page View pixel has changed
Debugging Steps :
The Bloomreach Pixel expects a ptype parameter for each page type. Valid Page types are 'product', 'category', 'search' or 'thematic' or ‘content’. If there is no classification, the ptype will default to an 'other' page type.
For a detailed list of ptype classifications, please refer to the Global Page View Tracking section in the Bloomreach Pixel Specification.
The alert may indicate that a ptype classification has changed. E.g, a catalog page, which was previously classified with ptype 'catalog' and now shows a ptype 'other'.
➡️ The Drop is caused by Weekend Fluctuations
Root Cause: Weekend Fluctuations
Debugging Guidelines
This happens especially on B2B sites where the traffic on weekends drops significantly. If you observe this as a regular pattern, please ignore this alert.
➡️ The Drop is caused by Testing
Root Cause: Fluctuations caused by Testing
Debugging Guidelines
- A Drop & Spike pattern can happen if you perform load or stress tests on your site and the test IP is not blocklisted on the Bloomreach analytics system.
- Let your Bloomreach Integrations Project Manager know about any IPs that you are using for Load and Performance testing on your production site, so they can be blocklisted from Event alerts.
If none of the above root causes explain the issue, please contact your Bloomreach Integrations Project Manager (during an integration) or your Customer Success Manager (post-integration).
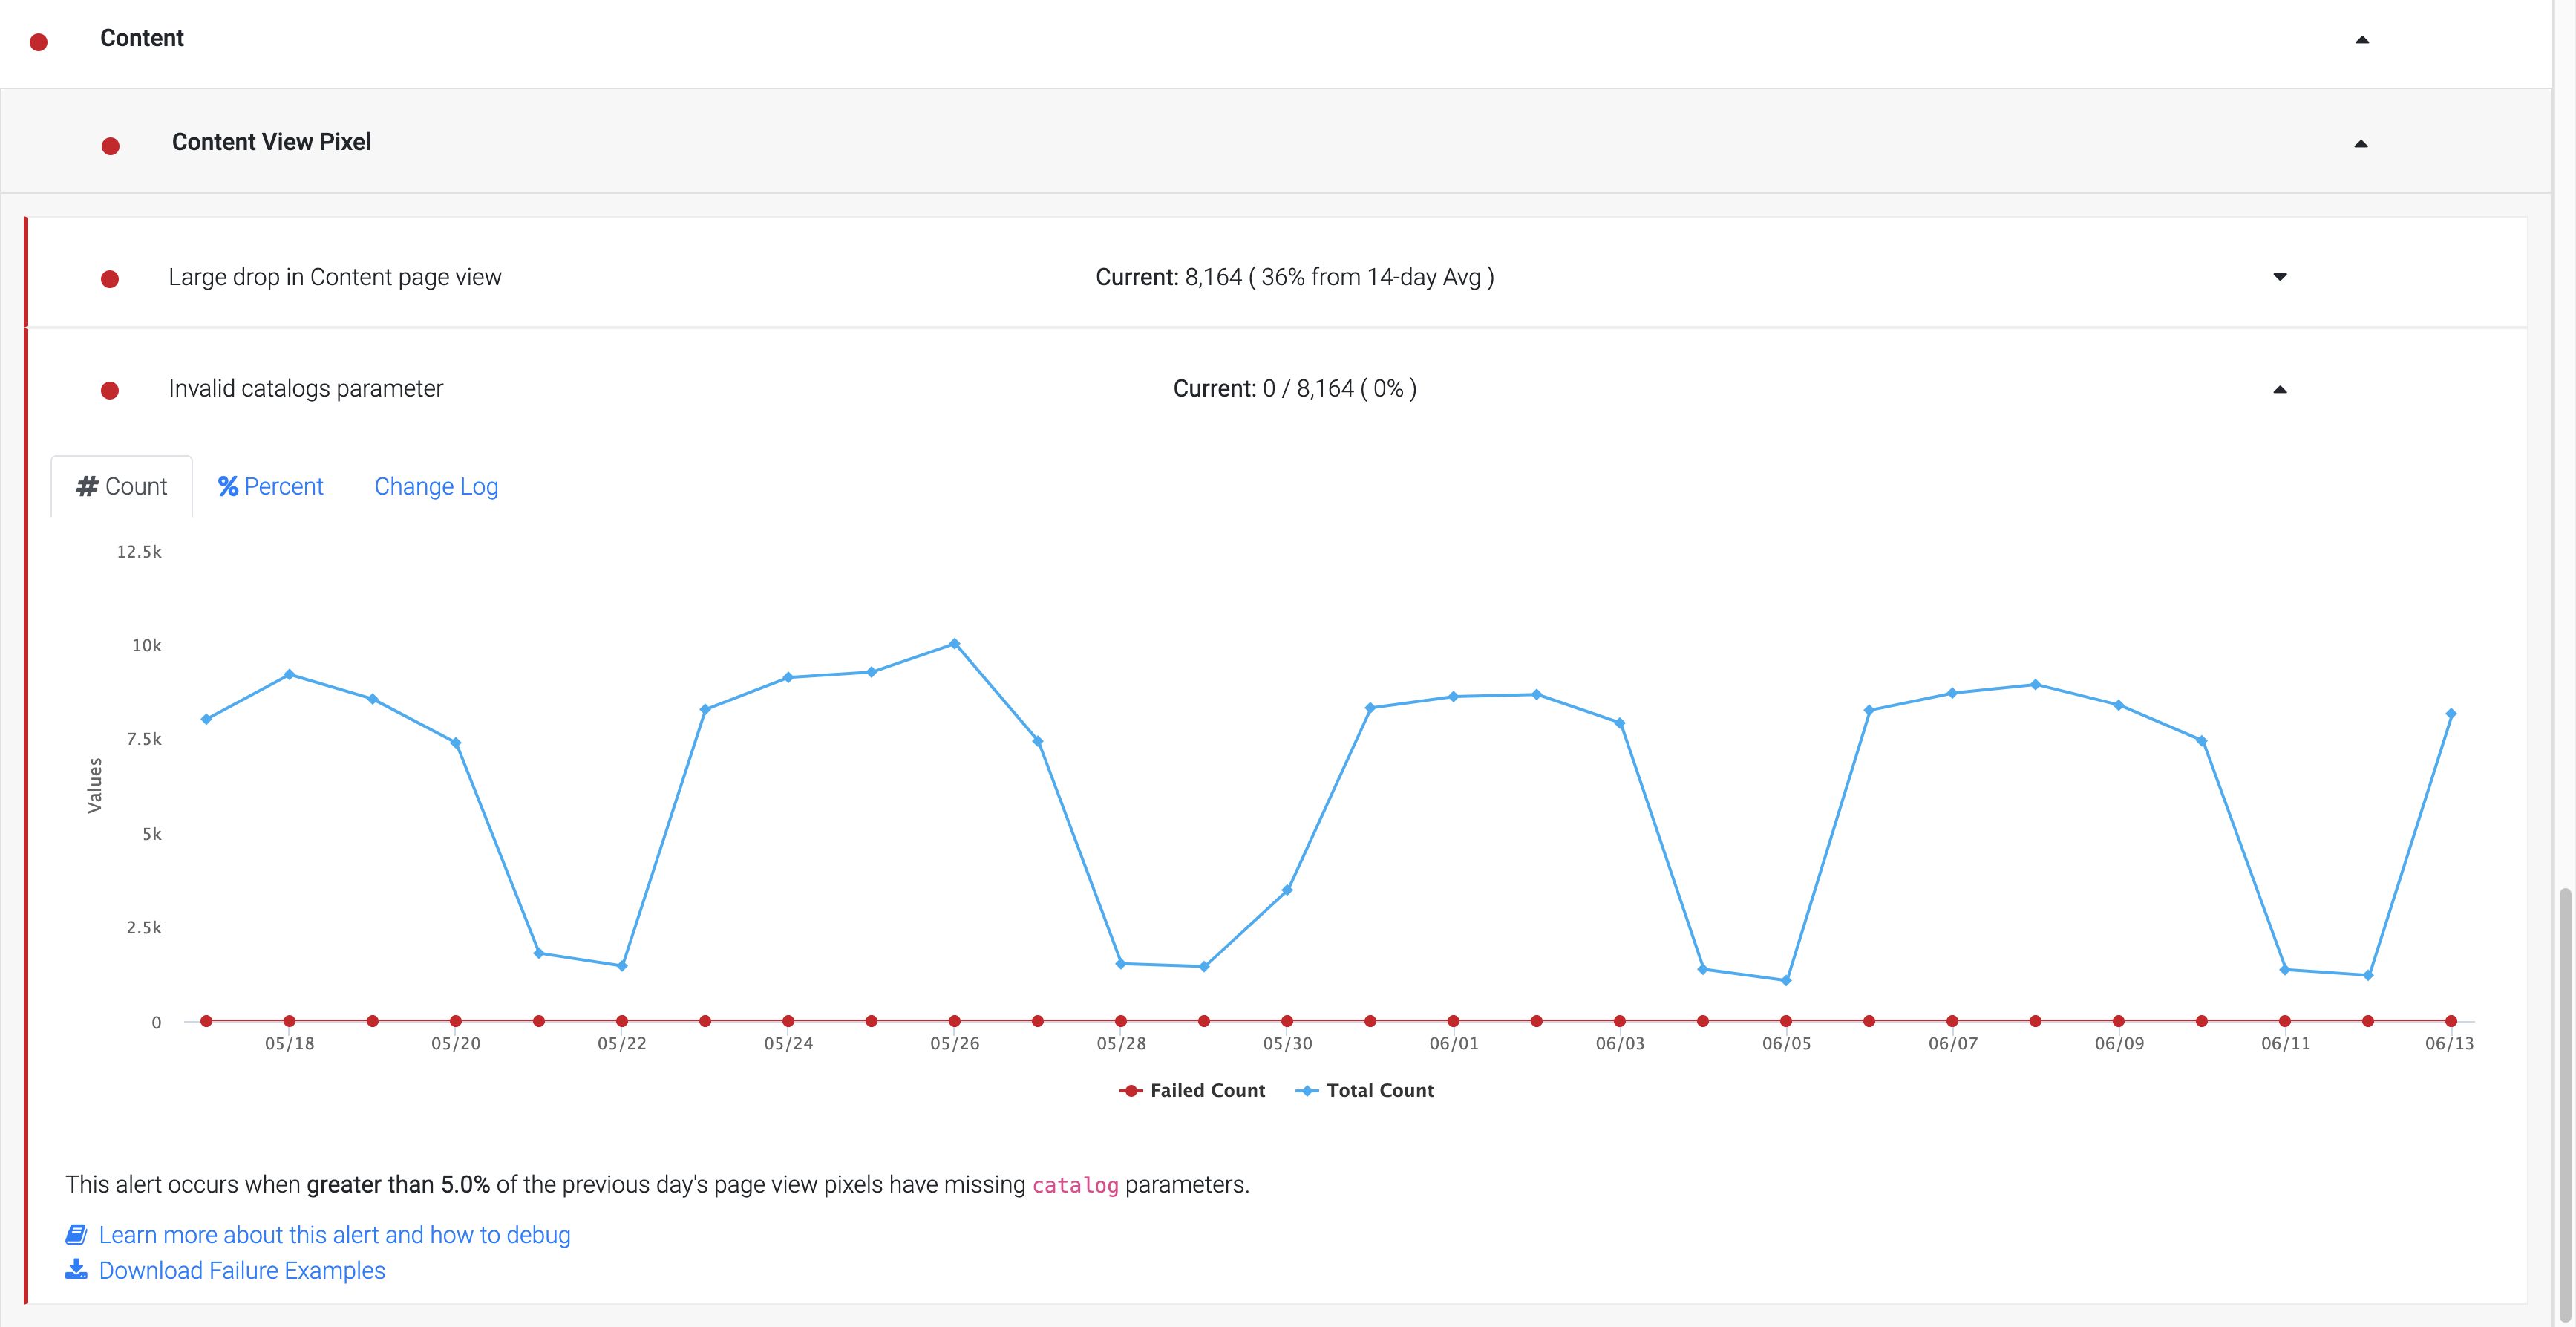
Invalid Catalog Parameter

When this alert occurs: When greater than 5% (default threshold) of the previous day's page view/event pixels have an invalid catalog parameter.
Potential Reason: An invalid catalog parameter could be because of a missing catalog parameter, an empty string sent as a catalog parameter or an invalid parameter.
Debugging Guidelines
Step 1: Download the failure example by clicking the Download Failure Examples link below the Alert Graph.

Step 2: The Failure Examples file shows URLs that fire an event without a valid customer_profile.
Start out by sorting the debug file by device_type and see if the catalog_parameter is missing on a specific device type.
Test each or a subset of URLs from the URL column and see if the catalog_parameter is missing or sent as an empty string.
For additional guidance on what should be sent as catalog_parameter, check the Content Page View in the Bloomreach Pixel Guide.
Updated about 1 month ago
