

Event diagnostics
What is Event diagnostics
Event diagnostics application streamlines the pixel integration process with real-time insights and provides you greater control over the event tracking on your site. It lets you instantly gauge whether your pixel implementation works as expected.
As you integrate and optimize your site’s pixel, Event diagnostics is your go-to tool to ensure that the data driving your AI-powered recommendations, search results, and analytics is correct and complete.
How is Event diagnostics valuable
- Seamless Pixel Implementation: Event diagnostics supports your pixel implementation by providing detailed event data in an instant. Such transparency ensures that the implementation is fast, accurate, and friction-free.
- Control and debug events in real-time: Event diagnostics is a power-packed utility tool that allows you to investigate the details of individual events, load and test events, control events from local, staging, and production environments, and debug live site events in real-time.
How to view events
Prerequisites
Ensure the Users admin grants you the 'Events viewer' role. This role provides you access to open and utilize the Event diagnostics application. Once the role has been assigned, the Event diagnostics application should become available under the Setup menu category:
1. Navigation
Go to Setup > Event diagnostics.
2.1) Mode
The Event diagnostics app features two unique working modes - Integration and Live. These cater to the different stages of your pixel integration lifecycle. With these, you can flexibly test and monitor your event tracking before and after going Live. We retain data up to the last 30 days in both modes.
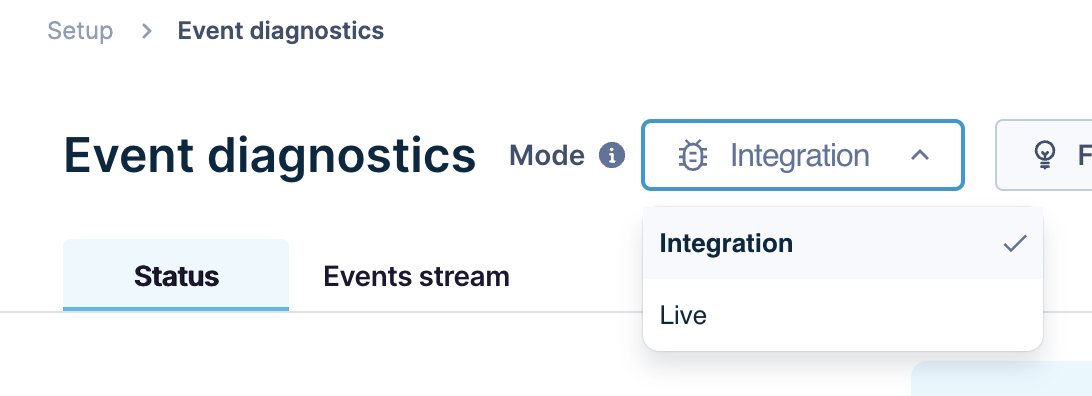
Use the dropdown provided to toggle between the available modes.
Integration mode
-
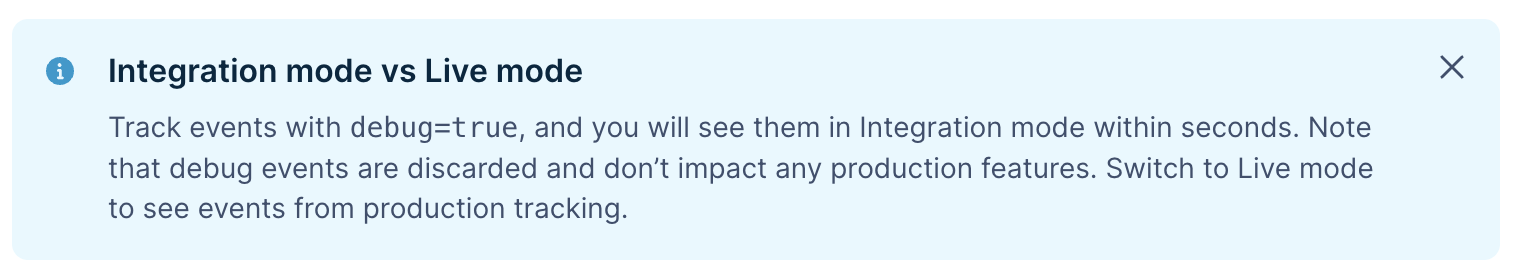
Purpose: This mode serves as your testing ground to debug and validate events instantly. It allows you to view the specific events with the debug flag set to “true.” These events are available to view in seconds but will be discarded and will not impact any production features.
-
When to use this mode: During the initial setup, when implementing new pixel types or making changes to your tracking.
NoteFollow this guide to learn how you can send and track debug events in Integration mode.
Live mode
- Purpose: This mode allows you to monitor and troubleshoot Live events in your production environment. Due to the large volume of events being processed every hour, it generally takes up to 2 hours to view these events.
- When to use this mode: Ready to go live or already running live.
2.2) Period
This sets the timeframe to view events and issues.
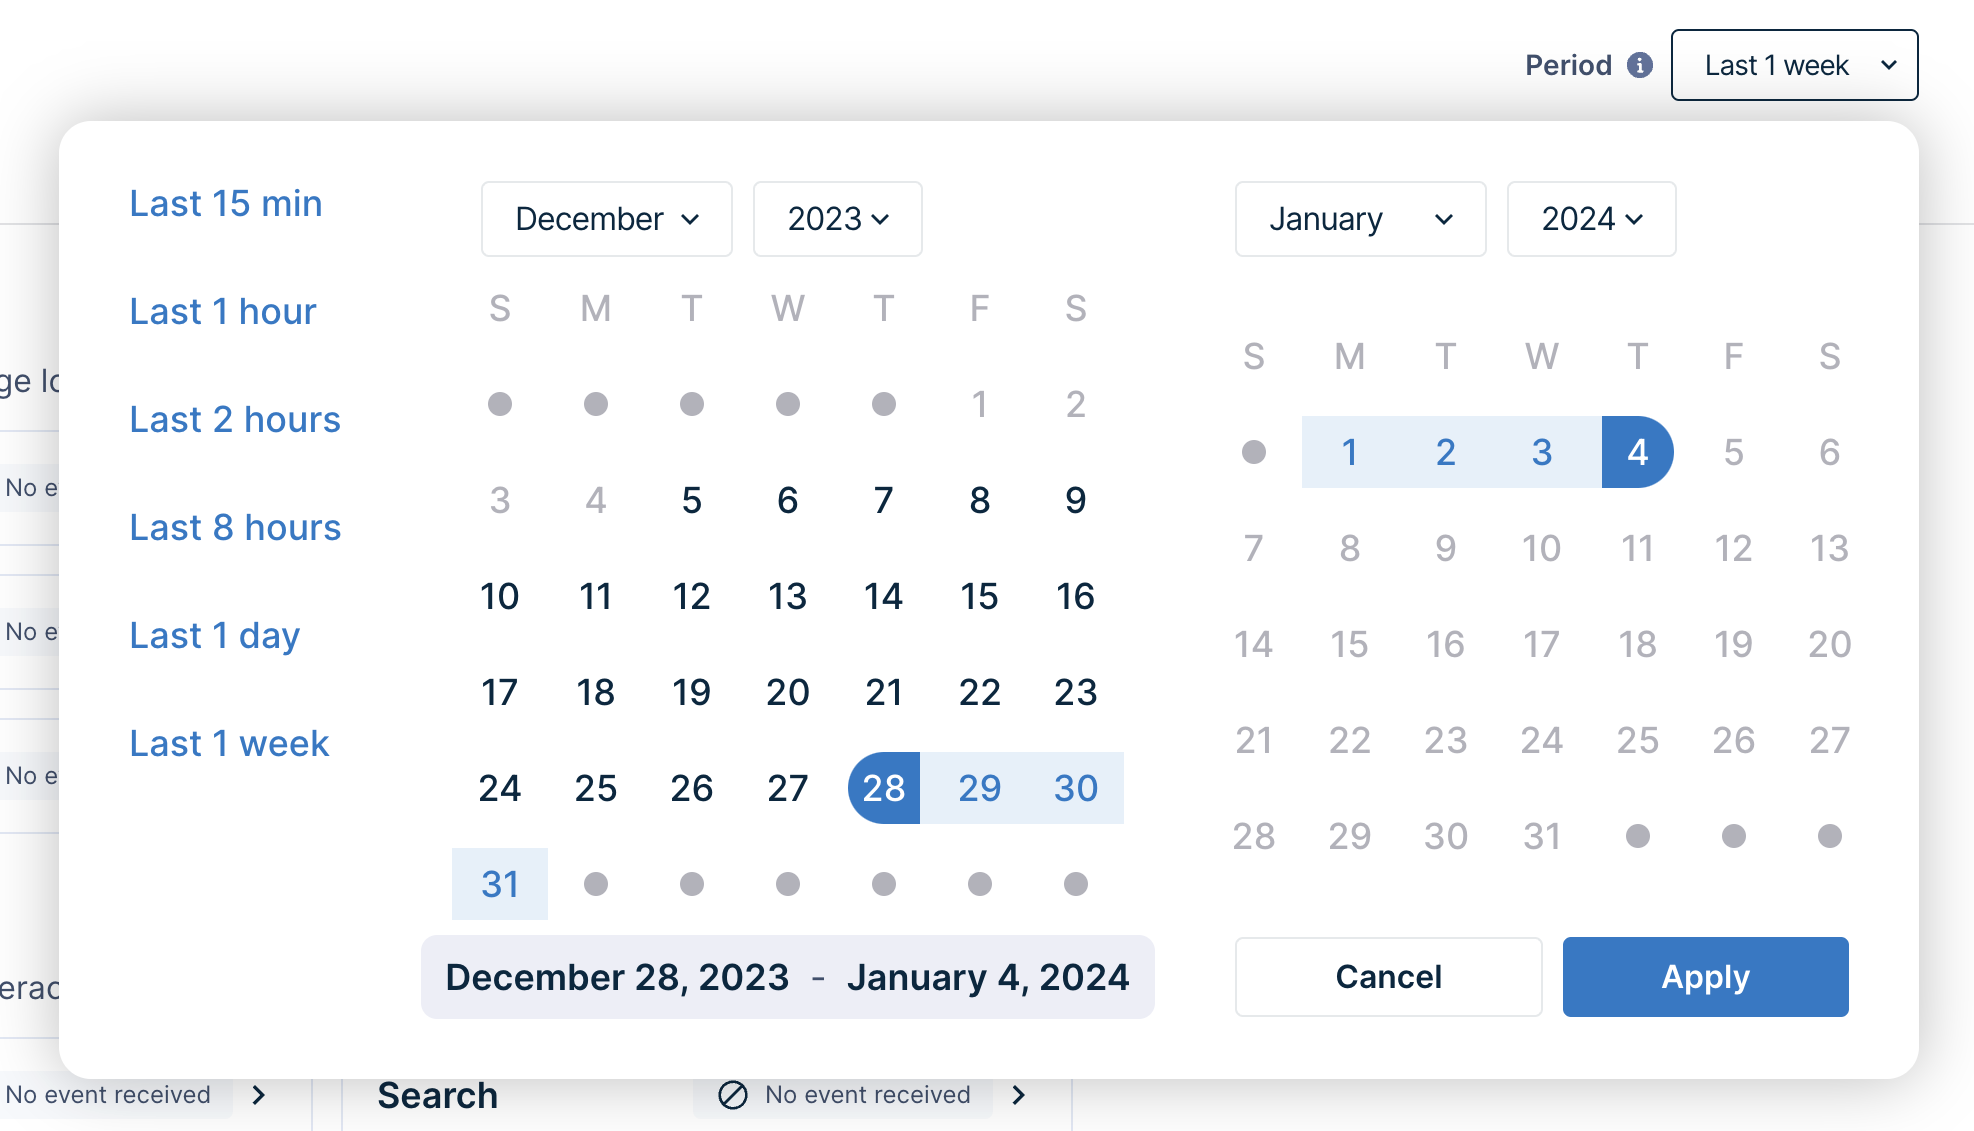
Please note that the Mode and the Period specified in this step will impact the data displayed in the tabs discussed below.
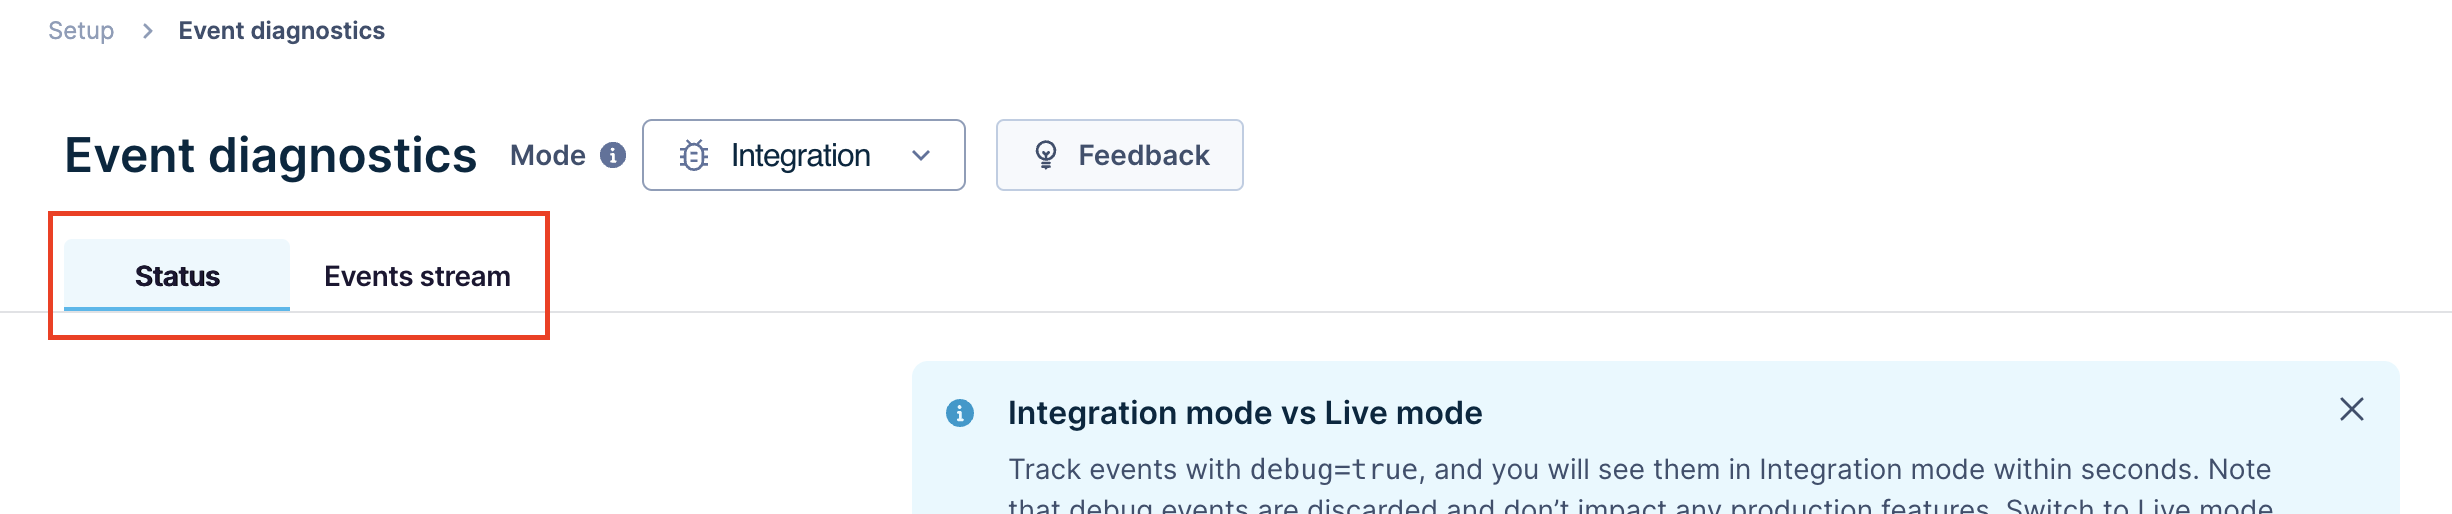
3. View data under the Status and Events stream tabs
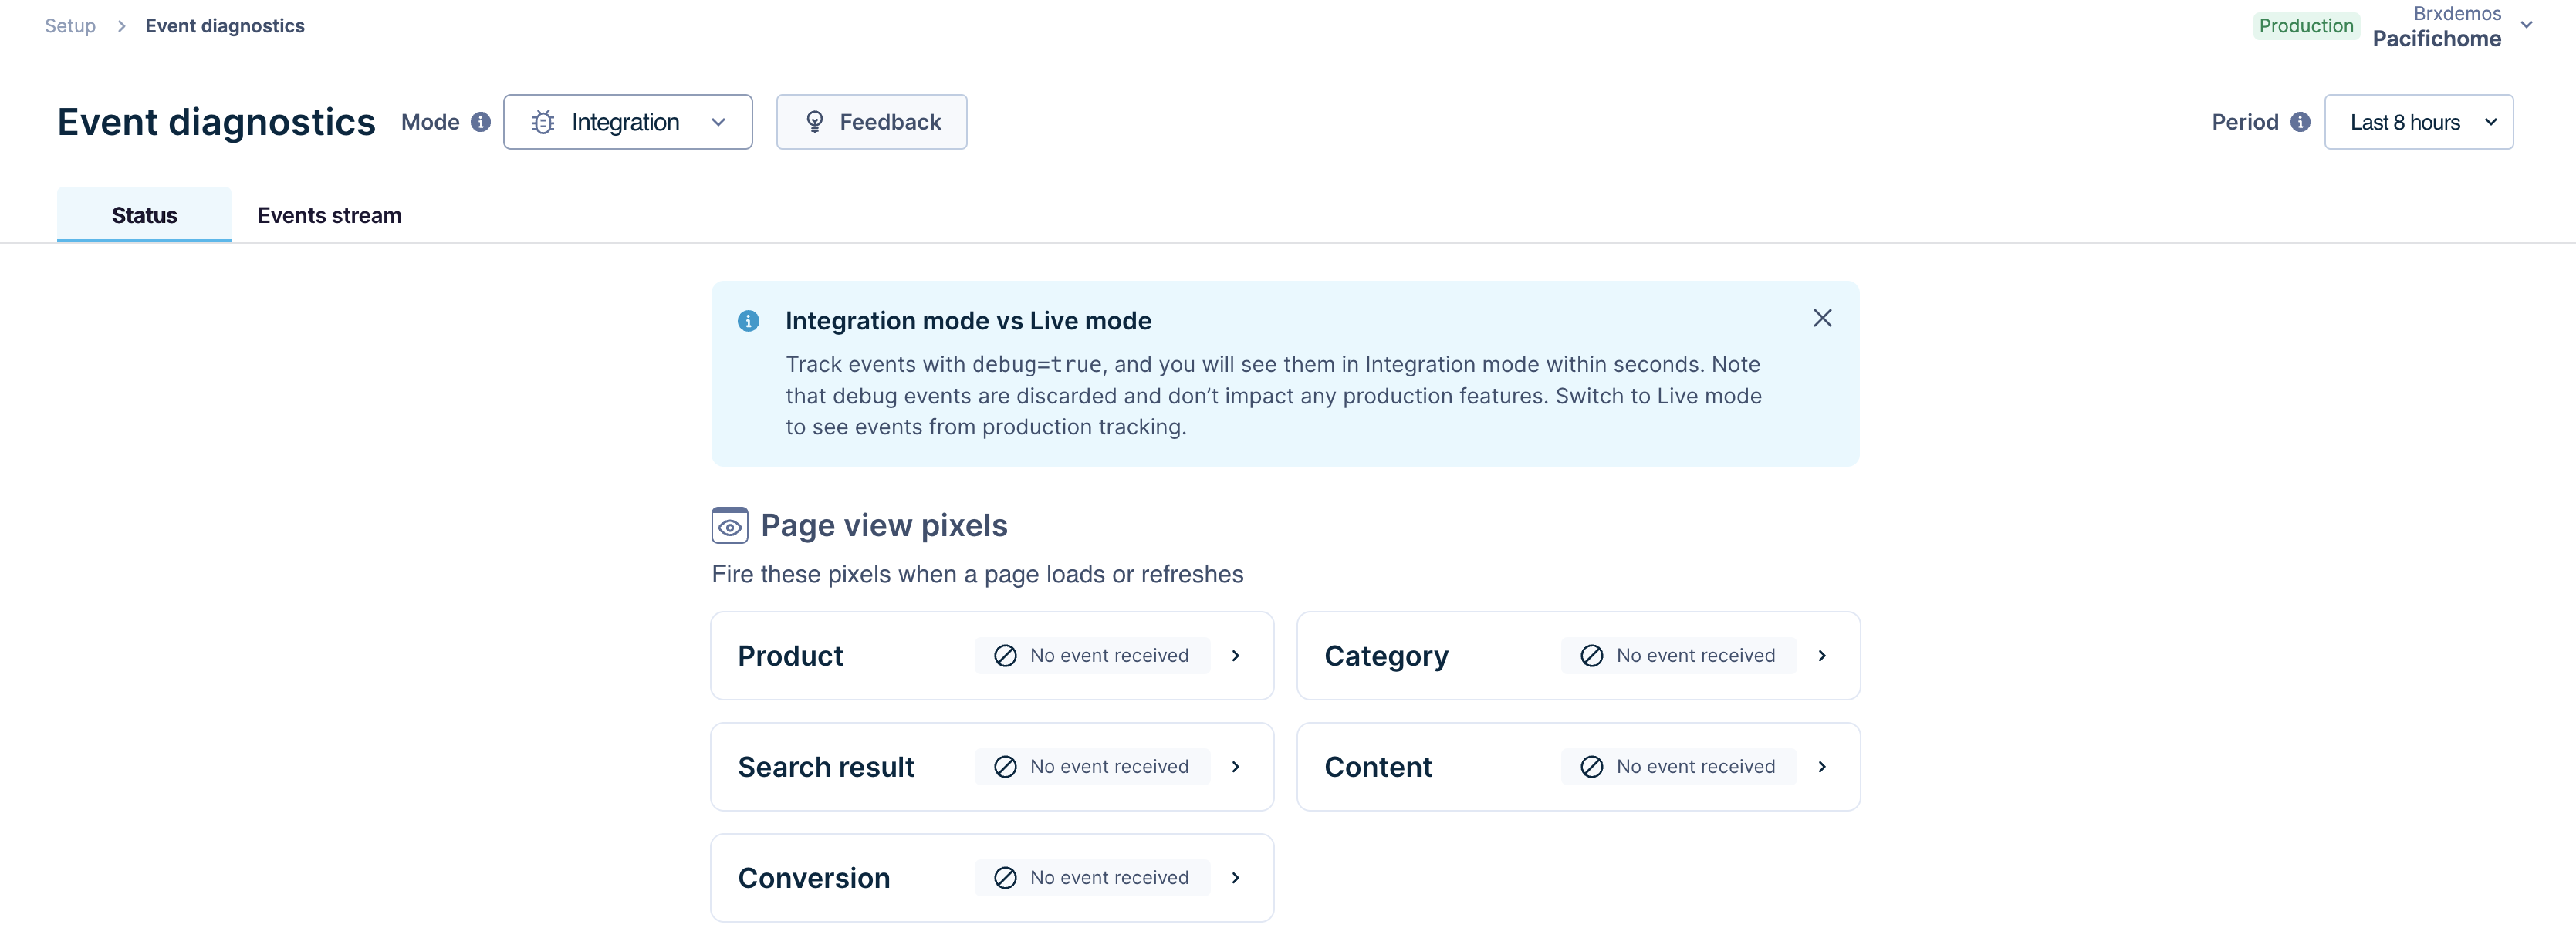
On the Event diagnostics page, you’ll see two tabs — Status and Events Stream. Each serves a distinct purpose, tailored to streamline your workflow and enhance your data management capabilities.
Receiving and Viewing New Events
On receiving new events, the UI displays a notification.

Click on Refresh to start viewing the received events under the Status and Events Stream tabs. In this example, a newly received Product page view event is displayed.
Status (for preliminary pixel verification)
This serves as your event health dashboard. It provides you with an overview of the quality of pixel events sent for a given period.
Events are grouped by type, and each category is assessed for correctness. Here, you can observe which pixel types are received correctly and which have issues. Events categories that contain any amount of pixel events with issues are indicated in orange, while those that have no issues detected will be marked in green.
Page view pixels
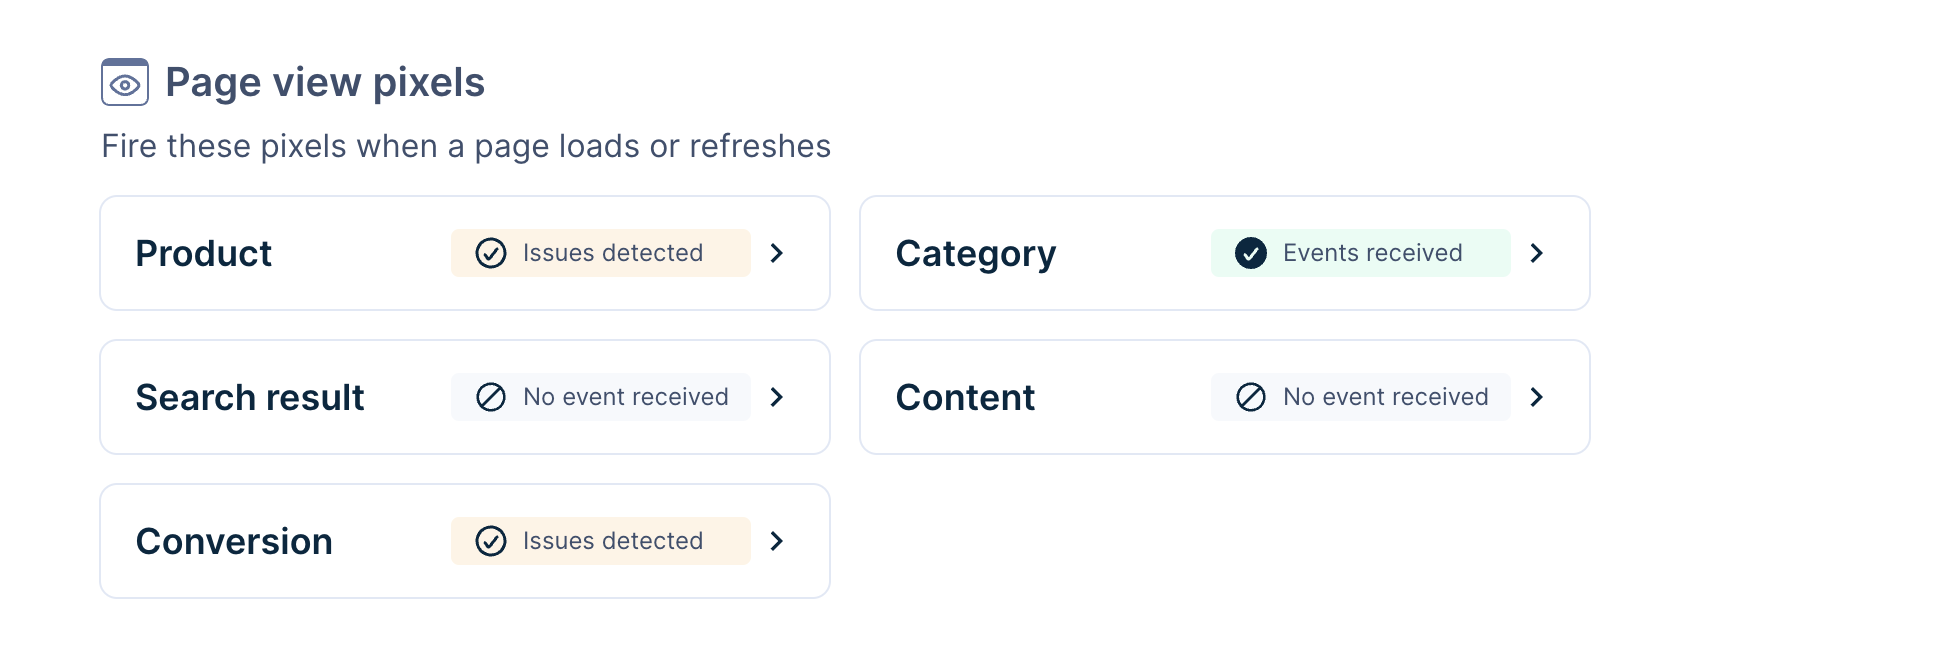
This gives a quick snapshot of your Page view pixels implementation. The pixel types displayed are:
- Product Page View
- Category Page View
- Search Result Page View
- Content page view
- Conversion Page View Pixel
Event pixels
This gives a quick snapshot of your Event pixel implementation. The event pixels displayed are:
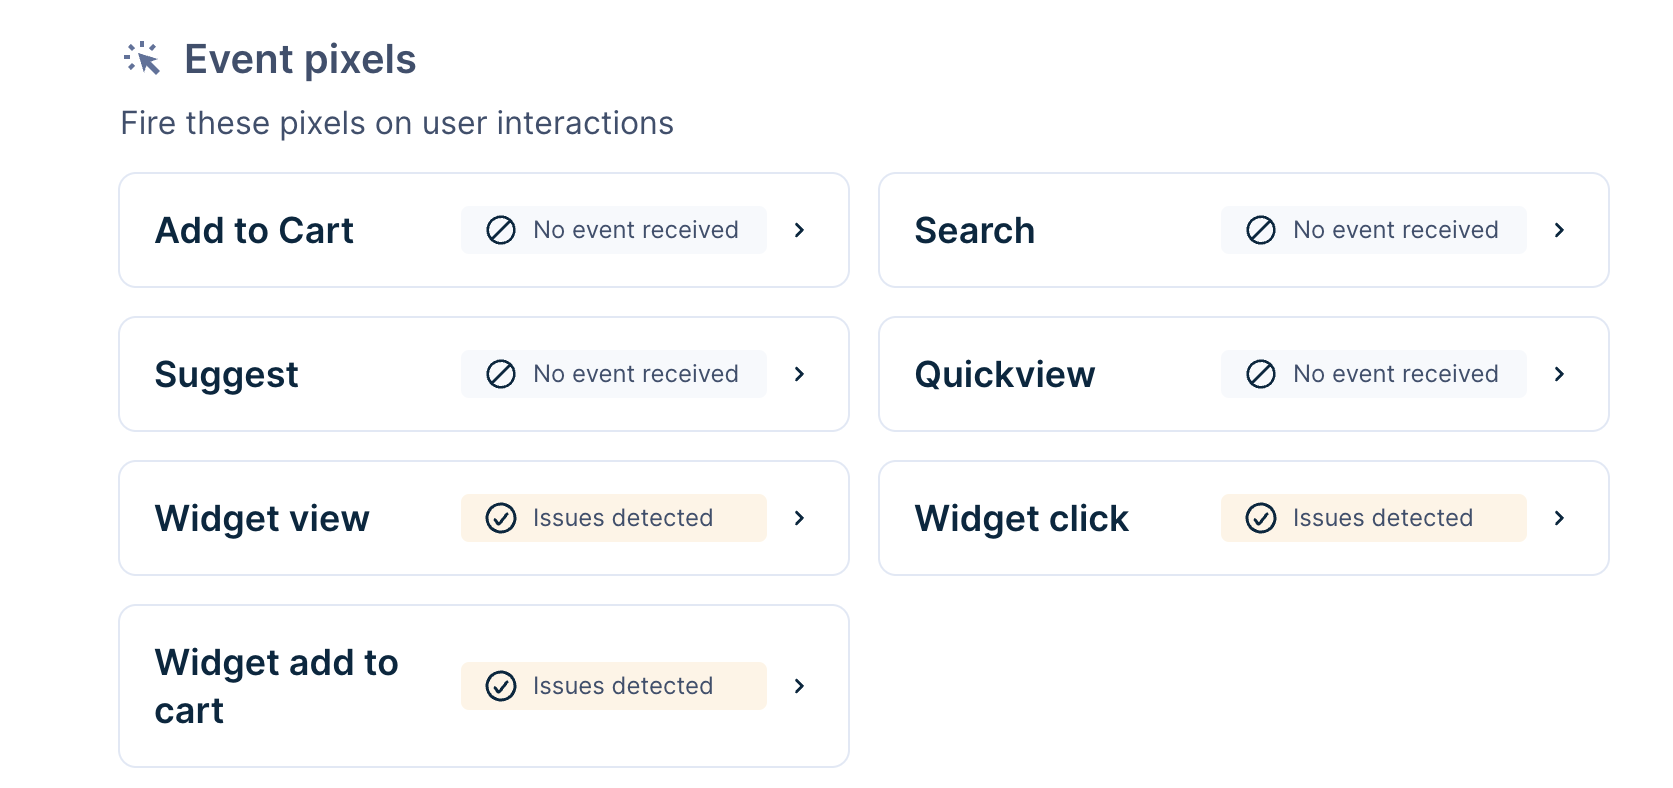
You can see the widget event pixels listed below.
View specific pixel issues and tracking code snippet
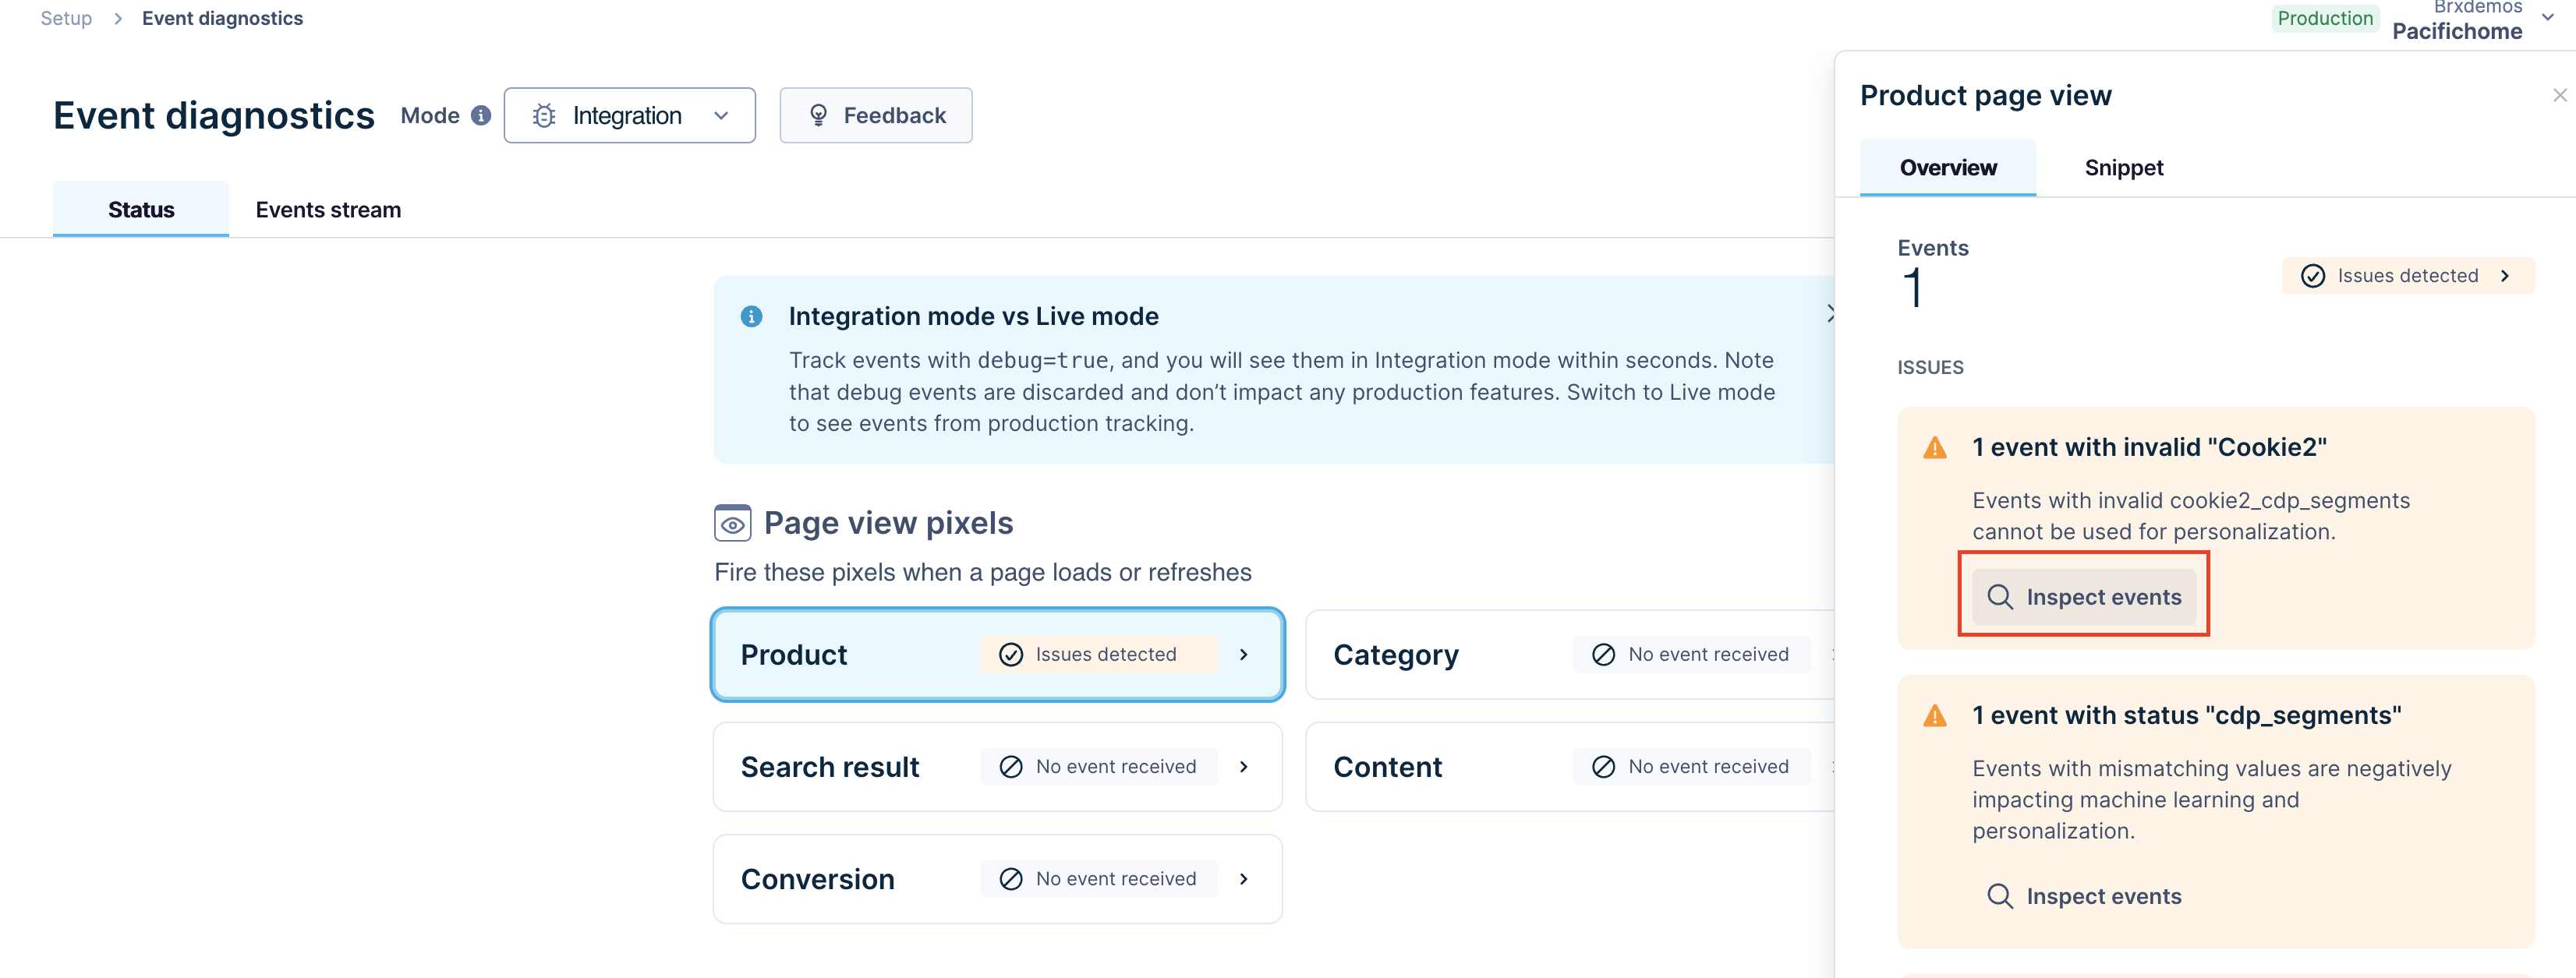
To get an overview of the issues pertaining to a specific event type, click the individual pixel type button. This opens the event type modal on the right with two tabs — Overview and Snippet.
Overview tab shows the pixel count (sum of individual pixels received on the API) and the specific issues detected. Click on the “🔍_Inspect events”_ option to inspect all details of this event type under the Events stream. In the example below, we inspect the Product page view pixels.
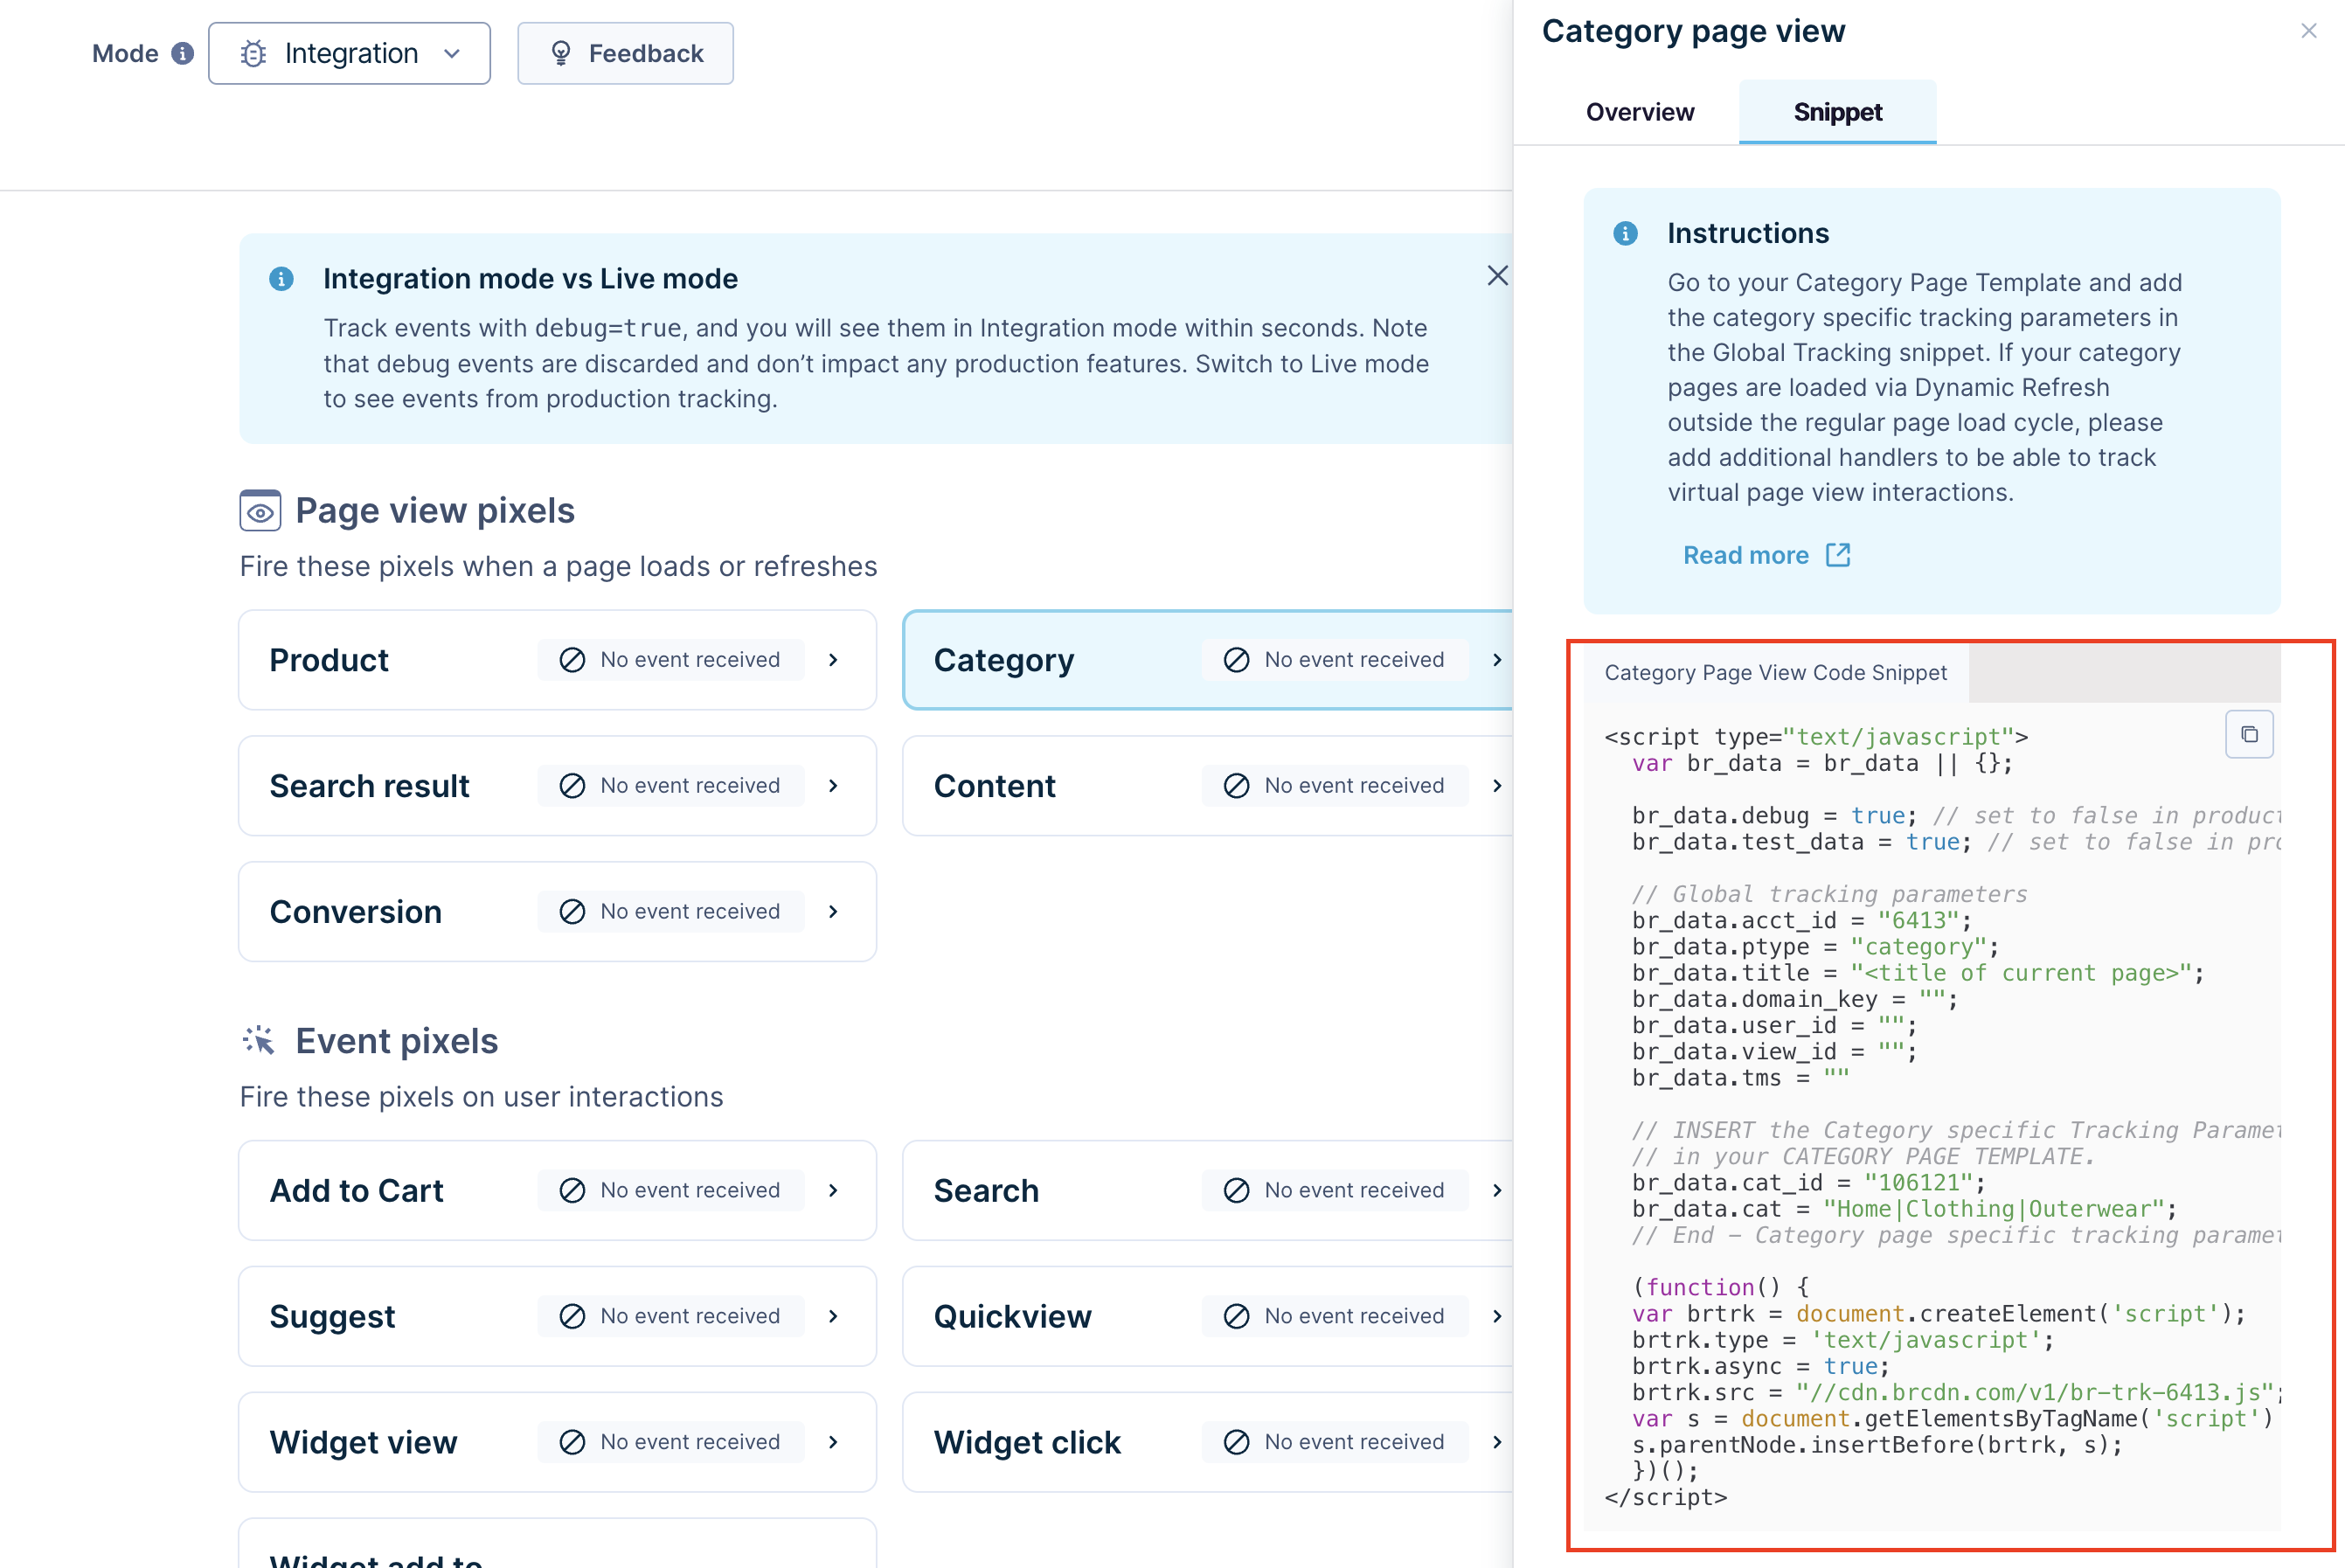
Snippet tab shows the event tracking code snippet that you can copy and use for pixel implementation. The snippet dynamically sets the account ID and debug parameter (for Integration mode). The code snippet also contains relevant comments that offer additional context regarding the parameters.
To monitor your pixel’s health closely, use Event alerts. It provides detailed trendlines and allows you to set alerts for pixel errors. This ensures that your data is flowing as expected.
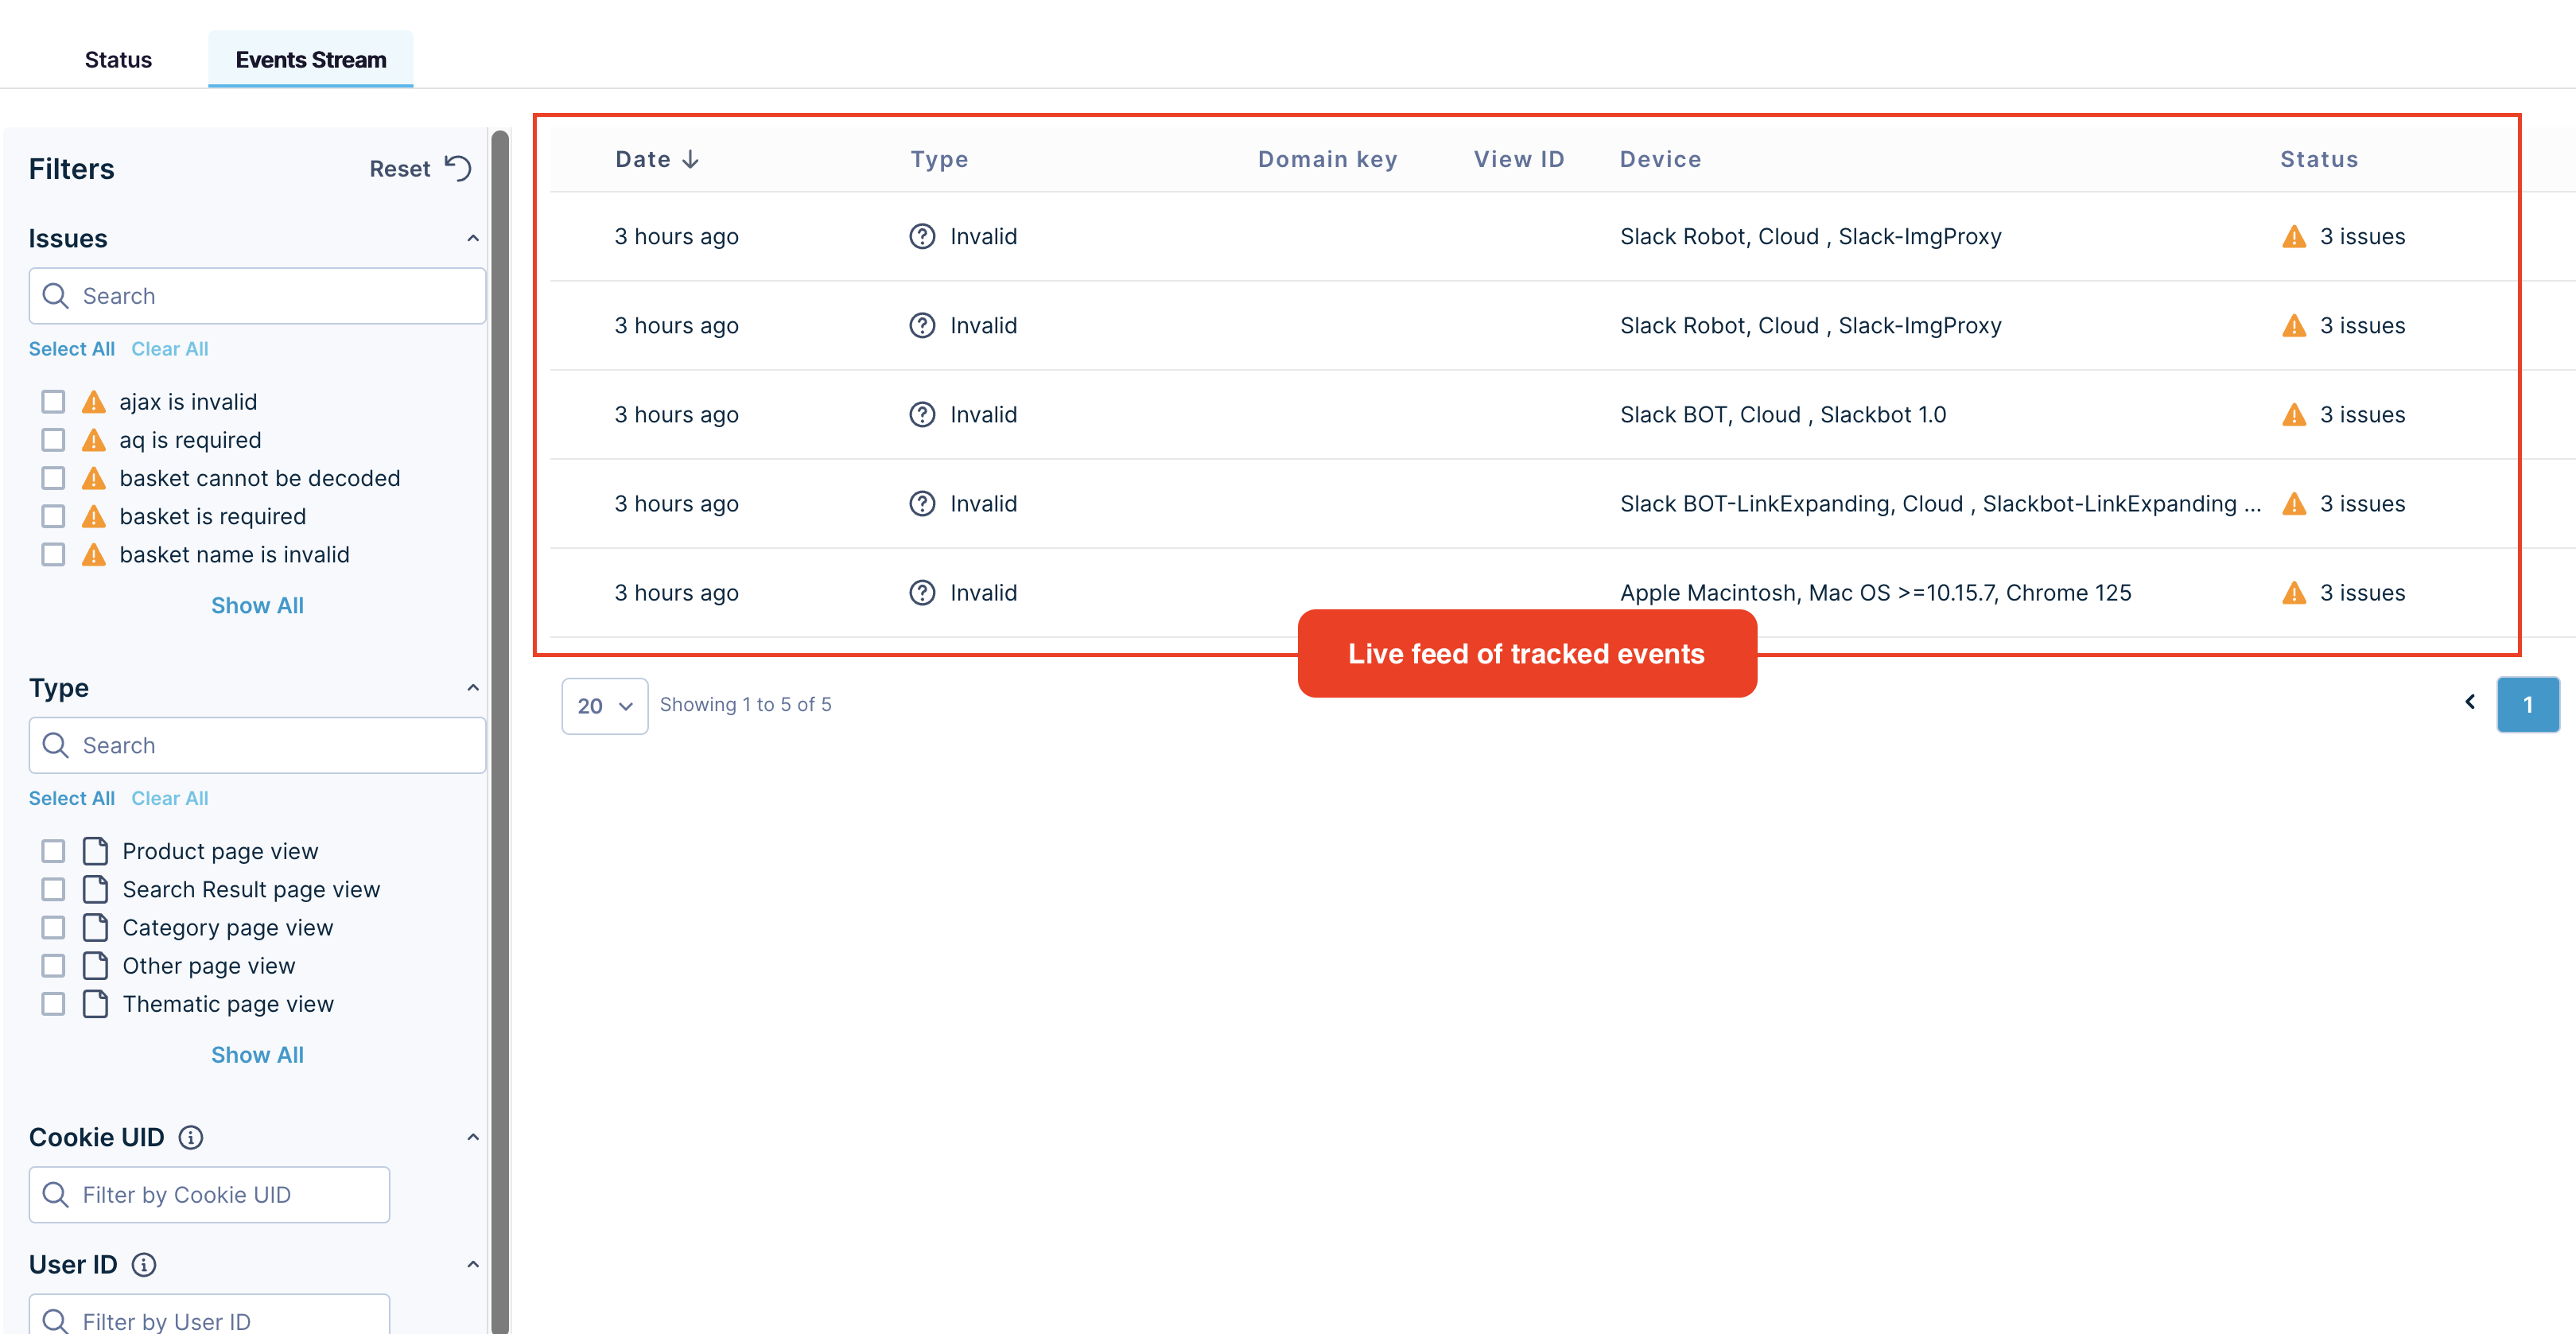
Events stream (for data-backed debugging)
This serves as a live feed of events as they are tracked on your site. Here you can
- Observe individual events received.
- Check the event validation status.
- Drill down into specifics like event type, timestamp, and much more.
Live feed
Here, you can view and inspect the detailed feed of all the tracked events. The details include
-
Date: Date when the event was tracked by our system.
-
Type: Type of pixel event tracked - page view or user interaction event.
-
Domain key: The Bloomreach-provided ID of the domain receiving the request. This parameter identifies the specific site language version when one account ID hosts multiple site versions with different languages.
-
View ID: The specific site catalog view displayed when one Bloomreach account ID hosts multiple site versions with unique product catalog characteristics, such as product price, availability, or title.
-
Device: Device where the event was fired.
-
Status: This specifies the status of the pixel type and helps identify any issues with the implementation.
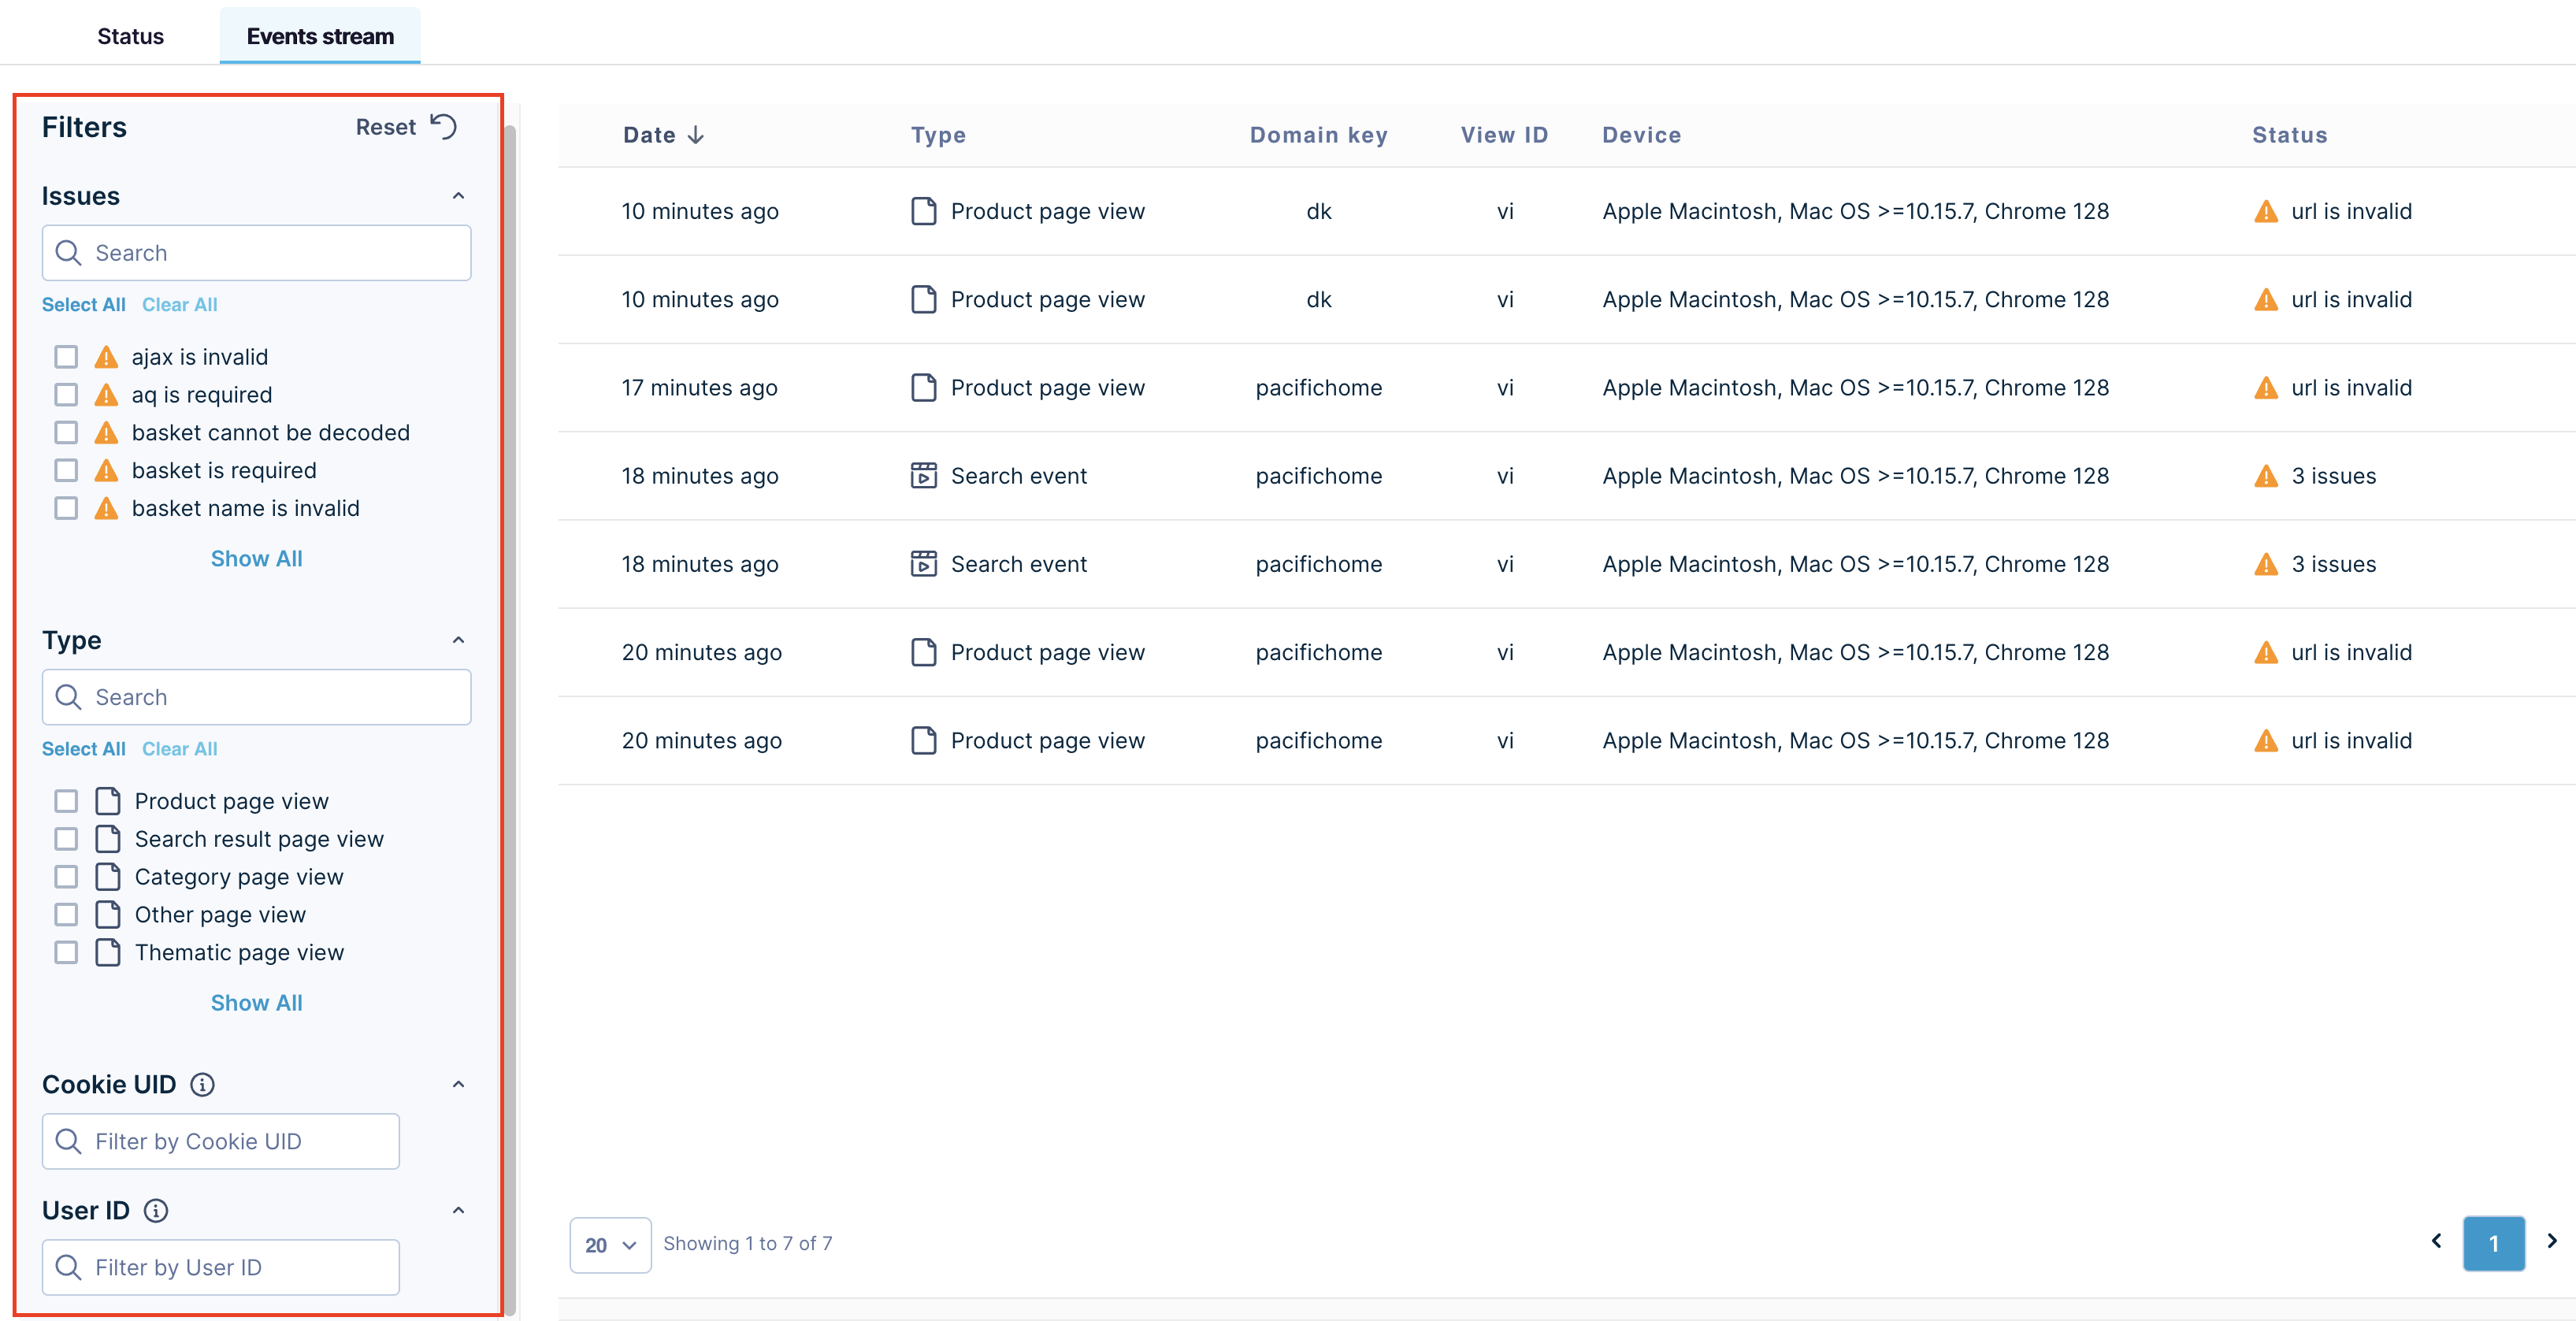
Filters
Here, you can filter the data based on Issue type, Type of pixel event, Cookie ID, and User ID.
Privacy and Data IntegrityIn line with our commitment to privacy and data protection, the Events Stream and the Event Details Side Panel are designed to respect user privacy. Any personally identifiable information (PII) is handled according to strict privacy standards, ensuring that sensitive data of your customers remains hidden or masked while you analyze event properties.
Track feature event properties
This section covers how to monitor the event properties of Real-Time Segments (RTS) and Relevance by Segment (RBS) features.
Real-Time Segments (RTS) property
If you are integrating the Real-Time Segments (RTS) feature, you might want to view, validate, and debug incoming event properties related to RTS. These are visible in the Event properties side panel.
View event property and values
Under the Derived Properties section, RTS property is displayed as Real-Time Segments with the respective Translated, Decoded, and Raw values. Please note that Real-time segments property is extracted from cookie2. You can read more on how RTS property is tracked in our Pixel Reference - cookie2 with cdp_segments.
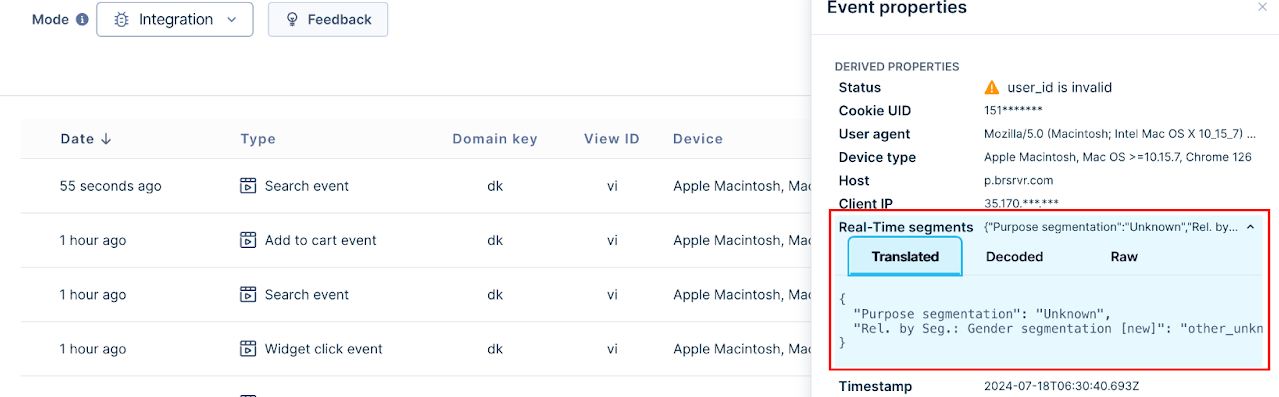
-
Translated: This shows a readable value (the name of the segmentation and the segment name retrieved from Bloomreach Engagement). The key-value pairs appear as follows:
[
"segmentation_name1": "segment_name",
"segmentation_name2": "segment_name"
]
If the translation fails, an error message is shown.
-
Decoded: This shows the original value decoded from base64 (segmentation ID and segment ID). If the decoding fails, an error message is shown.
-
Raw: This shows the original value parsed from cookie2 with cdp_segments.
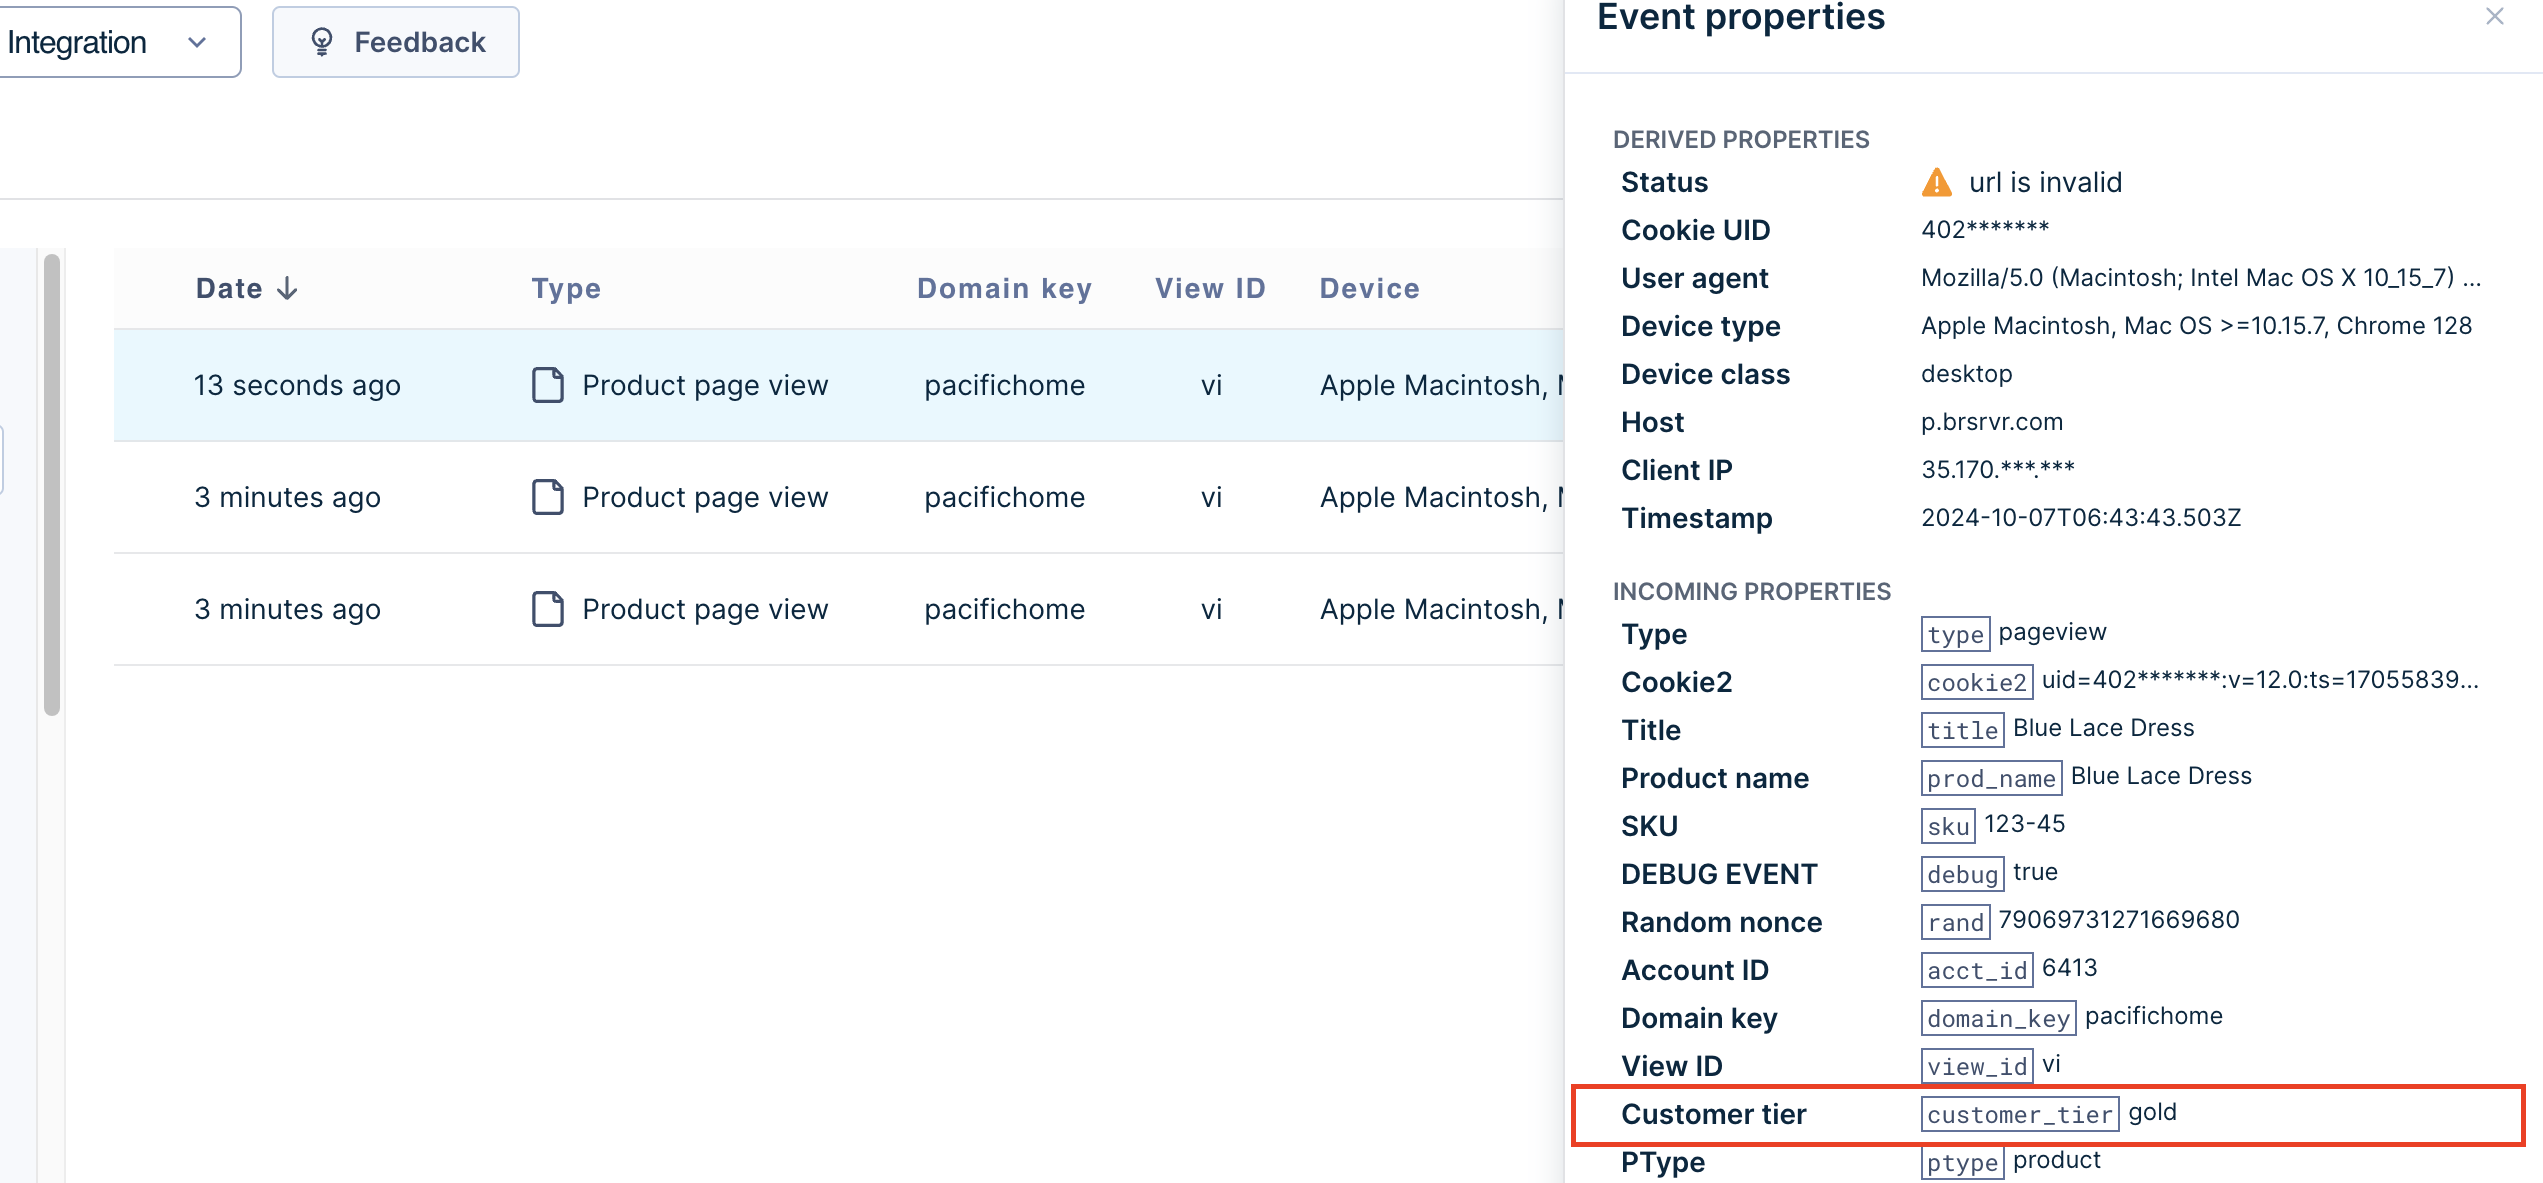
Relevance by Segment (RBS) event properties
If you are integrating the Relevance by Segment (RBS) feature, you might want to view, validate, and debug incoming event properties related to Relevance by Segment. These are visible in the Event properties side panel.
View event properties and values
Under the Incoming Properties section, the following RBS properties are displayed with their respective values:
Updated 4 months ago