

Unique visitors
Monitor your monthly unique visitor (MUV) metrics and, if you are on the MUV-based pricing plan, track usage against your contracted limit to ensure compliance.
What is the Unique visitors dashboard?
The Unique visitors section of the Usage application shows high-level analytics for visitor metrics across your entire organization and its associated accounts. This dashboard provides visibility into your monthly unique visitor (MUV) counts and tracks how your actual usage compares to your contracted MUV, if applicable.
The dashboard consolidates visitor data from your connected channels (website and mobile apps) into a single view, enabling you to identify usage trends.
Access the Unique visitors dashboard
Permissions
A Bloomreach user with any read or write user role can view Unique visitors under the Usage application.
Additionally, the Usage report viewer role can be granted to a specific user on the organization or account level for restricted view-only access to analytics data.
Navigation
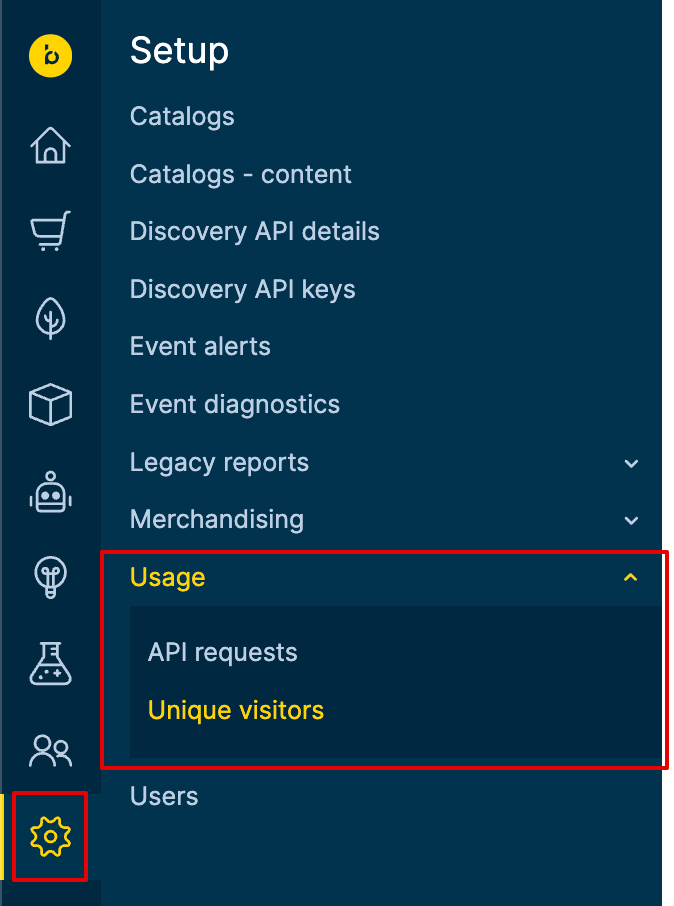
To view unique visitor metrics, go to Setup > Usage > Unique visitors in the Bloomreach dashboard.
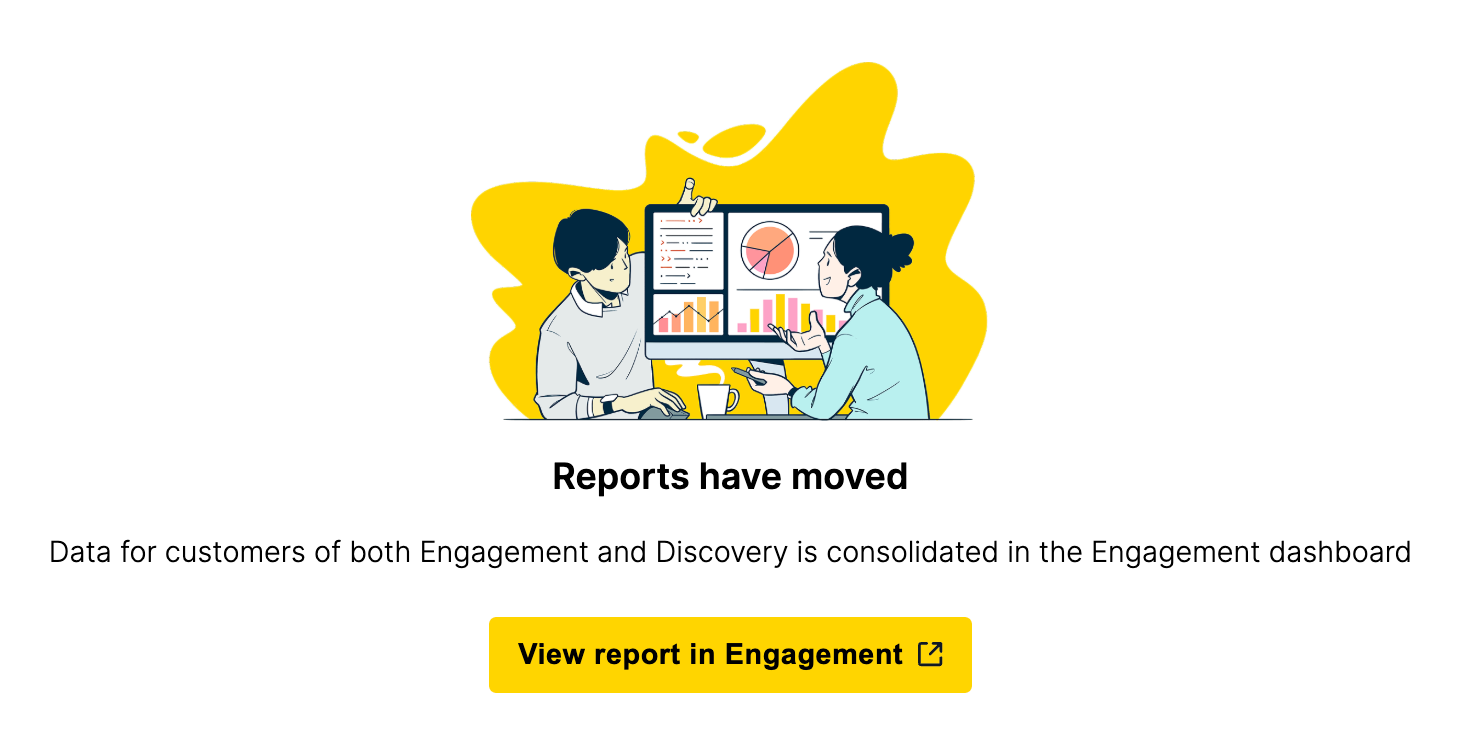
NoteIf you are also a Bloomreach Engagement customer with an MUV-based pricing plan, the Unique visitor statistics will be consolidated and available in your Engagement dashboard.
Dashboard functionalities
The Unique visitors dashboard provides tools to analyze your site’s visitor metrics, track consumption limits, and export data for analysis. These functionalities work together to give you complete visibility into your visitor traffic patterns and contract utilization.
NoteSome metrics like the contracted MUV threshold indicator, and percentage of plan used are only visible to customers on Bloomreach’s MUV-based pricing plan.
Scope
Select your data viewing level from the Showing data for dropdown located at the top left corner of the dashboard. This selector determines whether you're viewing visitor metrics for your entire organization or a specific account.

When you select the organization, the dashboard aggregates visitor data across all accounts under your contract, providing an aggregated view of your total visitor consumption. Select an individual account to view and analyze visitor patterns at the account level. The selected scope automatically updates all dashboard components, including the visitor chart and average calculations.
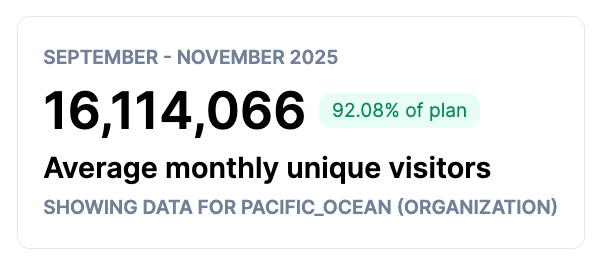
Average monthly unique visitors
View your visitor baseline using the average monthly unique visitors metric (and the corresponding percentage of contract consumption based on the average, if applicable) calculated over the last three completed months. This rolling average is updated monthly to evaluate current performance against historical trends.
The MUVs are calculated from unique cookie IDs captured from Bloomreach Pixels.
WarningMissing or static cookie IDs can lead to inconsistent MUVs as compared to results from other tracking tools.
Monthly visitor trends
The interactive bar graph visualizes your visitor patterns over the last 24 months, with each bar representing the total number of unique visitors for that month. Years are color-coded for visual comparison.

Key features of the visitor trends chart:
Contract threshold indicator: A horizontal line marks your contracted monthly unique visitor limit, making it immediately visible when usage exceeds your allocation. This cutoff line only appears when viewing organization-level data and if your pricing model is based on visitor metrics.
Monthly data refresh: The data for a month is populated on the second day of the following month at 11:00 AM UTC. This ensures you always have complete metrics for analysis. The current month remains empty until fully completed to maintain data accuracy.
Interactive data exploration: Hover your cursor over any bar to reveal a tooltip showing:
-
Exact visitor counts for the last two years
-
Percentage change in the month’s traffic from the previous year

Download data
Export your visitor metrics by using the Download data button located at the top right corner of the dashboard. Click this button to generate a CSV file containing the visitor trend graph’s data for your selected scope.

The exported file includes:
-
Month and year identifiers
-
Total unique visitors per month (for the last 24 months)
Use exported data to create custom reports, perform advanced analytics in external tools, or share metrics with stakeholders who don't have dashboard access. The CSV format ensures compatibility with Excel, Google Sheets, and business intelligence platforms.
Downloaded file format
Each row shows the year’s unique visitor counts for each month.
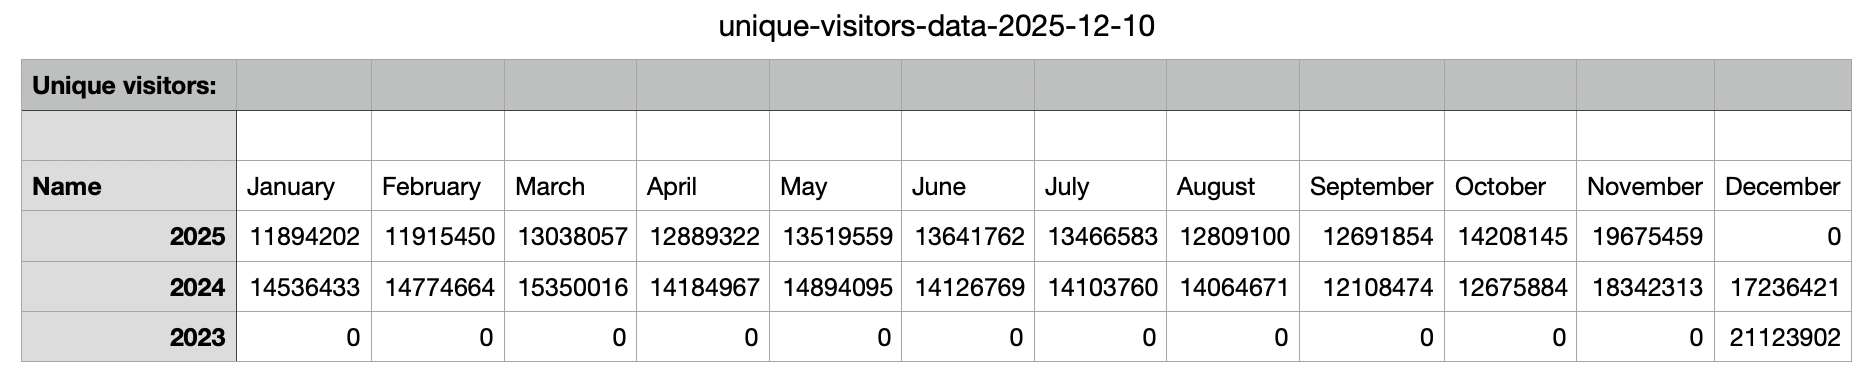
Each row shows the year’s unique visitor counts for each month.
Updated 3 months ago