

Performance dashboard
This guide introduces the Performance dashboard, the metrics it shows, and how to use it to explore your site's performance.
TipWatch the mini masterclass on the Performance dashboard in Bloomreach Academy.
Prerequisites
-
Permissions: Your Users Admin must assign you the Insights reports editor permission to access the Performance dashboard.
-
Pixel data accuracy: Ensure that your pixel data is high-quality and sent in the required format. The pixel pipeline runs daily. As soon as pixels begin streaming into the system following your integration, the corresponding metrics become visible the next day.
What is Performance dashboard
The Performance dashboard application brings your search, category, product, and page performance into one consistent view.
Performance dashboard benefits
- Monitor your site's full funnel, from visits to revenue, in one place.
- Drill from a high-level view down to a single query, category, or product, then back up.
- Group and track your own sets of queries, categories, products, and brands as custom scopes, then follow their combined performance over time.
- Track consistent numbers across the dashboard — every tab measures revenue, conversions, and add-to-carts the same way, so your search, category, and product metrics stay comparable.
- Compare performance across any two time periods to spot trends and track progress.
- Export any table to continue your analysis outside the application.
- Assess the impact of your ranking rules, synonyms, and redirects automatically.
How Performance dashboard works
The application pulls data across your site traffic and presents it through:
-
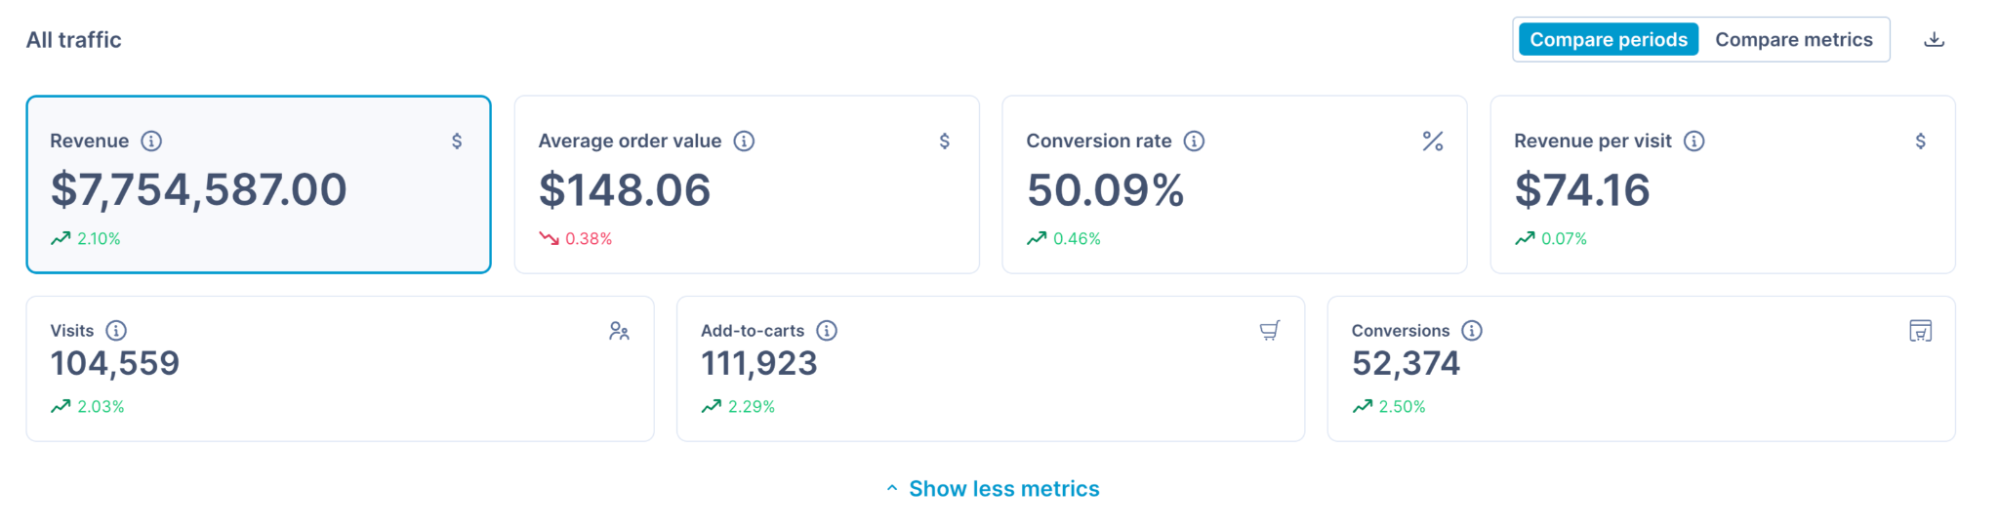
Metric cards: Headline values for the selected period.
-
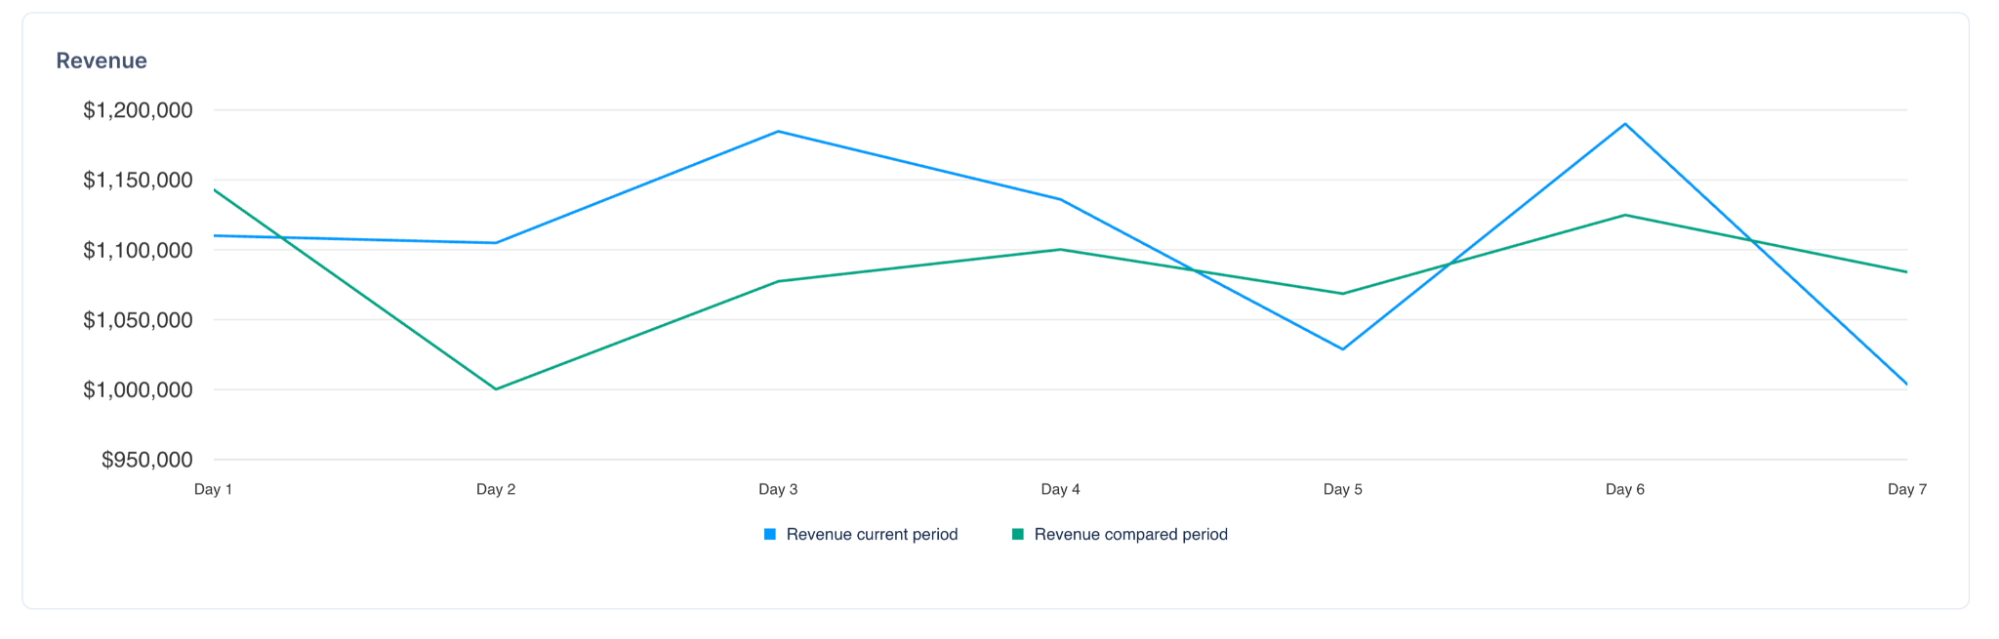
Metrics chart: A trend line for the metrics you choose to plot.
-
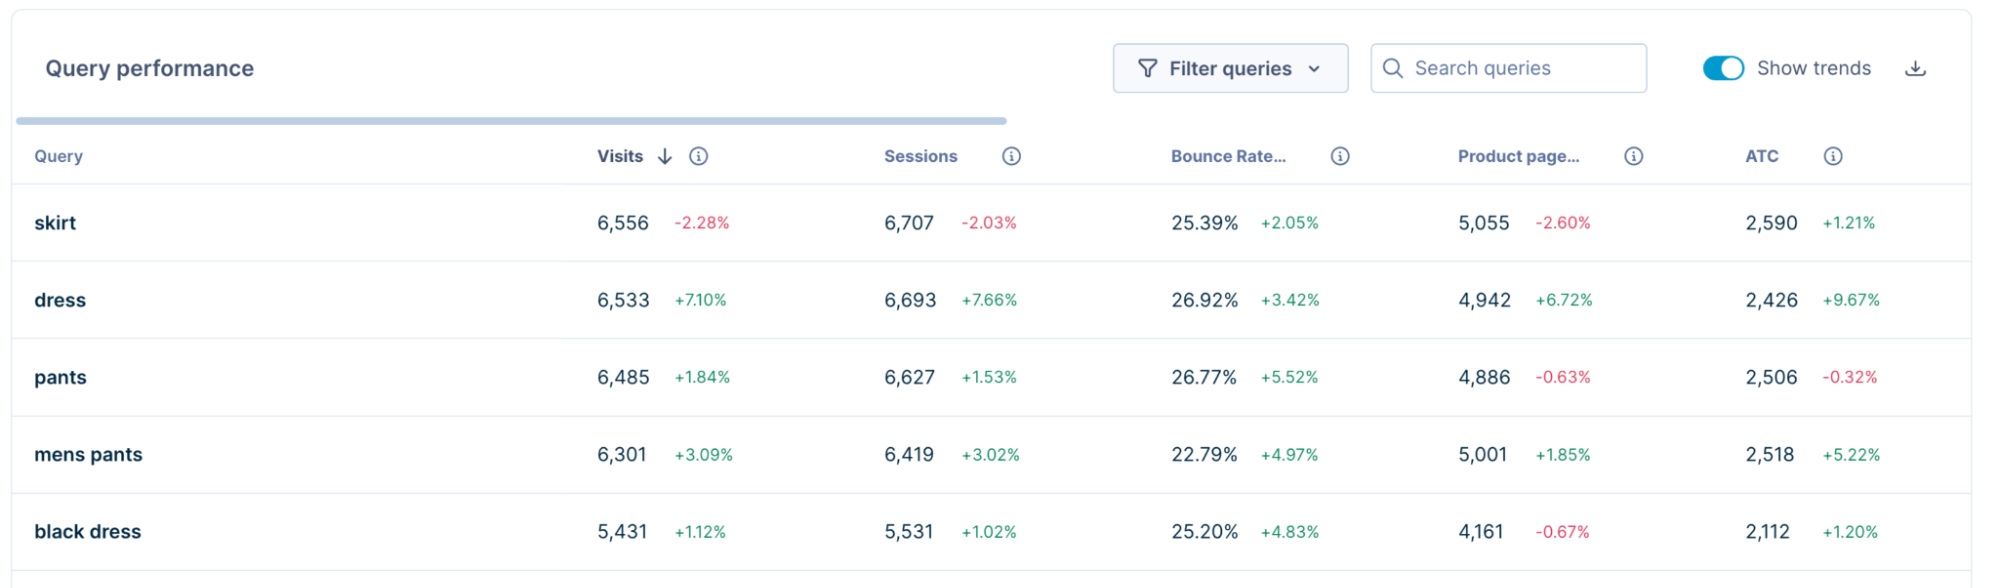
Performance table: Query, category, product-level, or page-level detail.
Navigate Performance dashboard
Find the application under Insights > Performance dashboard. Work across tabs, each giving you a focused view from a different angle:
- Overall: A high-level view of all traffic across your site.
- Site search: Performance for the queries your shoppers are searching.
- Category: Performance for the category pages your shoppers are browsing.
- Products: Performance for individual products.
- Pages: Performance for individual pages.
- Impact measurement: Performance before and after changes to your ranking rules, synonyms, and redirects.
Control what you see with the date pickers, custom scopes, trends, and metric comparison across every tab.
Set current time period
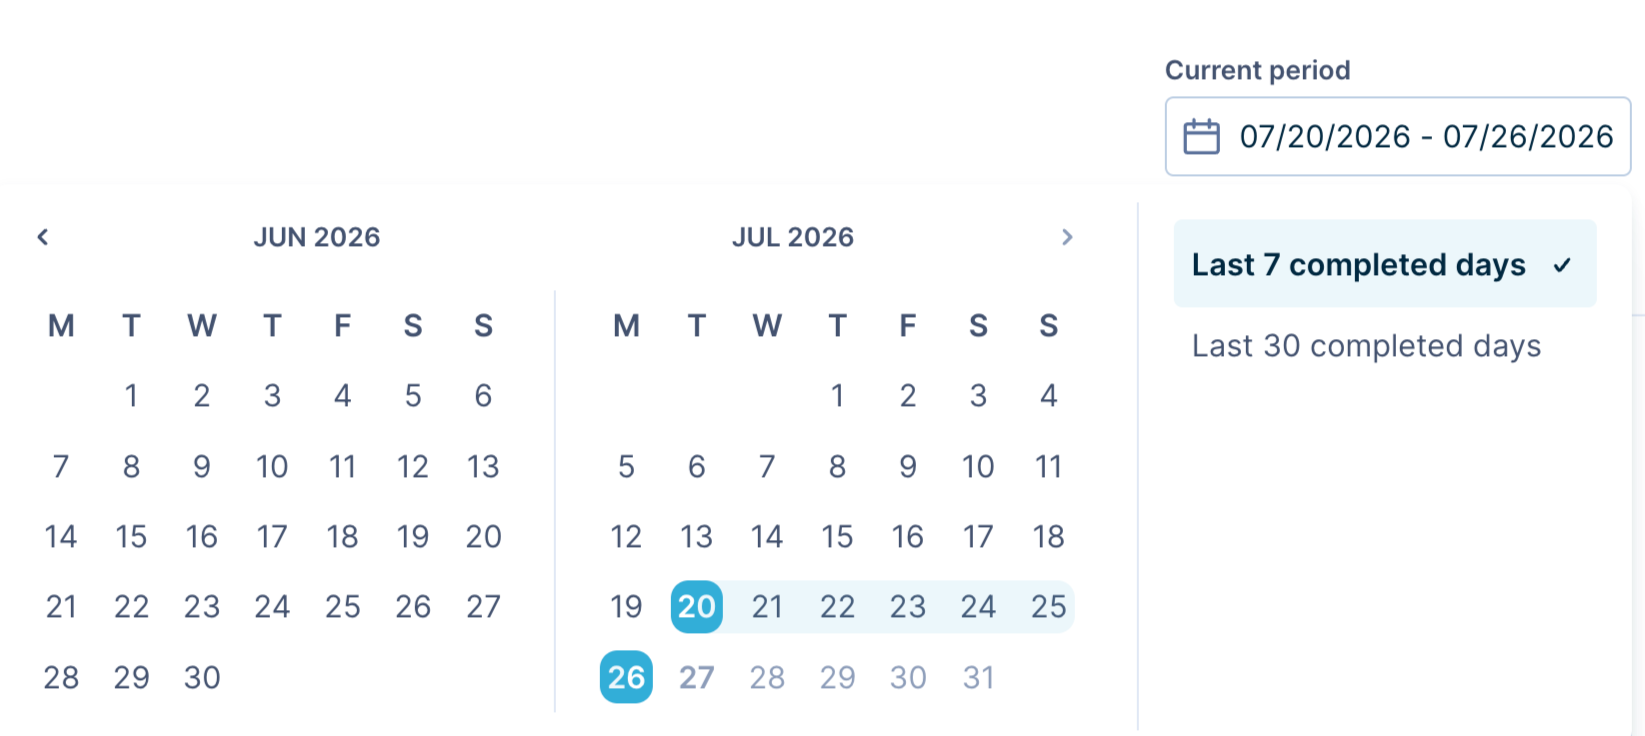
Set the time frame for every metric, chart, and table using the Current period
date picker at the top of the application.
-
Click the Current period date picker.
-
Choose a preset, such as Prior 7 days period, or select Custom range to set your own start and end dates.
The chart and tables update to reflect your selection.
Set comparison time period
After setting the current time period, set the comparison time frame for every metric, chart, and table using the Compared to date picker at the top of the application.
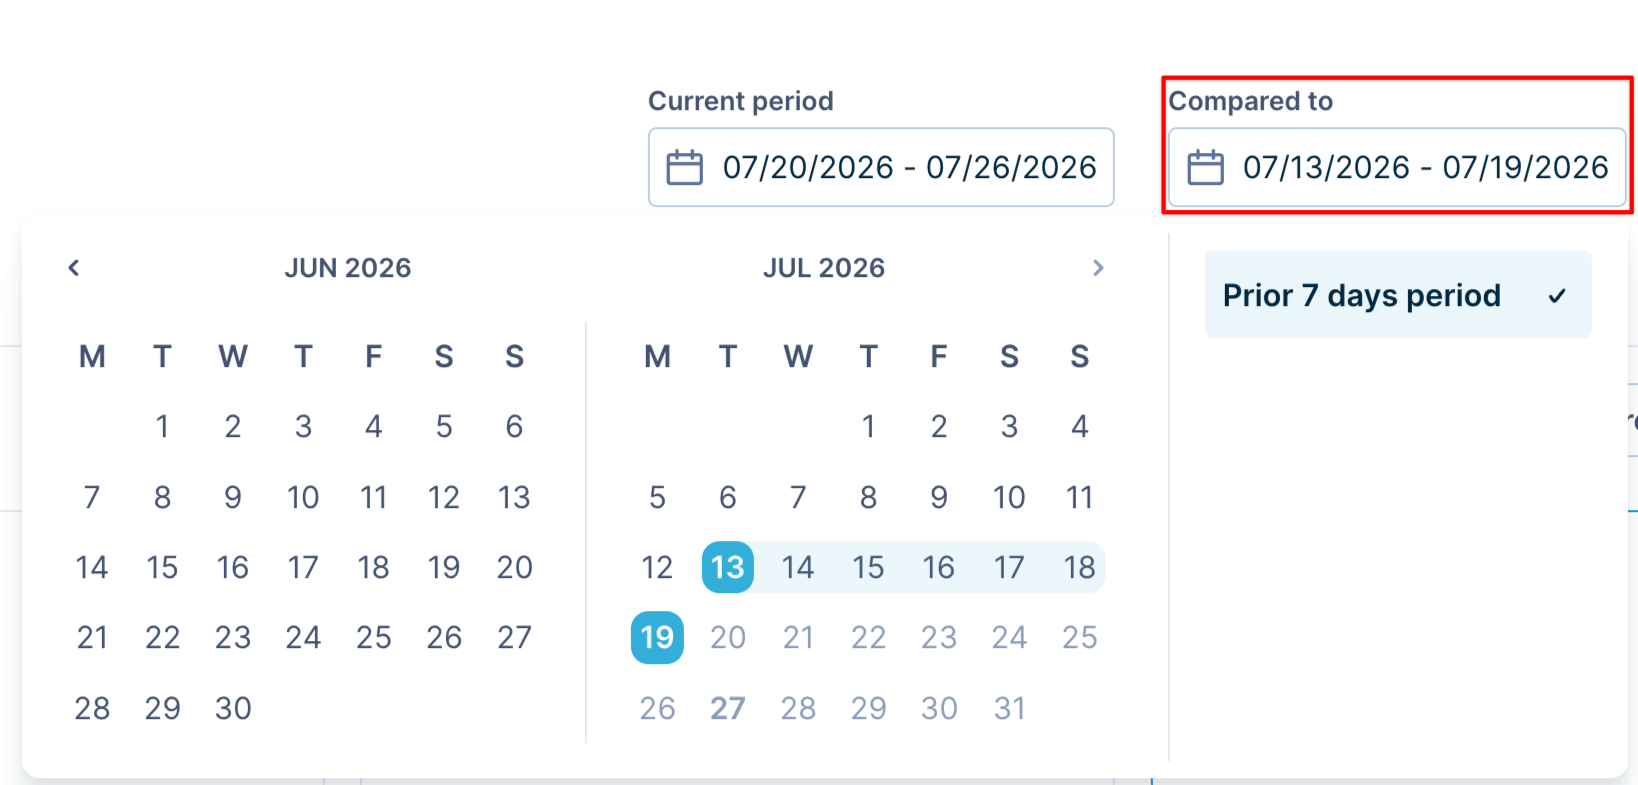
As a best practice, set the comparison period to the same range as the current period.
The chart updates to plot both periods, metric cards show the trends, and the performance tables show the period-on-period trends.
NoteAlways set the current period first and then compare. Selecting the current period automatically updates the Compared to date picker with the same time period. For instance, if the current period is set to 30 days, the comparison period defaults to the preceding 30 days.
Once this baseline is set, you can modify the comparison range to a different timeframe, such as the same period from the previous year.
View trends
Every trend in the application — the green or red percentage change next to a value — compares the current period against the comparison period. The comparison period drives the trend, so set it carefully. View the site search, category, or product trends under their respective tabs.
For trends, follow the best practices:
-
Set the correct time period.
-
Set the comparison period to the same number of days as the current period. When you pick a preset such as the last 30 days, the application automatically selects the prior 30 days for comparison.
-
Compare a period against the one immediately before it, not against a later one.

-
-
Check that the pixel data is available. Ensure data exists for the full comparison window. If it doesn't, the trend can't be calculated.
NoteIf the comparison period has partial data because the integration was set up recently, the dashboard calculates trends wherever enough data is available, including at the overall level and for individual queries, categories, and products.
In the performance table, if a metric has no data or its value is 0, the dashboard doesn’t show a trend for that metric. Only the values for the current period are shown.
To see current values without any comparison, toggle Show trends OFF.
Compare metrics in chart
The chart works in one of the following modes at a time. You can't combine both modes.
Compare periods
Click the metric card you want to plot. This plots a single metric across the current and comparison periods.
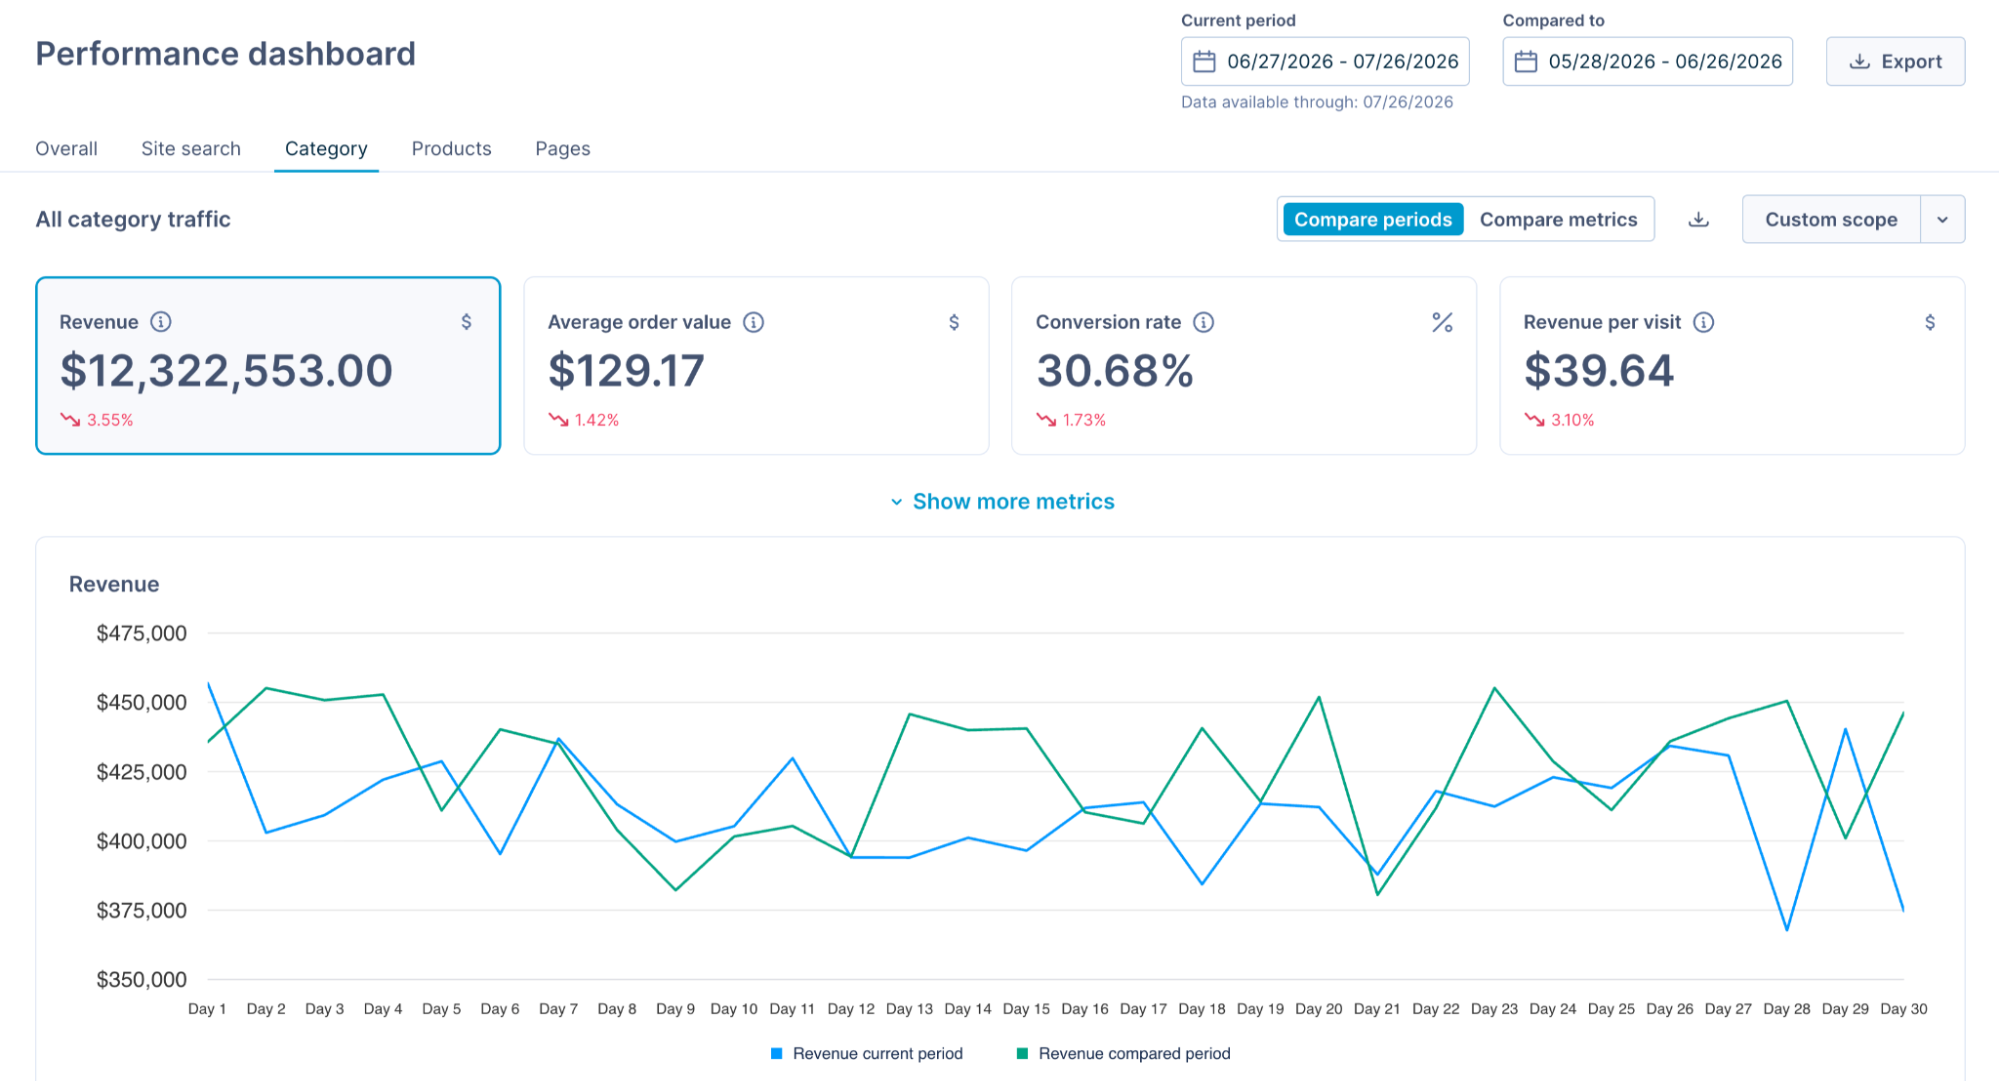
Compare metrics
Plot up to 2 metrics for the current period only. Comparing 2 metrics over multiple periods isn't supported.
To compare metrics:
-
Switch to Compare metrics mode.
-
Select up to 2 metric cards you want to plot.
-
To swap a metric, unselect one and select another.
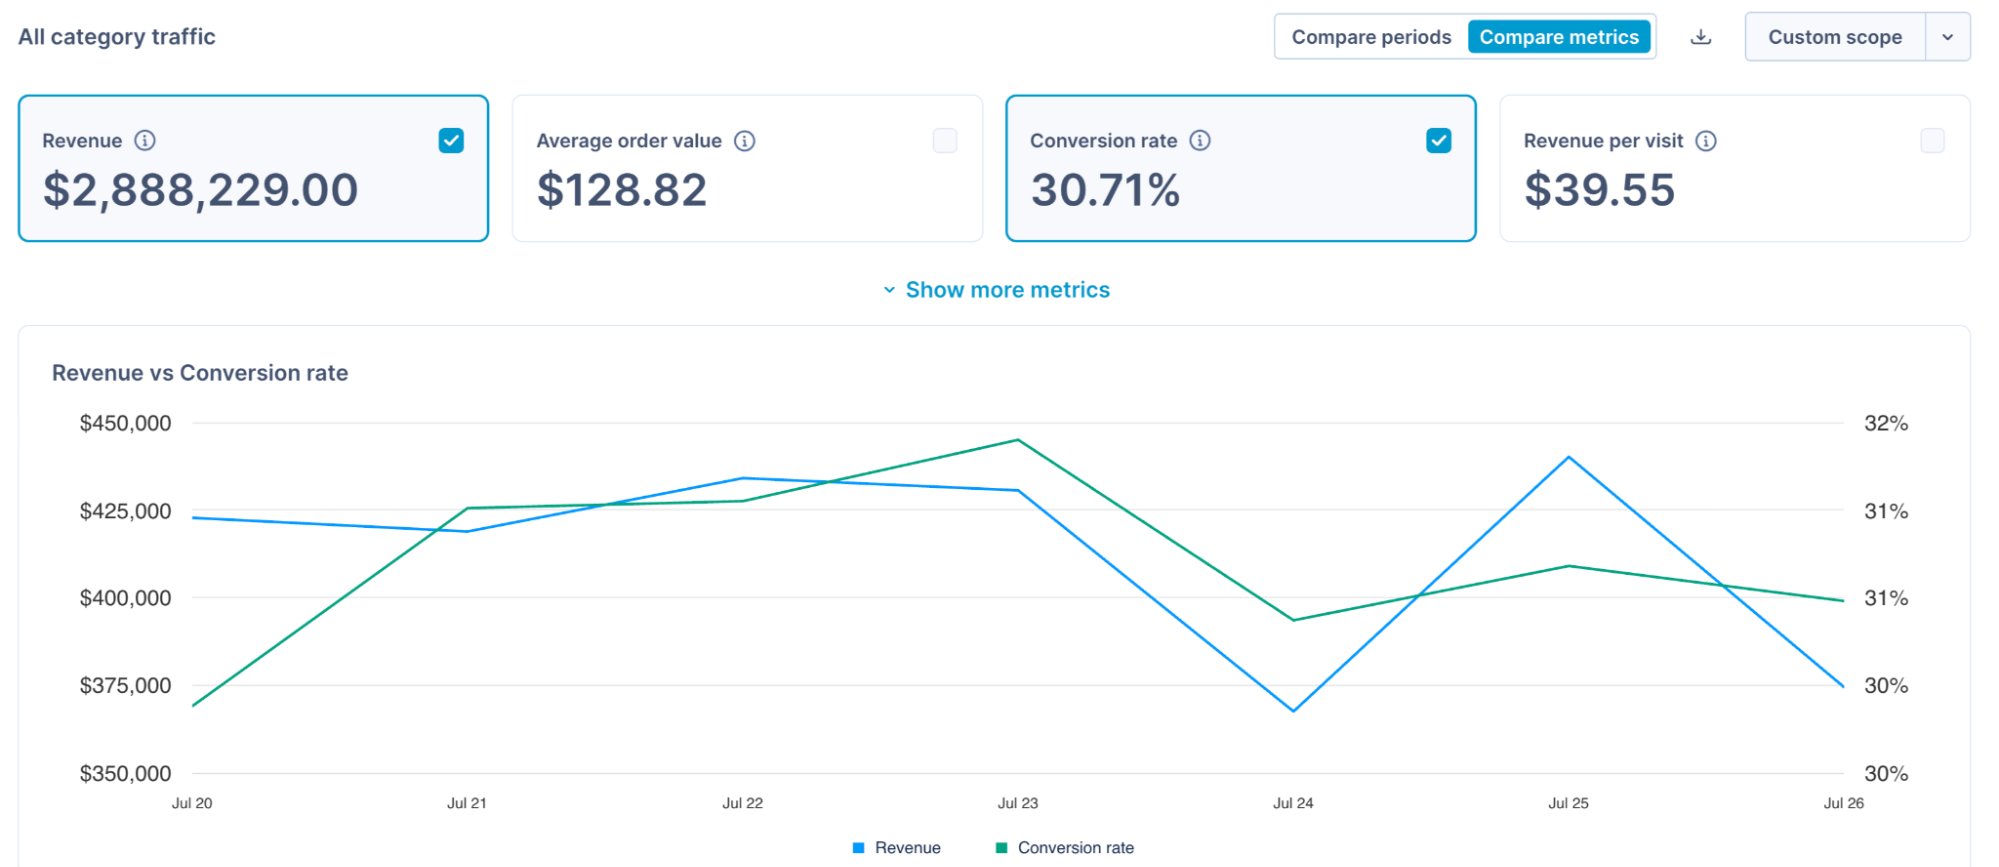
The chart plots each metric on its own axis. Click the download icon to export a one-time CSV. Get the current page with only the visible rows. For the full dataset, use the export option.
Work with performance tables
Every performance table helps you find your best and worst performers fast.
- Sort by any column to rank items. For example, sort by revenue to find your top keywords.
- Toggle ON Show trends to display period-on-period trend indicators next to each value.
- Click the download icon to export the table as a one-time CSV. Get the current page with only the visible rows. For the full dataset, use export.
Filter tables
Filters narrow the performance table to the items you care about the most. Apply 1 filter at a time. You can filter in 2 ways.
Preset filters
Apply ready-made Bloomreach filters. Each preset filter has a set definition. Sorting isn't supported when you apply preset filters.
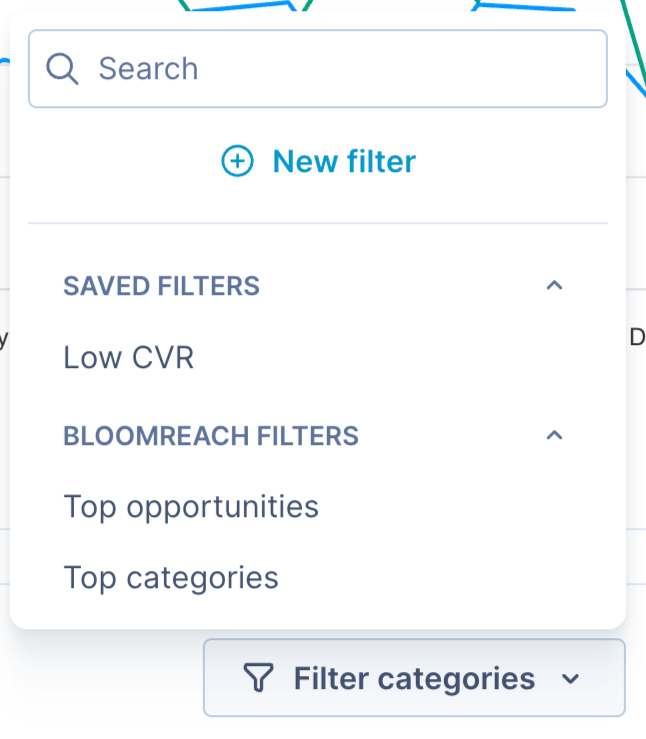
- Search presets: Trending searches/keywords, Top opportunities, New queries with highest visits, No product clicks, No search result keywords, Top searched keywords, No revenue keywords.
- Category preset: Top opportunities, Top categories.
- Product preset: Top products.
Custom filters
Build your own filter using one or more conditions on any metric, then save it with a name:
-
Click Filter queries/categories/products/pages.
-
Click +New filter.
-
Specify the filter name.
-
Set the filter conditions. You can also filter by trend, not just by raw value. For example, queries where revenue is trending up more than 5%. This lets you surface items by momentum, not only by totals.
-
Click +Add condition to combine multiple conditions with AND or OR operators.
-
Click Apply to apply this filter once and see its impact on the table. Click Save and apply if you plan on reusing this custom filter. Saved filters appear under Filter queries > Saved filters.
Group items with custom scopes
A custom scope groups a set of queries, categories, or products so you can track their combined performance over time. The metric cards, chart, and table all narrow to the items in the scope.
- Click Custom scope.
- Specify the scope name.
- Specify the metric, operator, and values. Build a scope using one of 2 operators:
- Is: Match items exactly. Each entry adds one item, so the scope stays a finite, predictable set. Specify the product ID, category ID, or query and select them from the suggestions drop-down. Note that you can also include queries that are not yet part of your catalog.
- Contains: Match every item that includes your value. For example, contains "sale" captures every query with "sale" in it.
-
For queries and products, click +Add condition to combine multiple conditions with AND or OR operators. For categories, combine multiple conditions with the OR operator.
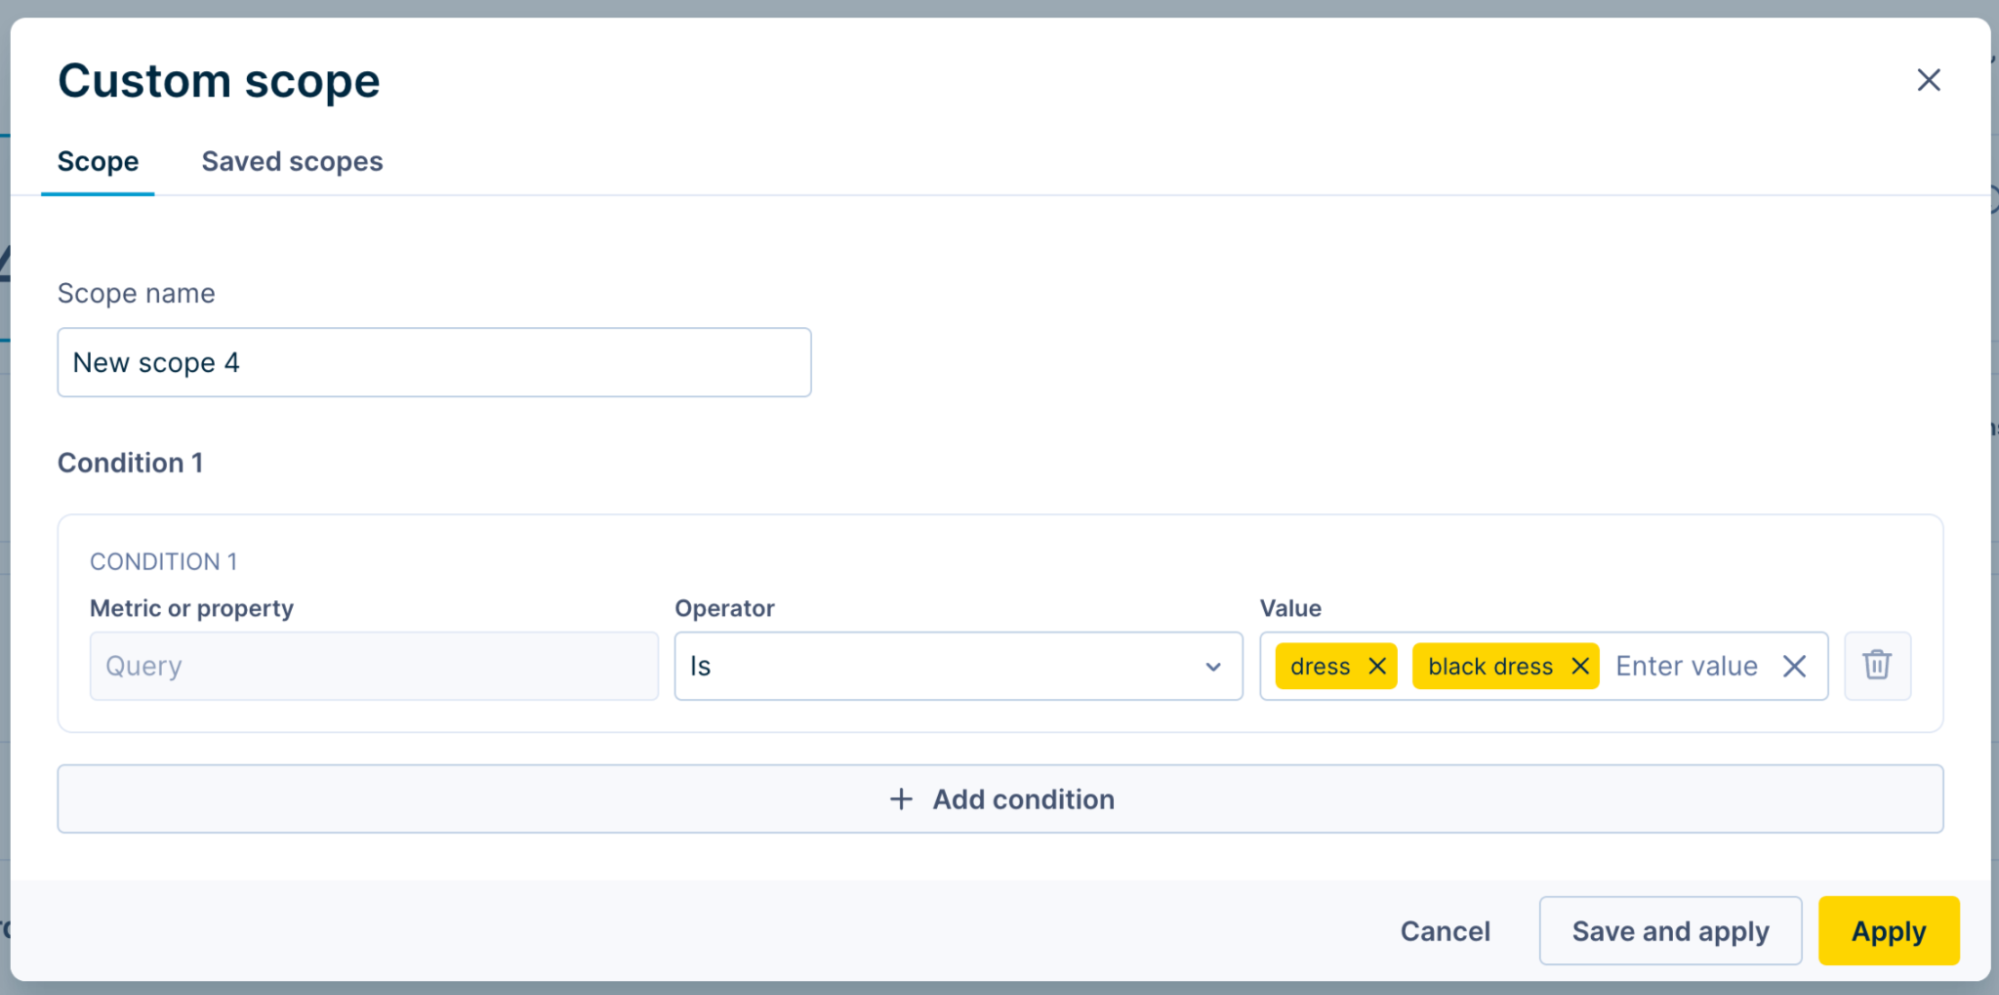
- Click Apply to apply this scope once. Click Save and apply if you plan on reusing this custom scope.
Saved scopes appear under the drop-down adjacent to Custom scope. You can create an unlimited number of custom scopes.
NoteYour edit access is determined by the specific level (account, site group, or site level) at which you create the custom scope.
Custom scopes flow downward through inheritance from higher to lower levels. For instance, any custom scope configured at the account level automatically applies to the site level, but this inheritance does not apply from the bottom up.
Filters and custom scopes together
A filter and a scope stack. Without a scope, a filter runs against all your data; with a scope active, the filter runs against just that subset, so you see fewer results or none.
Switching scopes doesn't clear a filter you already applied. Check what's active so your data view shows what you expect.
Export your data
Export your data from the application in 2 ways.
One-time CSV download
Click the download icon on any metric set or table to download the table view as a CSV right away. Note that this does not download the entire dataset.
Export data
Request a larger export to your email.
One time exports
-
Click Export.
-
Under the One time tab, choose the time period and whether to include the comparison period.
-
Choose the scope from Overall, Search, Category, Products, or Pages. Add up to 5 scopes in one request if needed.
-
Choose the metric set — the top-level global metrics, or specific metrics.
-
Add an optional filter to narrow the export.
-
Submit the request. The system emails each scope separately, so 5 scopes arrive as 5 emails.
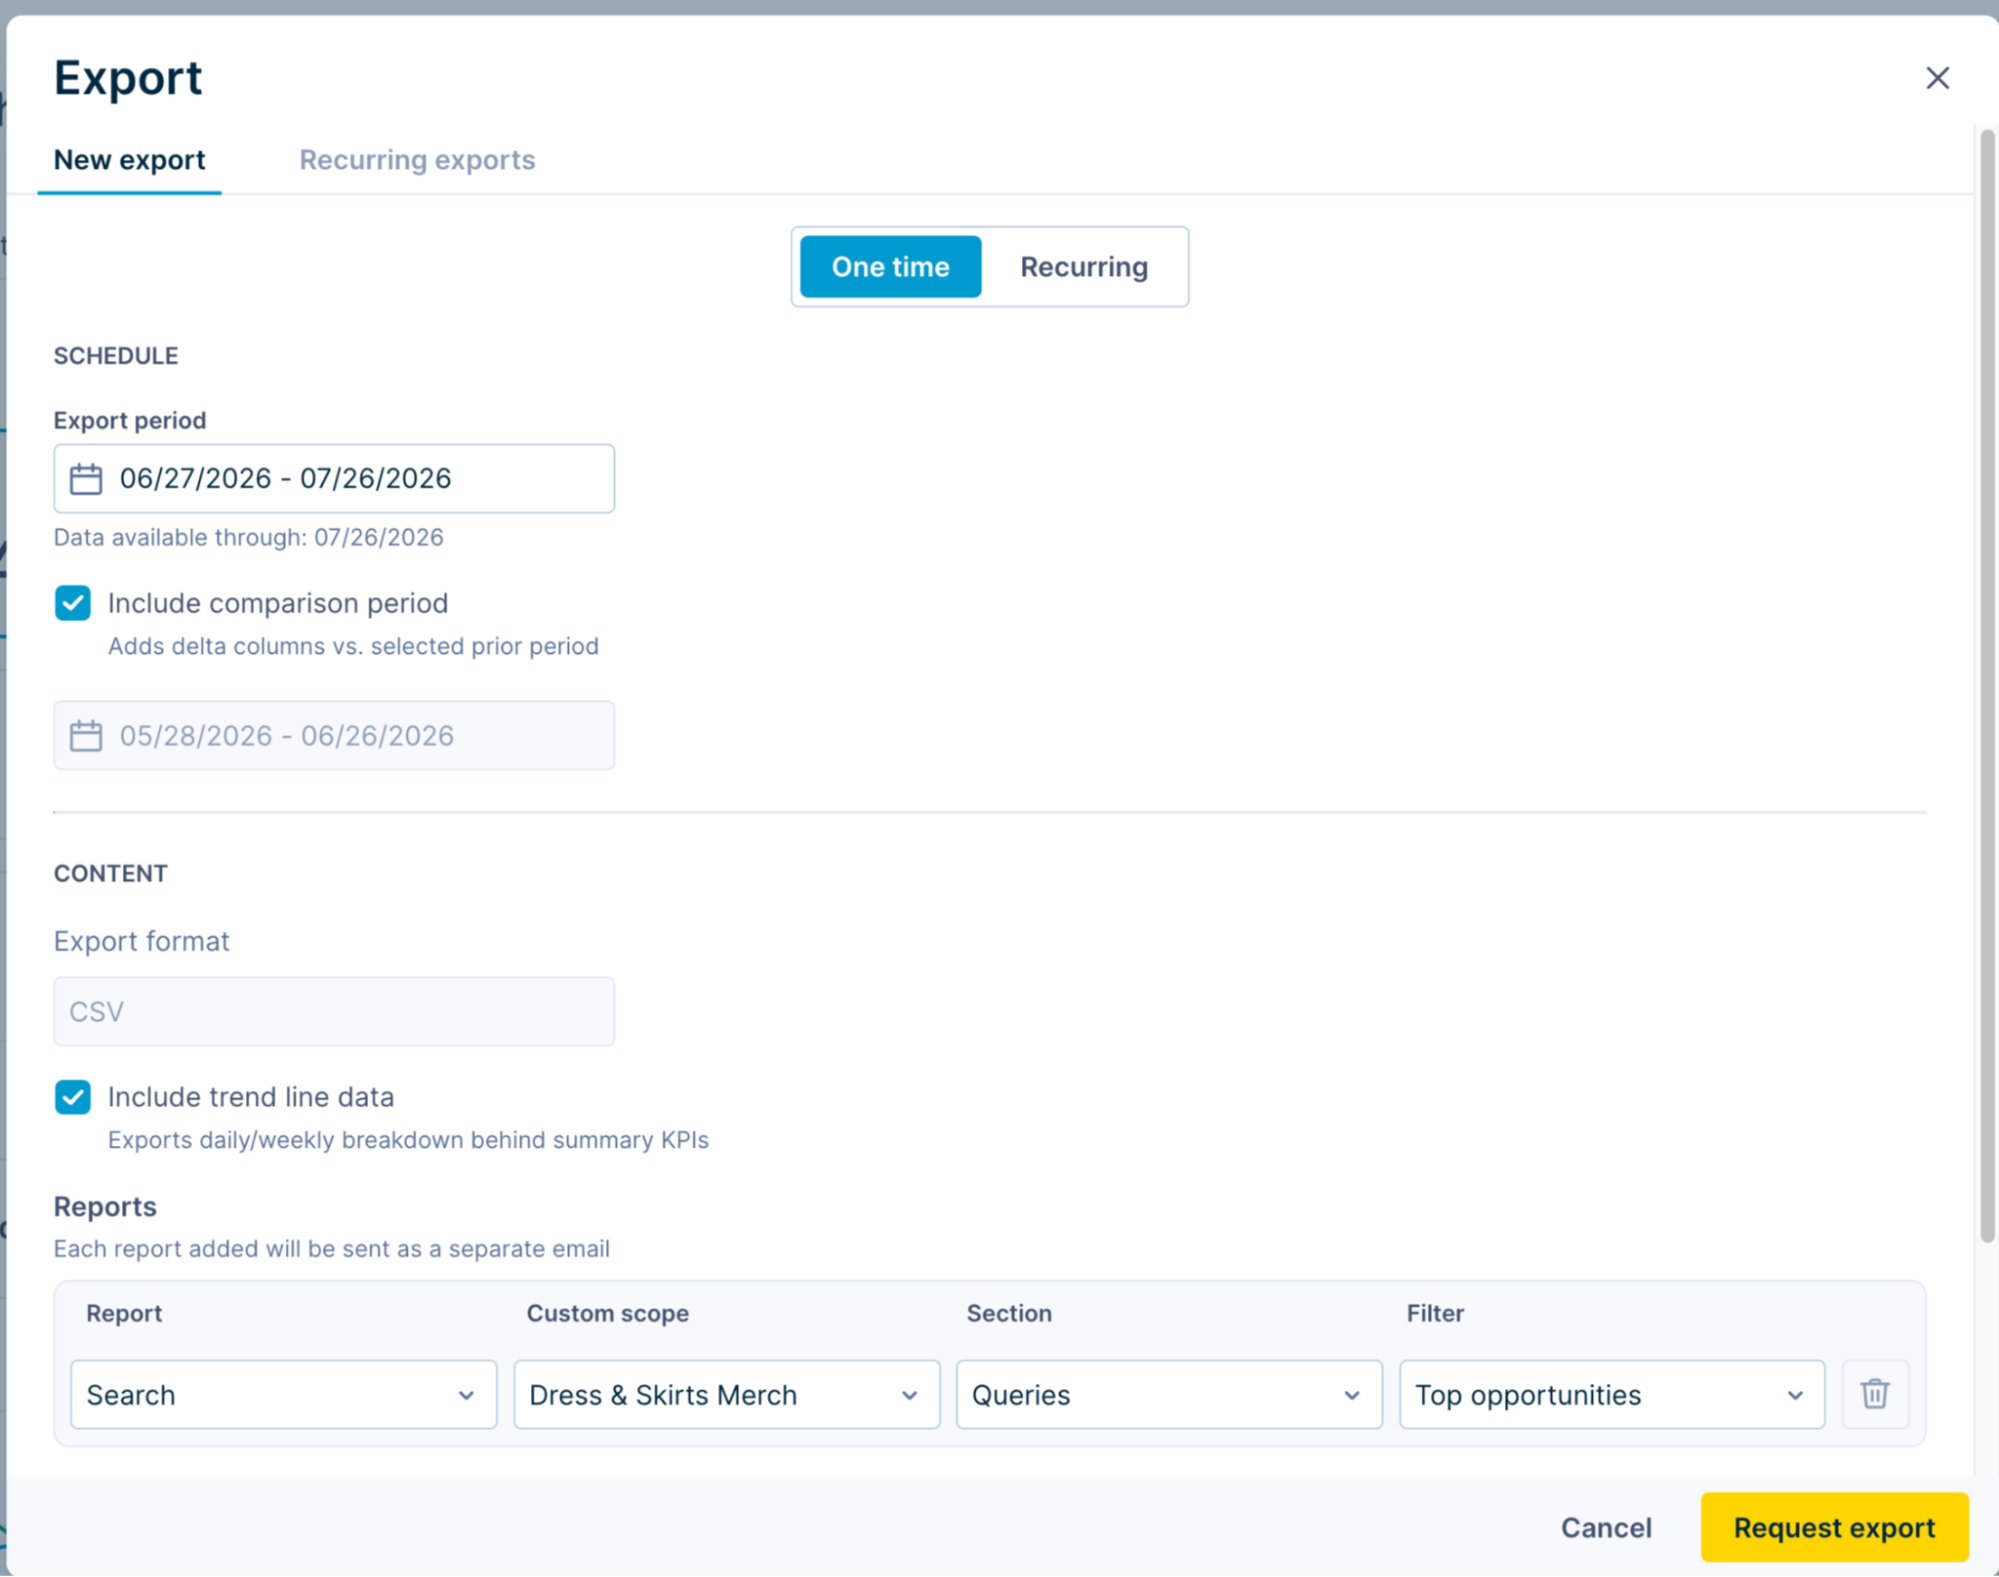
After you request an export, you can't request the same scope again for about 30 minutes. To export again right away, change the scope.
Recurring exports
Prerequisite: The recipients must have the Insights reports viewer permission to download the recurring reports via email.
-
Click Export.
-
Click the Recurring tab.
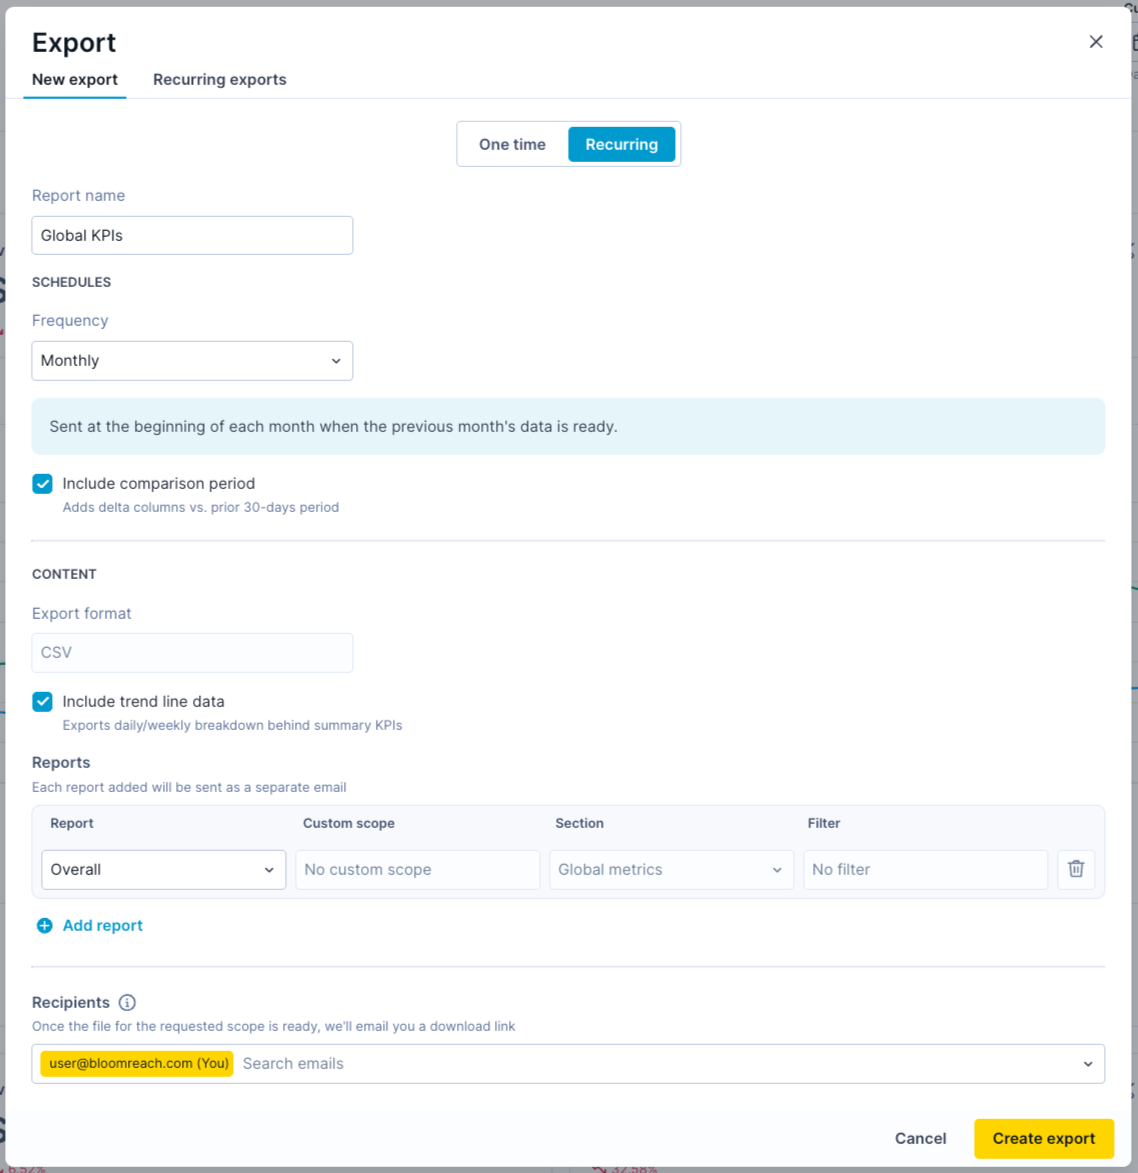
- Name the report.
- Set the frequency: daily, weekly, or monthly.
- Weekly lets you pick which day of the week the export is sent.
- Monthly sends the report at the beginning of each month.
- Choose whether to include a comparison period and trend line data alongside the summary numbers. Your export downloads as a CSV file.
- Add 1 or more reports to the export. Each report must have a unique scope, section, and filter and is sent as a separate email.
- Add recipients by email. Your email is populated by default. As you type, matching suggestions appear in the dropdown menu. The system fetches the users with Insights access at your level (say, account or site level). If an email address isn’t listed in the dropdown, contact Bloomreach Support for assistance in adding it.
- Select Create export to save the export.
Active recurring exports run on their designated schedule until modified or deleted. Exports don’t inherit from account to site levels. Reports trigger according to the exact level where they were created.
Manage recurring exports
Open the Recurring exports tab in the Export modal to see all exports you've set up. From here, you can:
- Toggle an export ON or OFF.
- Edit an export to change its schedule, reports, or recipients.
- Delete an export you no longer need.
- Check when an export was last sent and who received it.
Updated 4 days ago