

Overall metrics
This guide explains how to use the Overall tab to monitor your site's performance across all traffic.
What Overall tab shows
The Overall tab displays an aggregated, high-level view of your site's performance across all traffic. Use it to understand how your site is performing overall, monitor key metrics, and compare performance across periods.
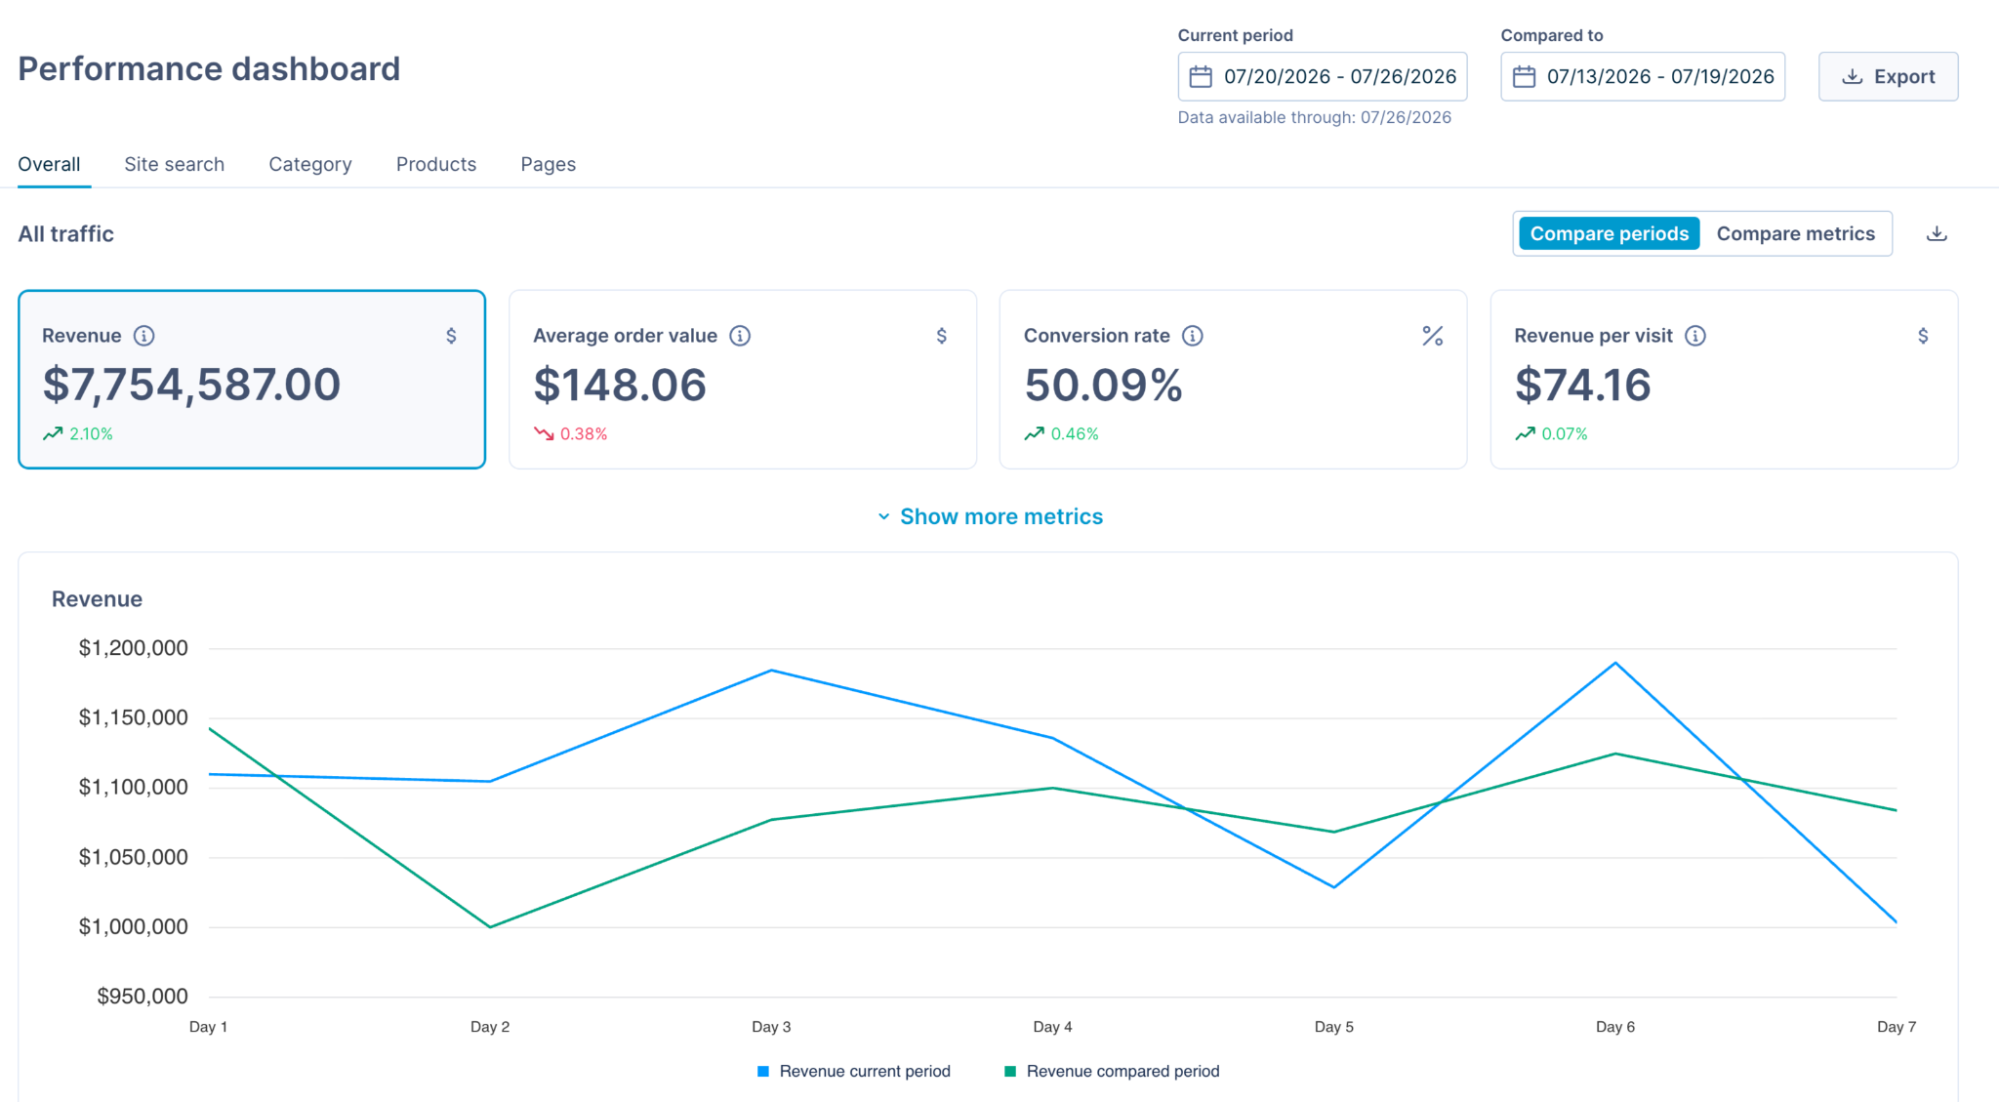
See the Performance dashboard overview to work with the date range, trends, metric comparisons, and exports.
Metric cards
The Overall tab displays the key business metrics. To work with the cards:
- Select Show more metrics to expand the full metric set.
- Select the information icon next to a metric name to view its definition and formula.
- Select the download icon to export the one-time CSV data.
Metrics chart
The chart plots your selected metrics over the selected period.
Drill down by device
View the performance metrics for each device type: desktop, mobile, and tablet. Compare how your site performs across different devices.
Updated 3 months ago
Did this page help you?