

Pages metrics
This guide explains how to use the Pages tab to monitor your site pages.
What Pages tab shows
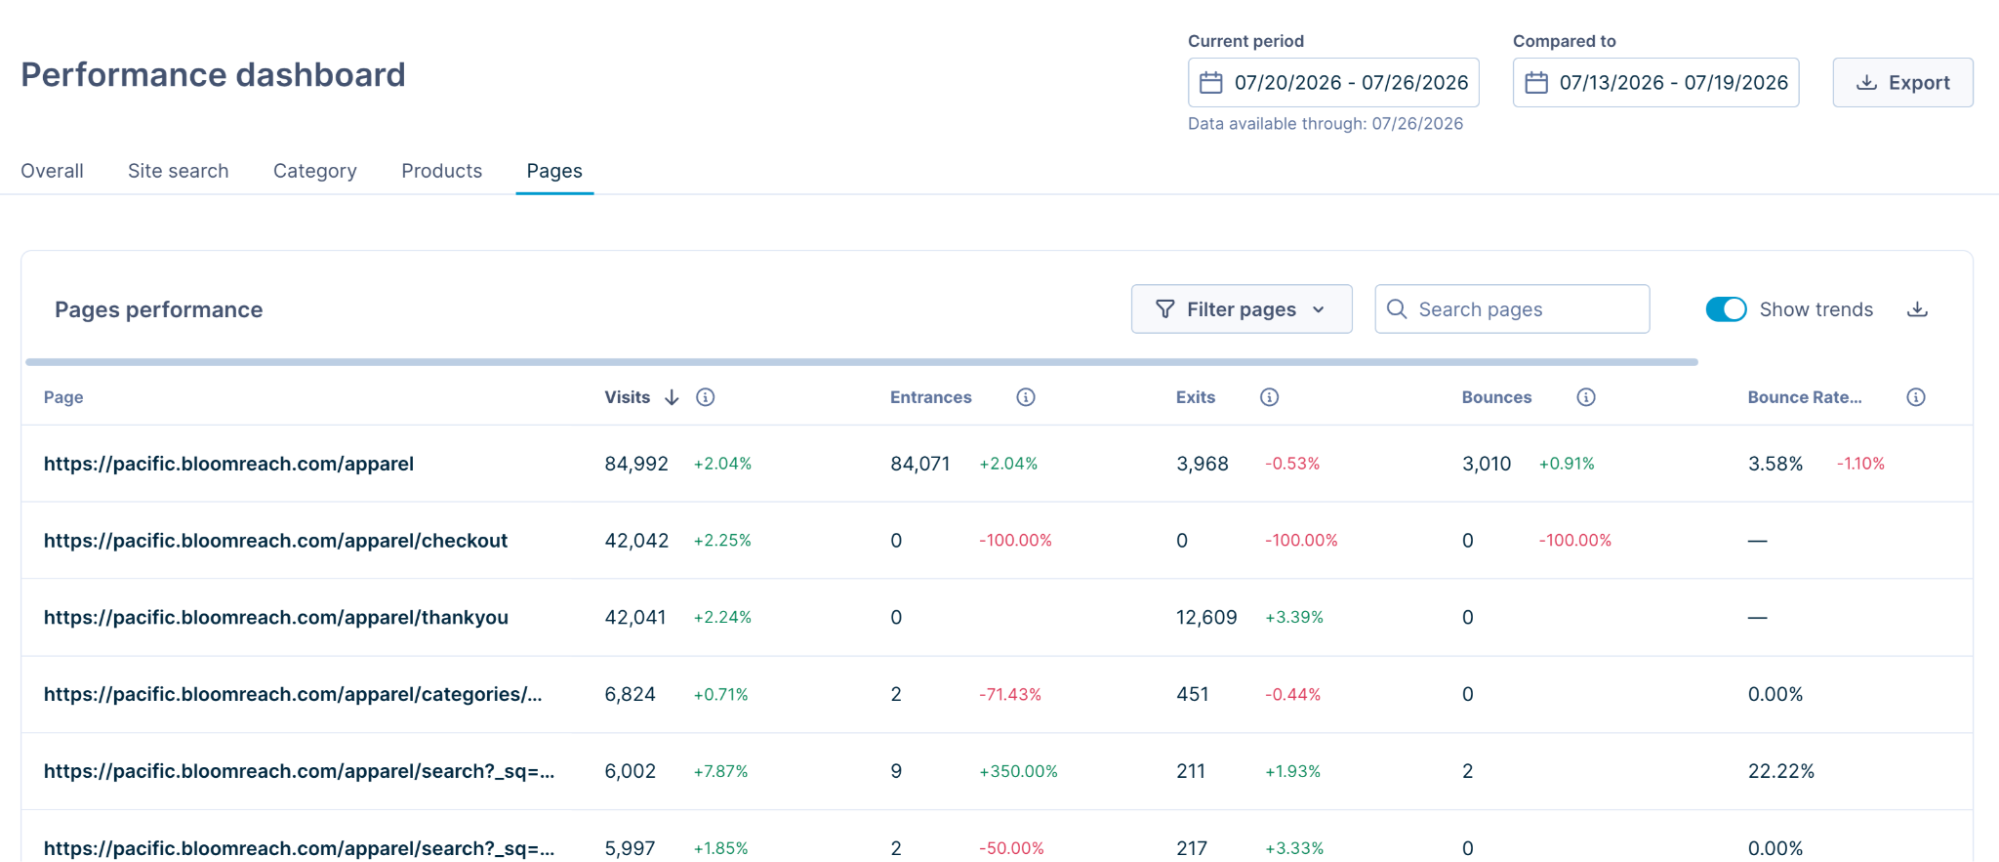
The Pages tab reports on the performance of individual pages across your site — your homepage, search results page, category pages, and checkout pages.
Use it to see which pages bring shoppers in, which pages they leave from, and where sessions end without further interaction.
See the Performance dashboard overview to work with date range, trends, filtering, and export.
Pages performance table
The table lists your pages and their metrics for the selected period. Each metric shows its value alongside a period-on-period change when Show trends is on — green for an increase, red for a decrease.
Segment by device
This table splits page performance by the device your shoppers used:
- Desktop: Performance for visits on desktop.
- Mobile: Performance for visits on mobile.
- Tablet: Performance for visits on tablet.
Select a sub-tab to filter all rows and metrics for that device. This lets you compare, for example, how your homepage performs on mobile against desktop.
Build pages performance reporting use cases
Compare a page across devices
See where a page underperforms on one device so you can prioritize a fix.
- Open the Pages tab and select Desktop, Mobile, or Tablet.
- Compare the same page's metrics across the device sub-tabs.
Find where customers leave
Sort the pages performance table by Exit rate, highest first. Find the biggest leak points, such as checkout steps.
Find high-bounce entry pages
See which landing pages lose customers immediately. Sort the performance table by Bounce rate, highest first.
Identify your top entry points
See where most sessions begin, so you can focus optimization there. Sort the performance table by Entrances, highest first.
Updated 3 months ago