

Category metrics
This guide explains how to use the Category tab to monitor category performance and find your top-performing pages.
What the Category tab shows
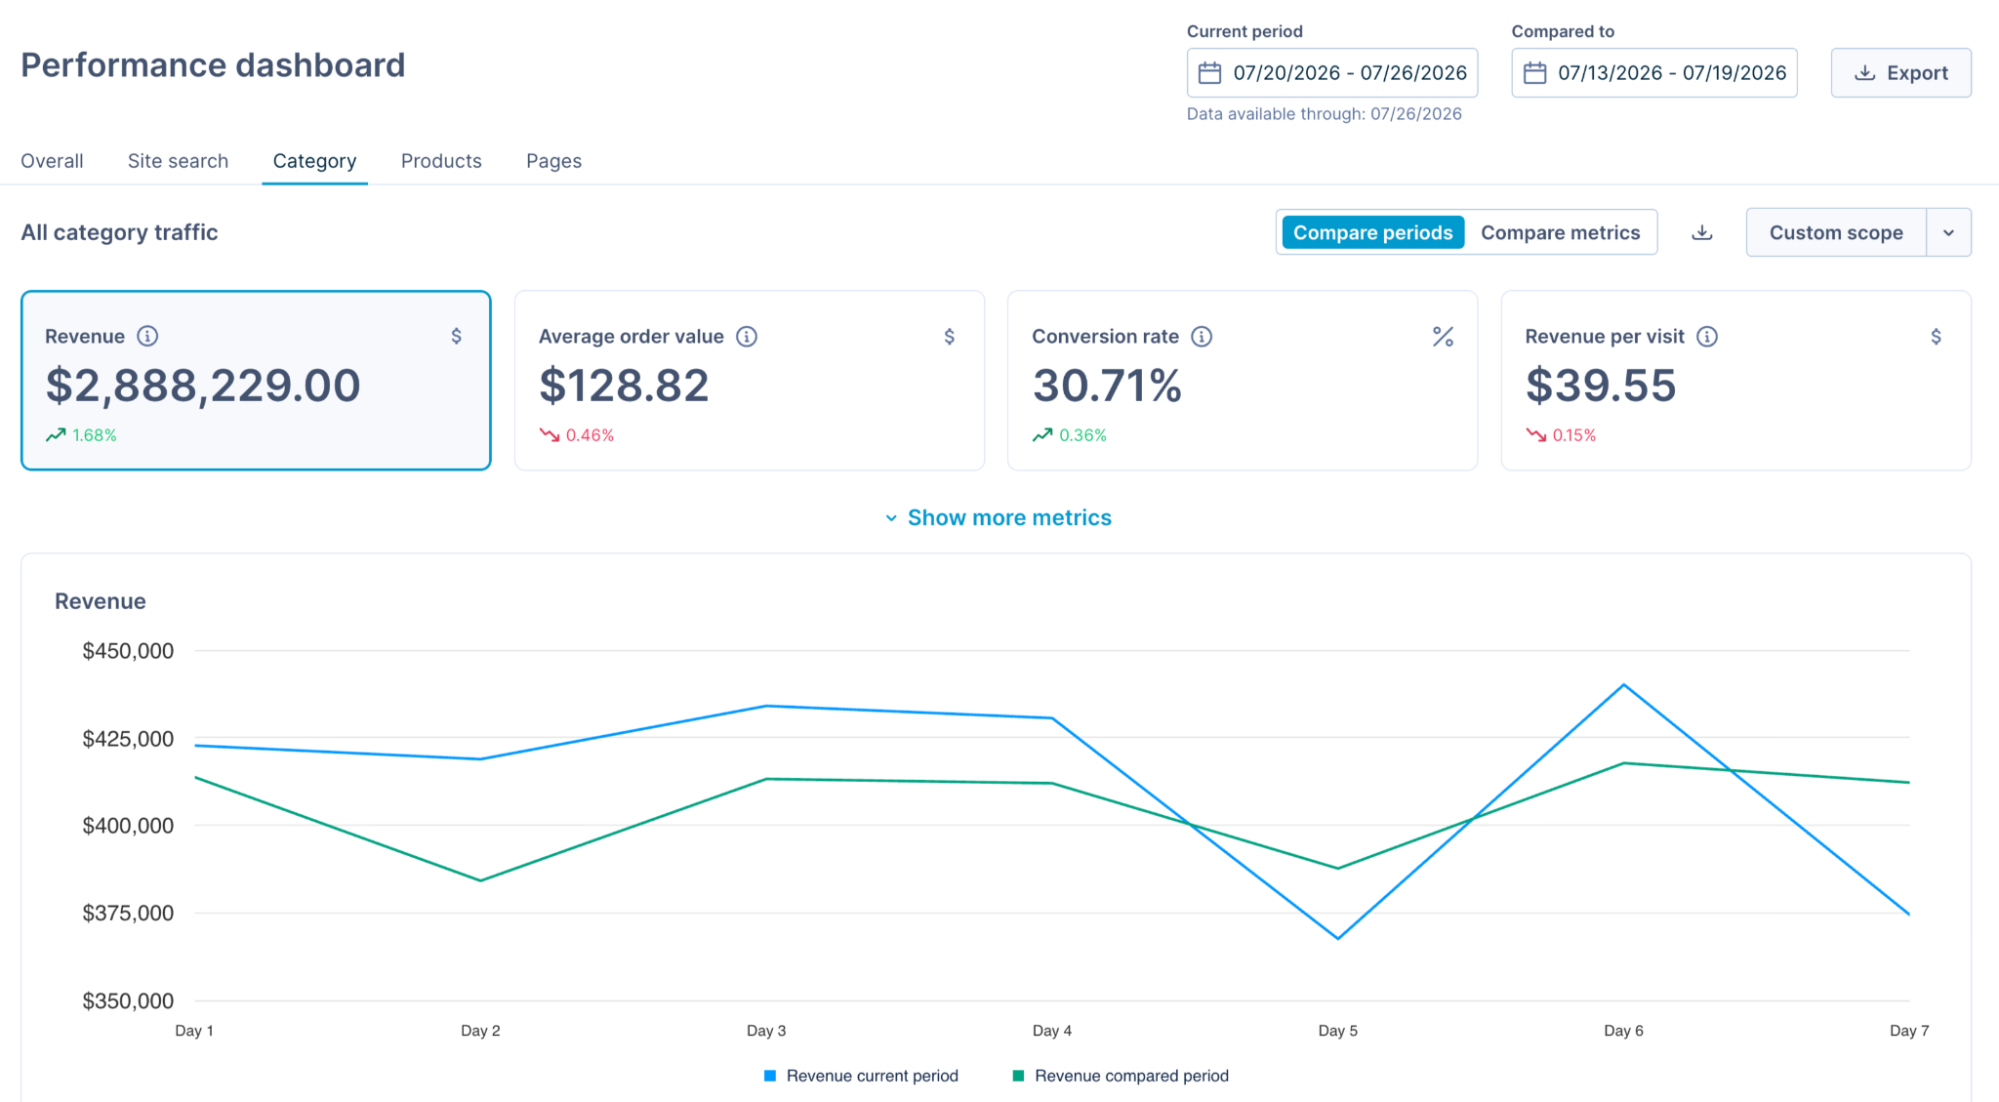
The Category tab displays performance for the category pages your shoppers are browsing. It combines metric cards, a chart, and a categories performance table.
Above the metric cards, a scope selector shows All category traffic by default. Use Custom scope to narrow every card, chart, and table to a defined set of categories.
See the Performance dashboard overview to work with the date range, trends, metric comparisons, and exports.
Metric cards
The Category tab displays the key metrics for all category traffic. To work with the cards:
- Select Show more metrics to expand the full metric set.
- Select the information icon next to a metric name to view its definition and formula.
- Select the download icon to export the one-time CSV data.
Metrics chart
The chart plots your selected metrics over the selected period.
Categories performance table
The categories performance table shows which category pages drive the most traffic, revenue, and conversions. Sort by any column, and turn on Show trends to display period-on-period change.
Drill down into a category
Select any category in the table to open a detailed view for that category, including its revenue trend over time. The drill-down includes:
- Metric cards scoped to that category.
- A chart.
- A performance table for the items driving that category.
- Previous paths and Next paths tables, which show what happened immediately before and after shoppers viewed this category. The tables work the same way as for queries, scoped to this category. See Analyze previous and next paths.
For example, for the category shoes, see which products drove the most revenue.
Build category reporting use cases
Find underperforming category pages
Spot categories with strong traffic but weak conversion.
- Build a custom filter. For example, Visits greater than 500 and Conversion rate less than 2%.
- Save it to track those categories over time.
Find highest-bounce categories
Rank category pages by bounce rate to find the weakest browsing experiences. With no filter applied, sort the categories performance table by Bounce rate, highest first.
Track newly launched category
Group new or seasonal categories and watch them as a set.
- Create a custom scope for the categories you introduced.
- Set the Current period to the category's launch date. The comparison auto-selects the prior window.
- Monitor the trends through launch.
Track category ranking-rule change
See how re-ranked category pages performed after the change.
- Create a custom scope for the affected categories with the is operator.
- Set the Current period to the rule's launch date. The comparison auto-selects the prior window.
- Monitor the trend.
For a pre/post view of a change, open the rule in the Impact measurement tab.
Find top products in a category
See which products drive a category, ranked your way.
- Select a category to open its drill-down.
- Sort the participating products table by the metric column that signifies top performance for your needs.
Updated 3 days ago