

Product metrics
This guide explains how to use the Products tab to monitor individual product performance.
What Products tab shows
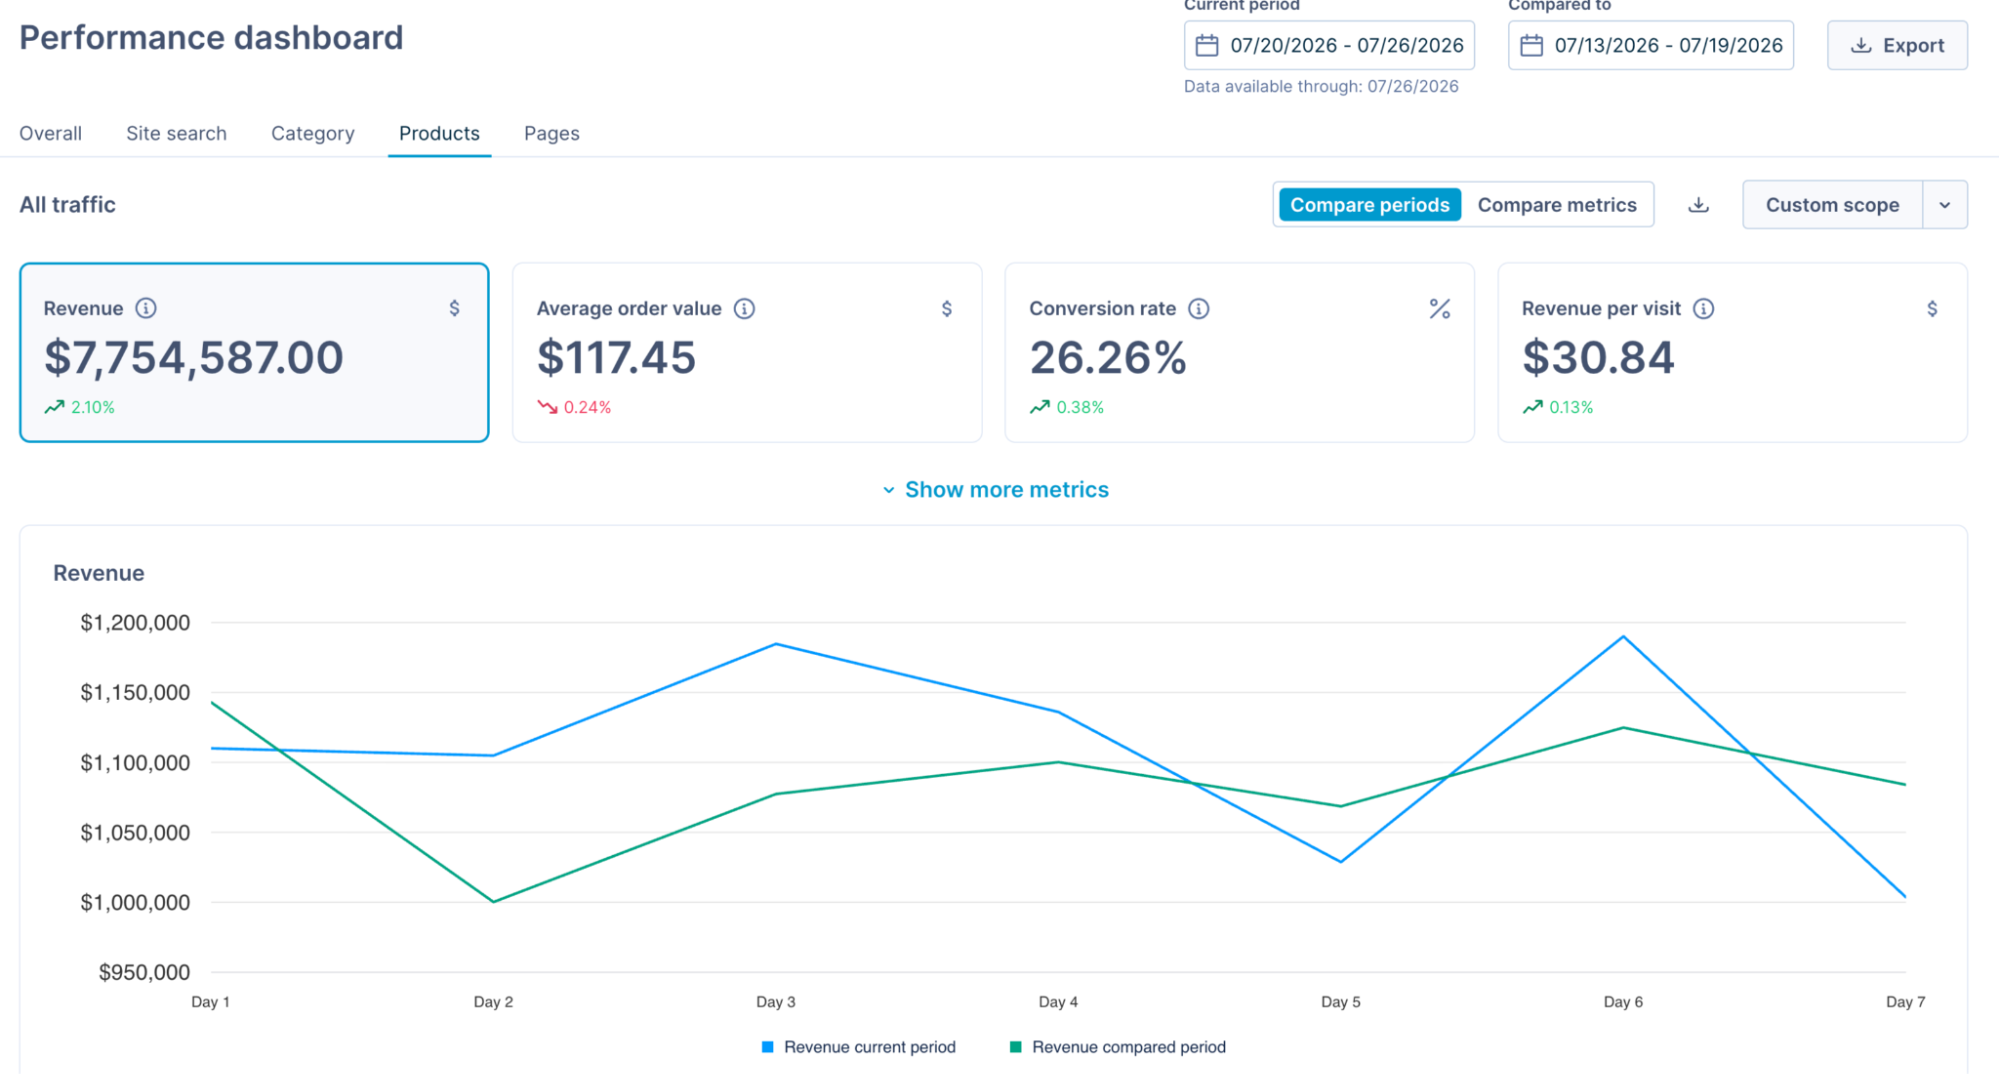
The Products tab displays your product performance from the top down. It combines metric cards, a chart, a products performance table, and a brands performance table, so you get both a high-level summary and product and brand-level detail in one view.
Above the metric cards, a scope selector shows All traffic by default. Use Custom scope to narrow every card, chart, and table to a defined set of products.
See the Performance dashboard overview to work with date range, custom scopes, trends, metric comparison, and export.
Metric cards
The Products tab displays the key product metrics across all traffic. To work with the cards:
- Select Show more metrics to expand the full metric set.
- Select the information icon next to a metric name to view its definition and formula.
- Select the download icon to export the one-time CSV data.
Metrics chart
The chart plots your selected metrics over the selected period.
Products performance table
The products performance table shows which products drive the most traffic, revenue, and conversions. Use it to find your highest-performing products and spot underperformers.
Sort by any column, and turn on Show trends to display period-on-period change next to each value. Use Filter products or search products to narrow the table.
Drill down into a product
The product drill-down is the reverse of the query and category drill-downs. Where a query drill-down shows the products participating in a query, a product drill-down shows the queries and categories the product participated in — the search terms and category pages that led shoppers to it.
A product detail view that opens with summary tiles, then breaks performance down by the queries and categories that led shoppers to the product.
Below the metric tiles and chart, table breakdowns show how shoppers reached the product:
- Sources of sale - Categories: visits, product page views, add-to-carts, conversions, and revenue for each category that led to the product.
- Sources of sale - Search: visits, product page views, add-to-carts, conversions, and revenue for each query that led to the product.
Brands performance table
The brands performance table shows the same metrics grouped by brand, so you can see which brands drive the most traffic, revenue, and conversions.
Brand reporting extends product-level reporting by aggregating all products that belong to the same brand and displaying their performance separately at the brand level.
Within each brand, you can also review the overall performance of the individual products that make up that brand.
Sort by any column, and turn on Show trends to display period-on-period change. Use Filter brands or search across brands to narrow the table.
Build product reporting use cases
Find your top products, your way
Sort the products performance table by Revenue or Conversions, or build a filter that combines the conditions you care about.
Find products with traffic but poor conversion
Surface products that get views but don't sell, so you can fix the product page or merchandising.
- Build a filter. For example, Product page views greater than 1,000 and Conversion rate less than 2%.
- Save it to monitor those products.
Track product launch or promotion
Group a set of products and watch them as one.
- Create a custom scope for the promoted products.
- Set the Current period to the launch date. The comparison auto-selects the prior window.
- Monitor the scope's cards, chart, and table through the promotion.
Understand how shoppers find products
See which searches and categories lead shoppers to a product, then optimize them.
- Select a product to open its drill-down.
- Review the Sources of sale - Search and Sources of sale - Categories breakdowns to see the paths shoppers take.
See sources of product sales
Find which searches and category pages generate a product's revenue, so you can double down on what sells it.
- Select a product to open its drill-down.
- In the Sources of sale - Search and Sources of sale - Categories breakdowns, read the revenue next to each query and category. These are the sources that drove the product's sales.
- Note the queries and categories that contribute the most revenue, then reinforce them through ranking or merchandising.
Updated 3 months ago