
API requests
What is the API requests dashboard?
The API requests dashboard under the Usage application shows data-driven statistics and reports on your Organization’s usage of Bloomreach Discovery APIs.
It allows you to filter and aggregate the data per your needs to help analyze usage patterns and traffic to make better decisions impacting the business and revenue.
Whether you're interested in tracking your usage trends over time, keeping an eye on resource utilization, or staying within your usage quotas, these reports can serve a variety of use cases.
Access the API requests dashboard
A Bloomreach user with any read or write user role can view API requests under the Usage application.
Additionally, the Usage report viewer role can be granted to a specific user on the organization or account level for restricted view-only access to analytics data.
To view API request usage, go to “Setup > Usage > API requests” in the Bloomreach dashboard.

NoteBy default, the report shows usage for the entire organization, irrespective of the account or site currently being viewed. Account level usage statistics can be viewed by applying the "Account Name" filter.
Report components
The generated usage report has different components to help find what’s most important to you at a glance. This section will briefly walk through each component, see what information they provide, and how you can use it to make more informed decisions.
Good to knowData calculation
The report’s data is calculated by using aggregation pipelines on the API requests that our internal system receives.
Global Reporting
If you use the Bloomreach dashboard on multiple regions (e.g., us.search.bloomreach.com and eu.search.bloomreach.com), you’ll see the globally aggregated usage data for all regions. You can apply an Account filter to get data for specific accounts within these regions.
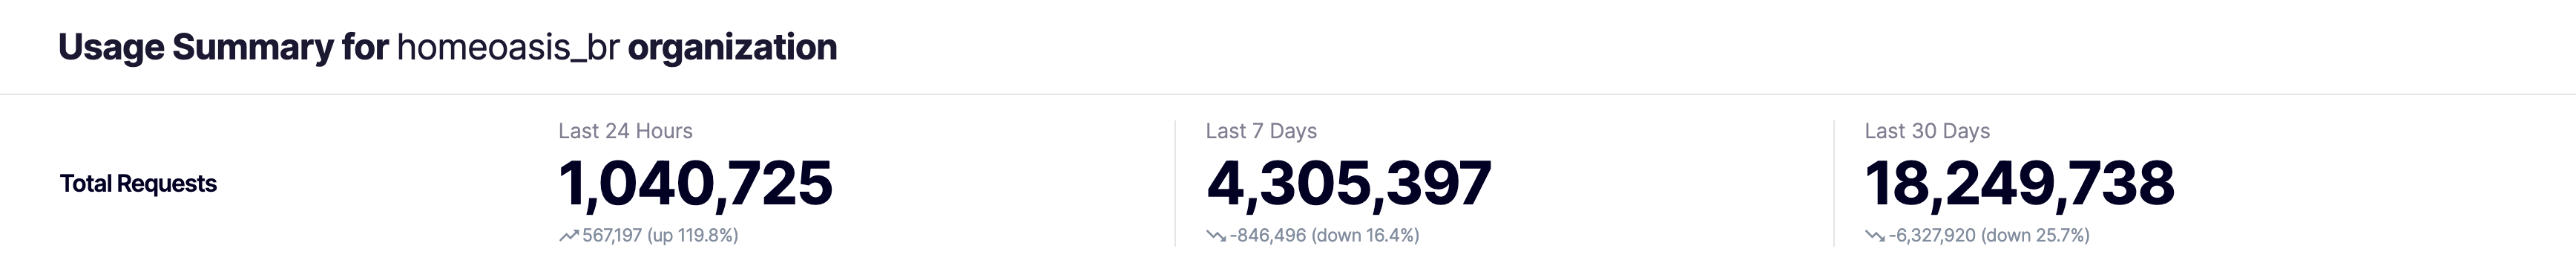
Total requests
The Total Requests section displays the total number of all types of API requests made in the last 24 hours, last 7 days, and last 30 days. These numbers are for your entire organization and can be considered as Key Performance Indicators. Note that this includes all the Request Types aggregated.
Under the number of requests made, you can find the absolute increase/decrease in that number (and % change) from the previous 24 hours, 7 days, and 30 days, respectively.
All this data can be helpful for tracking adoption and usage over time and identifying potential trends or patterns in how your service is being used. You can alter your resource allocation based on the search traffic you’re getting.
For example, if you see a sudden spike in total requests, you might want to consider allocating more resources. A steady increase in search requests might indicate increased demand for your products, so you can focus more on the business plans to continue with the growth and capitalize on the opportunity. The data can also help you troubleshoot issues. A decrease in the number of requests might be due to performance issues or other pain points in your website.
Request count
The Request Count section is a bar graph visualization of your organization’s API request data. Unlike the Total Requests section, this is an interactive section, and you can manipulate and configure the graph by drilling down the bars using filters and ranges.
The visual representation is perfect for quickly finding low-performing days/months and looking at variations.
NoteHover over different bars in the bar graph to see the exact dates, request count and request type that the bar represents.
Configuring the graph
Date range
To get the data for a specific time duration, apply a Date Range. The default view shows the Last 30 Days’ data, but you can choose from Last Year, Last Month, or even a custom date range from the calendar.
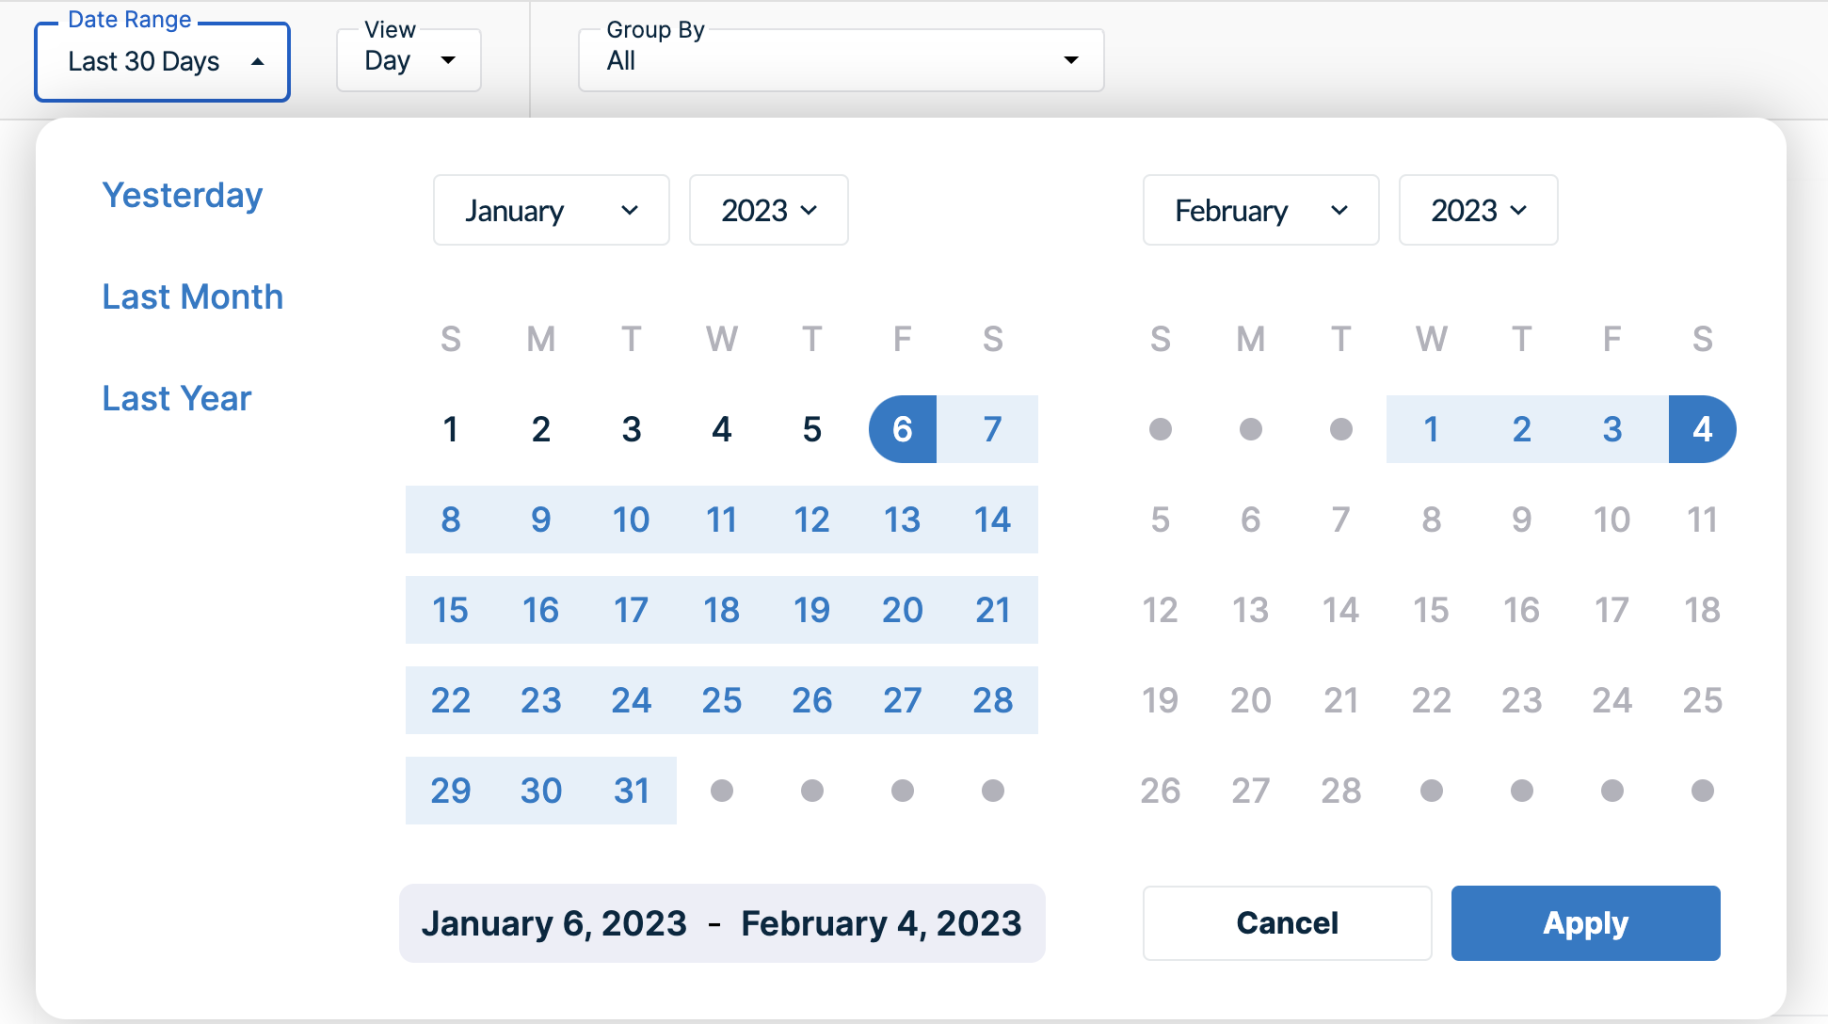
Analyzing the data from a specific time duration, like a quarter or your sprint duration, helps you quickly and easily compare the trends and patterns of usage. You can use that to find the areas of improvement, gain a deeper understanding of the drivers behind your usage and find seasonal opportunities.
View
You can easily switch between Day-wise or Month-wise views. Each bar will represent a day if you select “Day” and a month if you select “Month”.
Group by
Group By helps you group and aggregate the search request data by different parameters. By grouping the data, you will be able to see the individual figures for different available values of the selected parameter. For example, if you select “Environment”, the graph will highlight which requests were made from production and staging differently for the selected time range.
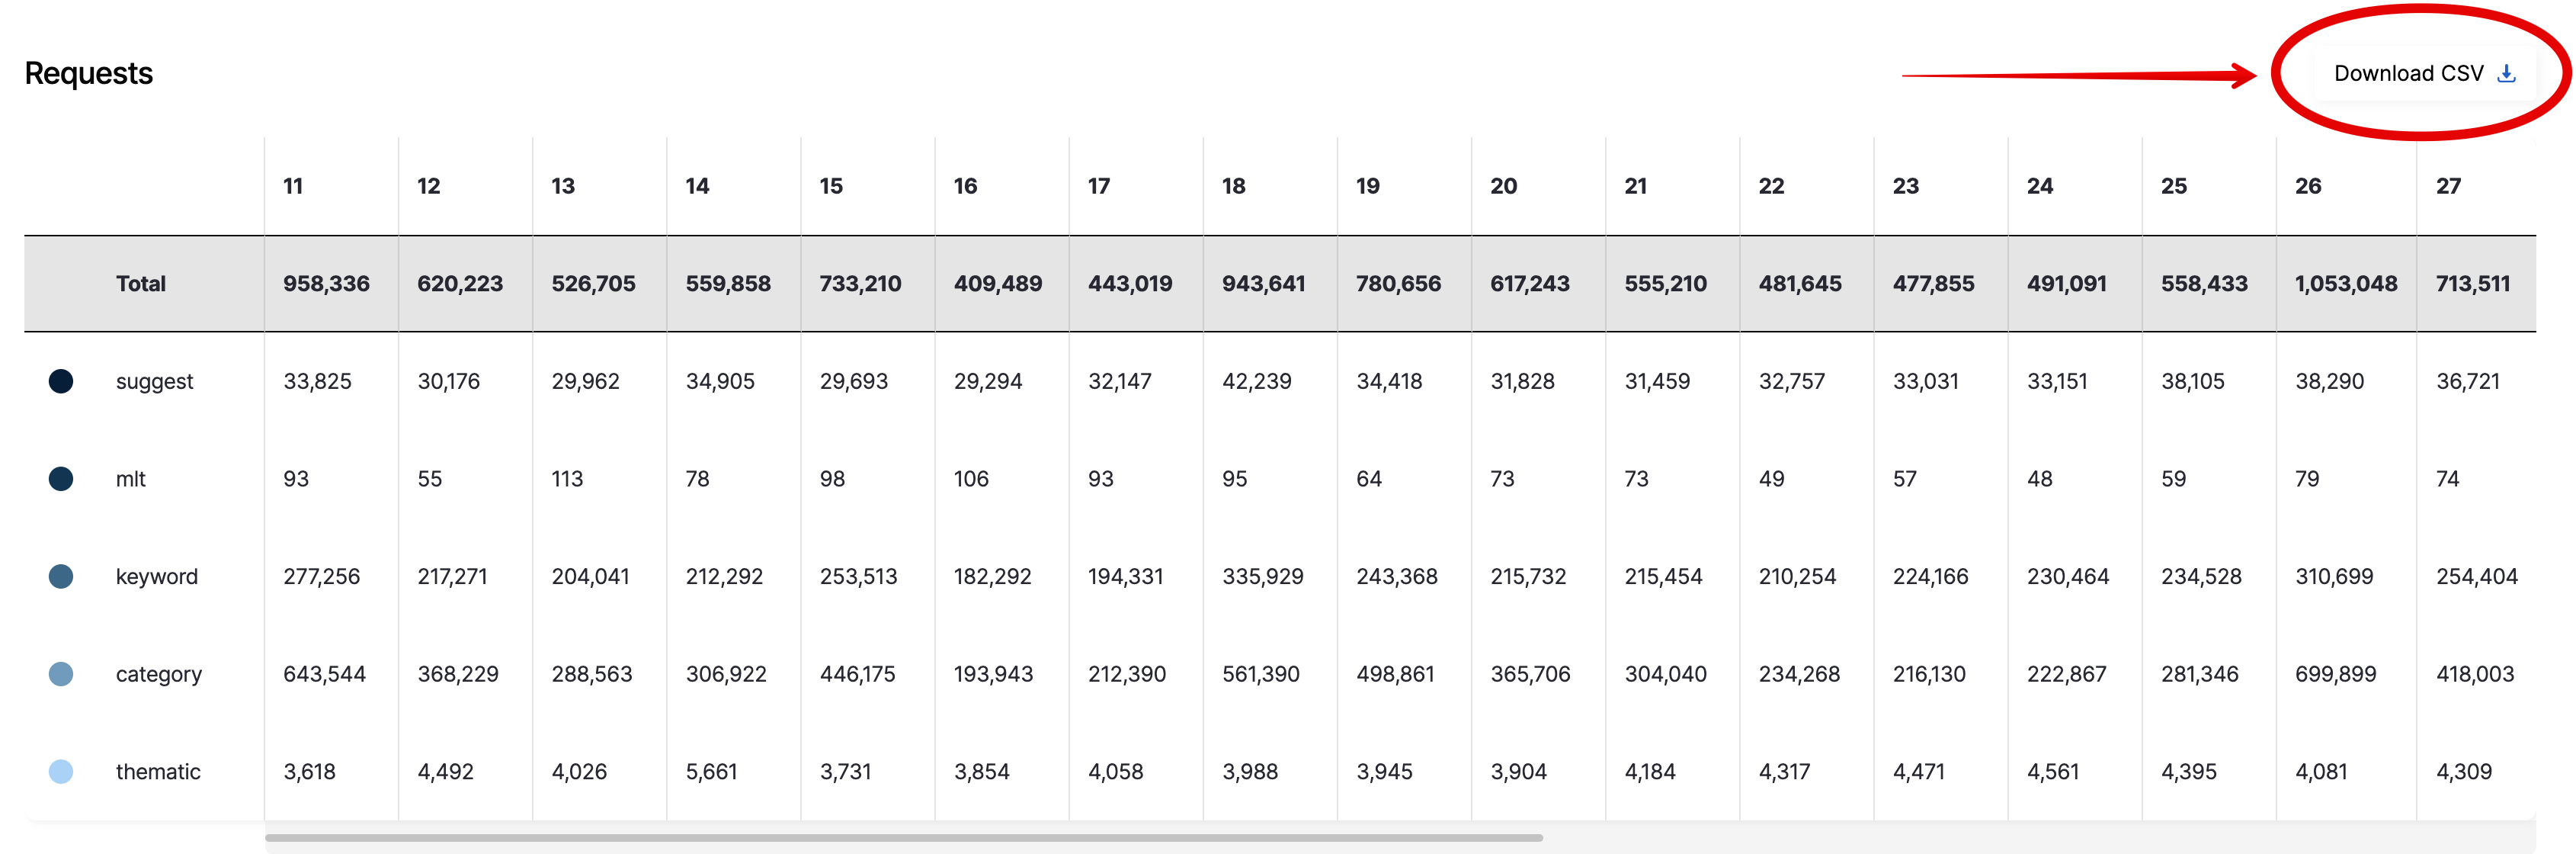
Requests
The Requests section shows the same data as above but in tabular format to help you analyze the absolute numbers in more detail.
We also provide a Download CSV button to let you download the tabular data as a CSV file if needed.
Filters
A powerful way to make the best out of the Usage Summary dashboard is to use the different available filters and only focus on the data that is most relevant to you.
Here are the filtering capabilities available currently for the usage statistics:
Environment
You can filter the API requests for the production and the staging environment. You don’t need to go to tools-staging to access usage for staging.
Filtering by the environment helps distinguish between production and staging requests.
Status code
You can filter the API request data by the HTTP status code.
Filtering by status code allows you to identify points of failure and errors. By focusing on requests with a response code of 400 or 500, you can quickly identify issues such as invalid requests, authentication failures, or server errors, and take the appropriate action to resolve them. Additionally, it can also help you monitor the performance and availability of your site’s functionalities.
HTTP status codes are grouped for convenience:
- OK responses: 200 codes (200-299) are in a group “2xx”
- Client errors: 400 codes (400-499) are in a group “4xx”
- Server errors: 500 codes (500-599) are in a group “5xx”
Request type
If you’re interested in looking at your usage of a specific Bloomreach API, you should filter by Request Type.
Here’s a list of the different request types and what they mean:
| Request Type | Meaning |
|---|---|
| keyword | The Product Search API sends a keyword query to retrieve results about products and other content on your site |
| mlt | More Like This (MLT) extends search results to show visitors more products similar to a product that they already searched for or viewed |
| bestseller | The Bestseller API returns the products that are likely to generate the most revenue |
| suggest | Autosuggest guides site visitors by providing search term suggestions, which are sometimes called autocomplete or type-ahead |
| category | The Category API sends a category query to retrieve results about products within the categories that you specify |
| jfy | Just For You (JFY) is a Product Recommendations service that displays product recommendations for customers based on their browsing history |
| keyword-widget | The Keyword-based Widget API sends a keyword or query to get the product results via a widget |
| category-widget | The Category-based Widget API sends a keyword or query to get the product results via a widget |
| co-viewed | The Recommendations Widgets API that shows the co-viewed products (Frequently Viewed Together) |
| co-bought | The Recommendations Widgets API that shows the co-bought products (Frequently Bought Together) |
| recently-viewed | The Recommendations Widget API that shows recently viewed products in the widget |
| trending | The Recommendations Widget API that shows the trending products across that category |
| past-purchases | The Recommendations Widget API that shows the products included in the past conversions |
| experience-driven | The Recommendations API that displays highly targeted product recommendations by leveraging Bloomreach Search understanding as well as site browsing behavior (also known as "realtime_recs") |
| invalid-widget | All the incorrect requests we receive for the Widget APIs. If you are seeing many of those, check your widget integration, consult your monitoring and observability platform, or reach out to Bloomreach support. |
| thematic | Thematic pages are customized landing pages that are similar to category pages |
| visual-upload | The Upload API endpoint used to upload an image for Visual Search |
| visual-search | The Visual Search API fetches a list of objects and similar products identified from an uploaded image. If multiple Visual Search requests are made on the same image, they will not increase the visual-upload count |
| visual-widget | The Visual Recommendations API fetches a list of objects identified from the Item ID and SKU ID combination passed to the Visual Search API |
NoteThe “invalid” type denotes requests for which a Request Type is not detected. Check your integration, consult your monitoring and observability platform, or reach out to Bloomreach Support.
Catalog
The Catalog filter helps identify the number of requests made to a particular catalog.
This can be helpful if you want to focus on a few particular catalogs and optimize product performance or manage inventory.
Note“invalid” Catalog denotes requests where a catalog is not detected.
Account name
The default view shows your Organization-wide usage statistics. It is highly likely that you will need to drill that down to a particular account’s usage and only focus on that data.
This can be helpful if you’re looking, for example, for the trends in traffic from a specific region that that account is for.
Data type
If you are using both Product search and Catalog search, choosing their corresponding data types will narrow the results down by the type of search performed (or the type of data returned):
- "product" - for Product search (returns product data)
- "content" - for Content search (returns content page data like blogs, articles, etc)
Updated about 1 month ago